Download presentation
Presentation is loading. Please wait.

1
Due Diligence of GE Shipping
51% acquisition by Essar Ltd. 1

2
Group 2 Abhishek Paronigar PGP Mansi Tandon PGP Soumyadipta Dey PGP Richa Gupta PGP Rohit Kanuga PGP

3
Overview of the presentation
Global Perspective of Shipping Industry Brief Snapshot of GE Shipping (GES) Analysis of Fleets, assets, employees Past Financials The Shipping Industry Investment Perspective Valuation
 Analysis of Fleets, assets, employees. Past Financials. The Shipping Industry. Investment Perspective. Valuation.")
4
Global Perspective On Shipping Industry
The Shipping Industry Global Perspective On Shipping Industry

5
Shipping Industry Shipping Industry
Shipping industry is a primary means of international transportation of any essential commodity. Around 80% of the cargo moved today is seaborne and almost 100% of hydrocarbon is transported through ocean. The global shipping industry can be broadly classified into wet bulk (like crude and petroleum products), dry bulk (like iron ore and coal) and liners (like containers and others). There are various benchmarks that determine freight rates for these segments. The prominent amongst them are Baltic Freight Index, Baltic Handymax Index (for dry bulk segment) and World Scale (for tankers). The capacity of Indian shipping industry is estimated at 8.6 million grt (gross registered tonnage) with a fleet size of about 686 ships. The average age of Indian shipping fleet is 17.9 years compared to the world average of 19 years. Let us take a look into the demand and supply drivers for the shipping sector and also discuss the key factors that investors need to consider while investing in stocks from the sector. 5
, dry bulk (like iron ore and coal) and liners (like containers and others). There are various benchmarks that determine freight rates for these segments. The prominent amongst them are Baltic Freight Index, Baltic Handymax Index (for dry bulk segment) and World Scale (for tankers). The capacity of Indian shipping industry is estimated at 8.6 million grt (gross registered tonnage) with a fleet size of about 686 ships. The average age of Indian shipping fleet is 17.9 years compared to the world average of 19 years. Let us take a look into the demand and supply drivers for the shipping sector and also discuss the key factors that investors need to consider while investing in stocks from the sector. 5.")
6
Shipping Industry: Global Trends
Oversupply of vessels imminent Rapidly growing World Fleet Orderbook at 20% YOY Rise in the delivery of vessels, growth of 15% YOY in 2005 Decline in scrapping to 9-14 DWT from DWT to increase available shipping Freight rates to decline by 5% -20% for various vessel types in the coming 2-3 years Oversupply of vessels is imminent The world merchant fleet (tonnage) has grown at a rate of 4.1% YoY in the last 42 years while, the world cargo has grown at a rate of 3.9% during the same period. The slump in trade during the 1979 to 1983 led to this marginal slower growth for cargoes when compared to tonnage. In the recent past, trade cargo has grown at a CAGR (00-04) of 4% while tonnage has grown at 3.4% during the same period. This has led to the increased productivity of tonnage capacity and rise in freight rates. World fleet orderbook growing rapidly At the end of 2005, the world orderbook stands at 236 mn DWT. The vessel orderbook has grown at a CAGR of 7% during the period between 1990 and Since then it has grown at faster pace of 20% each year till The global orderbook has more than doubled since The bulging order size would lead to rise in deliveries of vessels in the next 2-3 years. Bulging orderbook leading to rise in deliveries of vessels The huge orderbook size would result in deliveries of vessels to rise in the coming 2-3 years as evident from the 71 mn DWT delivery in During the period from 1990 to 2000, deliveries have grown at a CAGR of 8%. Since then, the growth has stepped up to 10% YoY till the end of In 2005, vessel deliveries have registered a growth of 15% YoY from 61 mn DWT in 2004 to 71 mn DWT. This is expected to lower the freight charges by 5% to 20% for various vessel types. Scrapping to decline The scrapping for deliveries of vessels during the period between 1972 and 1976 has already happened in 3 phases. The current scrapping will be in the range of mn DWT in the coming 2-3 years as compared to previous levels of mn DWT. Freight Rates for shipping services declining The average freight rates for the shipping sector declined by 13% YoY from US$ 30,000/day in 2004 to 1US$ 26,000/day in 2005 driven by increase in vessel supply and slowdown in trade activity. When compared to 2003 the average freight rates for 2005 has registered an increase of 39% even though the peak levels of 2003 at US$ 31,000/day were higher. This highlight the trough levels of rates in 2005 were higher to troughs of We expect the freight rates to remain subdued registering a decline of 5% to 20% for various vessel types. 6
 has grown at a rate of 4.1% YoY in the last 42 years while, the world cargo has grown at a rate of 3.9% during the same period. The slump in trade during the 1979 to 1983 led to this marginal slower growth for cargoes when compared to tonnage. In the recent past, trade cargo has grown at a CAGR (00-04) of 4% while tonnage has grown at 3.4% during the same period. This has led to the increased productivity of tonnage capacity and rise in freight rates. World fleet orderbook growing rapidly. At the end of 2005, the world orderbook stands at 236 mn DWT. The vessel orderbook has grown at a CAGR of 7% during the period between 1990 and Since then it has grown at faster pace of 20% each year till The global orderbook has more than doubled since The bulging order size would lead to rise in deliveries of vessels in the next 2-3 years. Bulging orderbook leading to rise in deliveries of vessels. The huge orderbook size would result in deliveries of vessels to rise in the coming 2-3 years as evident from the 71 mn DWT delivery in During the period from 1990 to 2000, deliveries have grown at a CAGR of 8%. Since then, the growth has stepped up to 10% YoY till the end of In 2005, vessel deliveries have registered a growth of 15% YoY from 61 mn DWT in 2004 to 71 mn DWT. This is expected to lower the freight charges by 5% to 20% for various vessel types. Scrapping to decline. The scrapping for deliveries of vessels during the period between 1972 and 1976 has already happened in 3 phases. The current scrapping will be in the range of mn DWT in the coming 2-3 years as compared to previous levels of mn DWT. Freight Rates for shipping services declining. The average freight rates for the shipping sector declined by 13% YoY from US$ 30,000/day in 2004 to 1US$ 26,000/day in 2005 driven by increase in vessel supply and slowdown in trade activity. When compared to 2003 the average freight rates for 2005 has registered an increase of 39% even though the peak levels of 2003 at US$ 31,000/day were higher. This highlight the trough levels of rates in 2005 were higher to troughs of We expect the freight rates to remain subdued registering a decline of 5% to 20% for various vessel types. 6.")
7
Trends in Tanker Segment
Current Freight rates in the tanker segment have peaked Quarterly cyclicality in oil demand leads to volatility in freight rates Future Outlook Seaborne trade of oil to be impacted by slow-down in incremental demand for oil Product Tankers earnings to be less volatile Scrapping to decline as average age of tanker fleet decline China and India to fuel growth 7

8
Trends in Bulk Segments
Current Dry Cargo index declining Dry cargo trade to growth at 4% to be slower Future Outlook Surplus tonnage in dry bulk segment to result in freight decline Cape size vessel deliveries in the coming years to be higher than historical levels China turning into a net exporter of steel 8

9
Trends in Container Segments
Current Freight rates peaked in the container vessel segment in Apr'05 and is in the range of US$ 34,000/day - US$ 44,000/day Deliveries growing rapidly Future Outlook Freight rates to go down in the coming months 9

10
Offshore Business 10 Demand & Supply of Dry Bulk
Energy Security promoting Offshore business Additional Investment & Cash reserves of Oil companies being used for E&P projects Strong rig demand promoting surge in day rates Bulk Carriers Scenario Deliveries for new offshore support vessels insufficient to meet demand Demand for larger vessels to increase over the next 3 years as drilling moves deeper 10

11
Tonnage Surplus Decreasing surplus leading to freight rates peaking
The surplus has declined for all kinds of fleets. Tonnage supply in the oil tanker sector increased by 12.3 million dwt in 2004 to million dwt as new buildings delivered outweighed tonnage scrapped, laid up or lost. This, combined with increased shipments and extended haulage, brought down overcapacity from 6 million dwt in 2003 to 3.1 million dwt or 1.1% surplus. In 2004, the total dry bulk fleet supply increased by 27.6 million dwt to million dwt. Overtonnage for this type of vessel declined from 3.6 million dwt in 2003 to 2.1 million dwt in 2004, or 0.6% surplus. For the conventional general cargo fleet, overcapacity stood at the same level in 2004 as in 2003, with supply exceeding demand by only 0.7 million dwt or 1.6% surplus. Overall, the shrinkage in surplus and increased demand resulted in freight rates increasing in During 2005, the trend of declining freight rates that was witnessed in H1FY2006 continued during Q3FY2006 as is evident from the figure below. The fall in freight rates were primarily due to increased fleet growth. After a sharp increase at the end of calendar 2004, the Baltic Dry index declined since mid-April 2005. Decreasing surplus leading to freight rates peaking Increased delivery and reduced scrapping will lead to increase in tonnage surplus and thus fall in the freight rates 11

12
The Shipping Industry Indian Shipping Industry

13
India Crude Reality India is 6th largest Oil Consumer (112mt per annum) 2nd largest growing market (10 yr CAGR at 6.1%) 7th Largest Oil Importer (77% of domestic consumption) Oil Imports ($38.70 bn contribute 47.20% of total imports) Going Forward Additional capacity expansion to result in potential market for shipping crude into India LNG trade is going to be a growing sector 13
 Oil Imports ($38.70 bn contribute 47.20% of total imports) Going Forward. Additional capacity expansion to result in potential market for shipping crude into India. LNG trade is going to be a growing sector. 13.")
14
Indian Shipping Fleet Growth
The Indian shipping industry’s tonnage position at the beginning of the 10th Five Year Plan (2002) was 6.97 million GT. The tonnage position improved to 7.70 million GT (or million dwt) with 669 vessels at end- 2004. 14
 was million GT. The tonnage position improved to 7.70 million GT (or million dwt) with 669 vessels at end")
15
Indian Tonnage Vs World
Introduction of tonnage tax to boost Indian tonnage Share of Indian ships in Indian overseas trade at 15% 15

16
Indian Fleet Vs World Fleet Profile
The fleet profile of Indian Shipping Industry is different from the World Shipping Industry. In India, VLCC accounts for around 3% of the total fleet in terms of DWT whereas, globally, VLCC tankers account for 12% of the total fleet. Aframax tankers with around 26% share constitute the highest proportion of the Indian fleet. Globally, small ships account for 19% share of the total fleet while, in India 7% of the ships fall in the small ships category. 16

17
India Vs world - Summary
In terms of trade amt, cost, fleet size, age, tonnage, trade mix etc – where do we fit our strengths or disadvantages viz a viz the world 17

18
Ships Crude Oil Carriers: capable of transporting
vast quantities of liquids Class Tonnage (dwt) Description Panamax 60,000 – 80,000 Capable of fitting through Panama canal Aframax 80,000 – 120,000 based on the Average Freight Rate Assessment (AFRA) tanker rate system. Suezmax 130,000 – 160,000 Capable of fitting through the Suezcanal VLCC 240,000 – 320,000 Very large crude oil carrier ULCC 350,000 – 500,000 Ultra large crude oil carrier
 Description. Panamax. 60,000 – 80,000. Capable of fitting through Panama canal. Aframax. 80,000 – 120,000. based on the Average Freight Rate Assessment (AFRA) tanker rate system. Suezmax. 130,000 – 160,000. Capable of fitting through the Suezcanal. VLCC. 240,000 – 320,000. Very large crude oil carrier. ULCC. 350,000 – 500,000. Ultra large crude oil carrier.")
19
Capable of fitting through the Suezcanal
Ships Dry Bulk Carriers: Used to transporting bulk Cargo items such as ore, grains Class Tonnage (dwt) Description Handysize 10,000 – 40,000 Handymax 40,000 – 60,000 Panamax 60,000 – 100,000 Capable of fitting through the Suezcanal Capesize 100,000 + Too large to traverse through the Suez or Panama canal. These go round the Cape of Good hope
 Description. Handysize. 10,000 – 40,000. Handymax. 40,000 – 60,000. Panamax. 60,000 – 100,000. Capable of fitting through the Suezcanal. Capesize. 100,000 + Too large to traverse through the Suez or Panama canal. These go round the Cape of Good hope.")
20
Regulatory Environment
100% FDI allowed in Shipping Automatic approval for FDI upto 74% in shipping 100% investment by NRI’s with full repatriation benefits No permission required for raising Forex loans from abroad by mortgaging vessels with the lender. Tonnage Taxation regime implemented in 2005 replacing the Corporate Taxation regime 100% FDI: As 100 per cent FDI is allowed in shipping, foreign lines can set up wholly owned companies in India to bring their ships into the Indian registry.Moreover Shipping Companies have been allowed to retain sale proceeds of their ships abroad and utilise them for fresh acquisition 100 percent investment by NRI's in shipping with full repatriation benefits No permission is required for raising foreign exchange loans from abroad by mortgaging the vessels with the lender The tonnage tax regime was introduced to help Indian owners compete globally on a level-playing field since more than 90 per cent of the global shipping tonnage operate under this system of taxation where the tax levels are a meager 1-2 per cent compared to the steep rates prevailing under the corporate tax structure. Imposition of tonnage tax (a taxation system which is widely used in other countries) helps attract not only foreign direct investment (FDI), but also new players into this sector, as in other countries. This would again increase tonnage and have a positive impact on the economy.
 helps attract not only foreign direct investment (FDI), but also new players into this sector, as in other countries. This would again increase tonnage and have a positive impact on the economy.")
21
Regulatory Environment
Disadvantages for the “Indian Flagged” ships High Crewing Cost & Shortage of Officers Employees on Indian flagged ships bound to pay Income Tax - disincentive vis a vis Other countries Plethora of Other Taxes: Capital Gains Tax, Service Tax, etc The Indian taxation regime for, both the companies and ship personnel, imposes additional costs making employment on Indian ships unattractive. Indian officers and crew employed on Indian flagged vessels (for a period of less than 183 days) are subject to income tax. No such taxation requirement is imposed on foreign flags making employment on these flags more attractive. This means that Indian shipping companies are not able to retain quality manpower in India. These disadvantages deprive the Indian shipping industry of a level playing field in the global market. Taxation Regime:Though the tonnage tax has benefited them immensely in terms of lower tax outgo, the owners now feel that flying the Indian flag is still not attractive and competitive since they are saddled with other taxes including withholding tax on interest on external commercial borrowings (ECBs) and on charter hire paid to foreign shipowners, capital gains tax, service tax, fringe benefit tax, sea farers tax and dividend distribution tax, among others.
 are subject to income tax. No such taxation requirement is imposed on foreign flags making employment on these flags more attractive. This means that Indian shipping companies are not able to retain quality manpower in India. These disadvantages deprive the Indian shipping industry of a level playing field in the global market. Taxation Regime:Though the tonnage tax has benefited them immensely in terms of lower tax outgo, the owners now feel that flying the Indian flag is still not attractive and competitive since they are saddled with other taxes including withholding tax on interest on external commercial borrowings (ECBs) and on charter hire paid to foreign shipowners, capital gains tax, service tax, fringe benefit tax, sea farers tax and dividend distribution tax, among others.")
22
Great Eastern Shipping Corp
GE Shipping : Company Profile

23
Brief Snapshot of GES Incorporated on August 3rd, 1948
More than 5 decades in shipping 41 vessels, all owned , transporting bulk commodities 9 new building vessels on order Rated “AAA” ( Domestic currency debt) since 1996 Demerged the offshore division on 16th October 2006 with the objective to unlock shareholder value High liquidity and adequate floating stock – 27% with promoters and 43% with the public
 since Demerged the offshore division on 16th October 2006 with the objective to unlock shareholder value. High liquidity and adequate floating stock – 27% with promoters and 43% with the public.")
24
Business Profile The Great Eastern Shipping Company Ltd.
Shipping business Offshore business Wholly owned subsidiary Greatship (India) Ltd. Tanker Valuations: Shipping is a highly volatile business and freight rates are determined depending on global supply and demand. Therefore, valuing a shipping company on the basis of price to earnings may not be meaningful. However, considering the asset intensive nature of the shipping business, price to book value (P/BV) would be an appropriate method of valuation. Though the book value does not indicate the market value of the fleet, book value capture the essence of the balance-sheet strength of the company. It has to be remembered that when freight rates are higher, the asset value of the fleet increases and vice versa. If the company declares the net asset value (NAV), investors could use that as a very good indicator. Otherwise, we suggest investors to value a shipping business on the basis of P/BV. For offshore companies, price to earnings would be an appropriate tool as the revenue visibility is higher and also less volatile. Dry Bulk Offshore oil field support and Logistic services It is India’s largest Private shipping company with a global customer base and strong financials
 Ltd. Tanker. Valuations: Shipping is a highly volatile business and freight rates are determined depending on global supply and demand. Therefore, valuing a shipping company on the basis of price to earnings may not be meaningful. However, considering the asset intensive nature of the shipping business, price to book value (P/BV) would be an appropriate method of valuation. Though the book value does not indicate the market value of the fleet, book value capture the essence of the balance-sheet strength of the company. It has to be remembered that when freight rates are higher, the asset value of the fleet increases and vice versa. If the company declares the net asset value (NAV), investors could use that as a very good indicator. Otherwise, we suggest investors to value a shipping business on the basis of P/BV. For offshore companies, price to earnings would be an appropriate tool as the revenue visibility is higher and also less volatile. Dry Bulk. Offshore oil field support and. Logistic services. It is India’s largest Private shipping company with a. global customer base and strong financials.")
25
Fleet – Asset profile Fleet (41) LPG Carriers (2)
2.96 mn dwt 13.1 yrs LPG Carriers (2) Product Carriers (16) Crude Oil Carriers (14) Dry Bulk Carriers (9) 1.86 mn dwt 10.61 years 0.68 mn dwt 17.40 years 0.05 mn dwt 24 years 0.38 mn dwt 16.1 years Tonnage Avg.Age VLCC (1) Suezmax (5) Aframax (8) Panamax (2) Medium range (8) General purpose (6) Panamax (1) Handymax (5) Handysize (3)
 Product Carriers (16) Crude Oil Carriers (14) Dry Bulk Carriers (9) 1.86 mn dwt years 0.68 mn dwt years 0.05 mn dwt. 24 years 0.38 mn dwt years Tonnage. Avg.Age. VLCC (1) Suezmax (5) Aframax (8) Panamax (2) Medium range (8) General purpose (6) Panamax (1) Handymax (5) Handysize (3)")
26
Time Charter Yields Time Charter Yields (TCY) ($/day) 2006 - 2007
2005 – 2006 Q1 Q2 Tanker - Crude 26,582 32,015 26,922 19,847 - Product 19,908 20,834 19,437 20,293 LPG Carrier 16,386 16,505 Dry Bulk 15,487 15,231 22,590 15,545 26

27
Employees Before Demerger After the Demerger 80 odd employees were
Onshore staff Floating Staff No. of Employees 174 529 After the Demerger 80 odd employees were shifted to the Offshore business

28
Employee Cost 2006 ( USD) 2005 (INR) (USD) Wages & Salaries 99151
105485 Social Security Cost 10470 463193 11212 503643 Other Pension Cost 39183 53173 Total 148804 169870

29
Other Salient Features
Broad based research Continuous evaluation of fleet through judicial sale/purchase activities Benchmarking with global standards De-risking Through diverse asset base Long term employment

30
Clients – GE shipping British Petroleum Exxon Mobil Shell ONGC
Reliance Hindustan Petroleum Corporation Ltd. Bharat Petroleum Corporation Ltd. Indian Oil Corporation Transammonia Glencore Fortum Hyundai Heavy Industries Co. Ltd. Saudi Aramco

31
Industry Drivers for Shipping Industry

32
Drivers for the Shipping Industry
Demand drivers I. Trade growth World GDP growth: Shipping is a global industry and its prospects are closely tied to the level of economic activity in the world. A higher level of economic growth would generally lead to higher demand for industrial raw materials (like oil, iron ore and coal). Oil demand/Supply: The tanker market cannot exist without the demand for oil and in particular how much of the demand is met through domestic production and stocks. Besides demand, oil supply (which mainly comes from OPEC) is also of significance. The quantum of oil produced by OPEC has a direct impact on the tanker market. For instance, if OPEC cut downs its production in February 2007 (to keep oil prices at desired levels), shipping industry might be left with surplus capacity considering that the tanker fleet is already growing at a rate faster than growth in demand for tonnage. Oil inventory levels: The amount of oil held in storage which can be drawn upon to meet future requirements also impacts the demand for oil tankers. Generally, consumers hold stocks and levels are drawn down in winter and replenished in spring. Steel production: Iron ore and coal together represent about 42% of the total global dry bulk trade. Since iron ore and coking coal are key inputs in the production of steel, steel production plays a significant role in determining the demand for dry bulk carriers. II. Trade patterns Refinery locations: Before it can be used for final consumption, crude oil needs to be refined into products like petrol, diesel and kerosene. Since refineries are generally located away from the places of production, crude tankers are used to transport crude oil from producing countries to refineries. Tanker transportation is generally more viable for inter-regional trades while pipelines are preferred for intra-regional trades. To distribute the refined petroleum products to places of consumption, product tankers and pipelines are used. Varying levels of capacity and the sophistication of refineries' processing capabilities also play a role in oil markets. Many refineries are located in consuming regions, facilitating response to weather-induced demand spikes and seasonal shifts. Sourcing areas: The distance between the place of origin and the place of destination is an important demand driver since a shift from a shorter haul movement to a longer haul one (for the same amount of cargo) is likely to result in increased tonne-mile demand for vessels. Regional grain production: Grain, along with iron ore and coal represents a significant portion of the total dry bulk trade. In case of a drought in a particular region, arrangements are made to import food-grains from countries with surplus production. This, in turn, influences the demand for dry bulk vessels. Supply drivers I. Ordering Shipbuilding capacity: The number of vessels that a shipyard can build and the time taken to build a vessel plays an important role in determining the growth in tonnage supply. Since new capacities take time to set up, shipyards are unable to cope up with any sudden increase in demand. This impacts the delivery of ships and thereby acts as a supply constraint. Considering the huge order backlog of global shipyards, especially those in the Asian regions of Korea and Japan, ship owners are currently being quoted deliveries that will be beyond 2011. New building prices: In case of high new building prices, shipping companies are likely to slow (or defer) their new purchases as the break even becomes higher. Similarly, lower new building prices can lead to increased orders (assuming that companies are expecting demand to pick up in the future), thereby increasing the total tonnage available in the market. II. Scrapping Economic Life: Higher the age of the fleet, higher is the expected scrapping and lower the net fleet growth. Economic life differs across vessel category (crude tankers have a relatively lesser economic life than dry bulk vessels). At present, the average age of the global shipping fleet is 19 years. Regulations: Statutory regulations on age and safety norms set by International Maritime Organisation and the European Union may place restrictions on particular kinds of vessels, thus affecting fleet augmentation. For instance, the International Maritime Organistaion (IMO) has stipulated that all single hull ships be scrapped by 2010. Over and above these fundamental demand and supply parameters, freight rates can witness spikes due to short-term events. These could be natural catastrophes, accidents or political upheaval in the form of strike/war, or even as basic as port/canal congestion. 32
. Oil demand/Supply: The tanker market cannot exist without the demand for oil and in particular how much of the demand is met through domestic production and stocks. Besides demand, oil supply (which mainly comes from OPEC) is also of significance. The quantum of oil produced by OPEC has a direct impact on the tanker market. For instance, if OPEC cut downs its production in February 2007 (to keep oil prices at desired levels), shipping industry might be left with surplus capacity considering that the tanker fleet is already growing at a rate faster than growth in demand for tonnage. Oil inventory levels: The amount of oil held in storage which can be drawn upon to meet future requirements also impacts the demand for oil tankers. Generally, consumers hold stocks and levels are drawn down in winter and replenished in spring. Steel production: Iron ore and coal together represent about 42% of the total global dry bulk trade. Since iron ore and coking coal are key inputs in the production of steel, steel production plays a significant role in determining the demand for dry bulk carriers. II. Trade patterns Refinery locations: Before it can be used for final consumption, crude oil needs to be refined into products like petrol, diesel and kerosene. Since refineries are generally located away from the places of production, crude tankers are used to transport crude oil from producing countries to refineries. Tanker transportation is generally more viable for inter-regional trades while pipelines are preferred for intra-regional trades. To distribute the refined petroleum products to places of consumption, product tankers and pipelines are used. Varying levels of capacity and the sophistication of refineries processing capabilities also play a role in oil markets. Many refineries are located in consuming regions, facilitating response to weather-induced demand spikes and seasonal shifts. Sourcing areas: The distance between the place of origin and the place of destination is an important demand driver since a shift from a shorter haul movement to a longer haul one (for the same amount of cargo) is likely to result in increased tonne-mile demand for vessels. Regional grain production: Grain, along with iron ore and coal represents a significant portion of the total dry bulk trade. In case of a drought in a particular region, arrangements are made to import food-grains from countries with surplus production. This, in turn, influences the demand for dry bulk vessels. Supply drivers. I. Ordering Shipbuilding capacity: The number of vessels that a shipyard can build and the time taken to build a vessel plays an important role in determining the growth in tonnage supply. Since new capacities take time to set up, shipyards are unable to cope up with any sudden increase in demand. This impacts the delivery of ships and thereby acts as a supply constraint. Considering the huge order backlog of global shipyards, especially those in the Asian regions of Korea and Japan, ship owners are currently being quoted deliveries that will be beyond New building prices: In case of high new building prices, shipping companies are likely to slow (or defer) their new purchases as the break even becomes higher. Similarly, lower new building prices can lead to increased orders (assuming that companies are expecting demand to pick up in the future), thereby increasing the total tonnage available in the market. II. Scrapping Economic Life: Higher the age of the fleet, higher is the expected scrapping and lower the net fleet growth. Economic life differs across vessel category (crude tankers have a relatively lesser economic life than dry bulk vessels). At present, the average age of the global shipping fleet is 19 years. Regulations: Statutory regulations on age and safety norms set by International Maritime Organisation and the European Union may place restrictions on particular kinds of vessels, thus affecting fleet augmentation. For instance, the International Maritime Organistaion (IMO) has stipulated that all single hull ships be scrapped by Over and above these fundamental demand and supply parameters, freight rates can witness spikes due to short-term events. These could be natural catastrophes, accidents or political upheaval in the form of strike/war, or even as basic as port/canal congestion. 32.")
33
Key Parameters in Shipping Industry
Management Control: Decisions on fleet mix, mix of time charter and spot rates Fleet Mix: Decisions on the segment to cater to (tankers, dry bulk, gas , container ) or the less volatile offshore business Valuations: P/E ratios does not properly reflect the valuation of the highly volatile shipping business. Hence P/BV is a better indicator of this asset intensive business Shipping stocks: Key considerations Management: The ability of the management to foresee trends and alter the fleet mix accordingly to improve realisations is of high significance considering the volatile nature of the shipping industry. Since freight rates are highly volatile, it would be prudent for shipping companies to maintain sufficient revenue coverage through time charters. The company thus insulates its earnings from the highly cyclical nature of freight rates, thereby increasing its revenue visibility. Even though this comes at a cost of losing out on substantial upsides in case of attractive spot freight rates, the company can alter its mix of time charters and spot rates depending upon their outlook on freight rates. Fleet mix: As mentioned earlier, shipping companies operates in different segments viz., tankers (crude and product), dry bulk, gas, containers and offshore. The segment in which a particular company operates, and the freight outlook in that segment, will ultimately determine the future prospects of the company. As compared to the dry bulk and crude segment, the offshore business provides higher visibility and lower volatility. Oil rigs provide long term visibility to the company’s revenues and with the rise in exploration and production (E&P) activities, the demand for offshore support vessels is likely to remain strong. Valuations: Shipping is a highly volatile business and freight rates are determined depending on global supply and demand. Therefore, valuing a shipping company on the basis of price to earnings may not be meaningful. However, considering the asset intensive nature of the shipping business, price to book value (P/BV) would be an appropriate method of valuation. Though the book value does not indicate the market value of the fleet, book value capture the essence of the balance-sheet strength of the company. It has to be remembered that when freight rates are higher, the asset value of the fleet increases and vice versa. If the company declares the net asset value (NAV), investors could use that as a very good indicator. Otherwise, we suggest investors to value a shipping business on the basis of P/BV. For offshore companies, price to earnings would be an appropriate tool as the revenue visibility is higher and also less volatile. 33
 or the less volatile offshore business. Valuations: P/E ratios does not properly reflect the valuation of the highly volatile shipping business. Hence P/BV is a better indicator of this asset intensive business. Shipping stocks: Key considerations. Management: The ability of the management to foresee trends and alter the fleet mix accordingly to improve realisations is of high significance considering the volatile nature of the shipping industry. Since freight rates are highly volatile, it would be prudent for shipping companies to maintain sufficient revenue coverage through time charters. The company thus insulates its earnings from the highly cyclical nature of freight rates, thereby increasing its revenue visibility. Even though this comes at a cost of losing out on substantial upsides in case of attractive spot freight rates, the company can alter its mix of time charters and spot rates depending upon their outlook on freight rates. Fleet mix: As mentioned earlier, shipping companies operates in different segments viz., tankers (crude and product), dry bulk, gas, containers and offshore. The segment in which a particular company operates, and the freight outlook in that segment, will ultimately determine the future prospects of the company. As compared to the dry bulk and crude segment, the offshore business provides higher visibility and lower volatility. Oil rigs provide long term visibility to the company’s revenues and with the rise in exploration and production (E&P) activities, the demand for offshore support vessels is likely to remain strong. Valuations: Shipping is a highly volatile business and freight rates are determined depending on global supply and demand. Therefore, valuing a shipping company on the basis of price to earnings may not be meaningful. However, considering the asset intensive nature of the shipping business, price to book value (P/BV) would be an appropriate method of valuation. Though the book value does not indicate the market value of the fleet, book value capture the essence of the balance-sheet strength of the company. It has to be remembered that when freight rates are higher, the asset value of the fleet increases and vice versa. If the company declares the net asset value (NAV), investors could use that as a very good indicator. Otherwise, we suggest investors to value a shipping business on the basis of P/BV. For offshore companies, price to earnings would be an appropriate tool as the revenue visibility is higher and also less volatile. 33.")
34
Key Issues in Global Shipping
Safe ships: Homeland Security regulations Fewer ships: Fleet portfolio/shipper consolidation Fewer ports: Global hubbing/port consolidation Better ports: Greater efficiency, better landside distribution Enough ships: Capacity supply Shipping companies face a myriad of challenges. From complying with a bevy of new rules mandating new security requirements, to rising fuel prices and inadequate infrastructure, to fears that a slowdown in global trade will reduce demand for services, industry executives are wrestling with numerous vexing issues. The following is a summation of the issues of prime importance presently: 1. Safe ships: Homeland Security regulations : The spectre of global terrorism has led to a rush of new security requirements with which shippers must now comply. Some of the requirements are mandated by government statutes; others are mandated by common sense. New Regulations: Cargo Security Risk Assessment Container Security Initiative (CSI)/Enhancing In-Transit Container Security Technological Improvements The World Customs Organisation to co-ordinate IT investment across customs agencies in different countries Technology and “Smart” Containers 2. Fewer ships: Fleet portfolio/shipper consolidation: The global shipping industry may be entering a new period of consolidation, as it did in the late 1990s. In particular, the recent acquisition of P&O Nedlloyd by Maersk, as well as Hapag-Lloyd’s parent TUI’s bid for CP Ships may presage a run of similar deals. In addition to the Maersk acquisition and TUI’s bid for CP ships, the long-running boom and limited shipyard capacity have also increased the pressure for acquisitions. 34
/Enhancing In-Transit Container Security. Technological Improvements. The World Customs Organisation to co-ordinate IT investment across customs agencies in different countries. Technology and Smart Containers. 2. Fewer ships: Fleet portfolio/shipper consolidation: The global shipping industry may be entering a new period of consolidation, as it did in the late 1990s. In particular, the recent acquisition of P&O Nedlloyd by. Maersk, as well as Hapag-Lloyd’s parent TUI’s bid for CP Ships may presage a run of similar deals. In addition to the Maersk acquisition and TUI’s bid for CP ships, the long-running boom and limited shipyard capacity have also increased the pressure for acquisitions. 34.")
35
Financials of GE Shipping
Financial Highlights Financials of GE Shipping

36
Financial Highlights

37
The Last Five Years… * Residual Company

38
Cash Flow Statement

39
Balance Sheet

40
GE Shipping De-merger
Demerger of GE Shipping

41
Demerger Details The offshore division was made into a separate company called Great Offshore on October 16, 2006 Done with the purpose of unlocking shareholder value The demerger had to be revised due to reservations form ONGC about promoter backing of the new entity. Mr. Vijay K Sheth was then transferred to Great Offshore and ceased to be an MD of GES Every 5 equity shares held prior to Book Closure got 4 equity shares of GE shipping and 1 equity share of Great Offshore. The company’s subsidiary Greatship (India) Ltd. At present has 1 Support Vessel. But the company has a huge Vessel Delivery Schedule. The Cash Flows arising out of these have been factored into our valuation. However the renewed focus on Offshore business after the demerger with Great Offshore indicates that the demerger was due to control and family reasons rather than “unlocking shareholder value”. Disputes on the Non Compete agreements could be a cause of concern. However, refocus on Offshore business through Greatship( India) Ltd. Seems To suggest that the demerger was due to family reasons and not “unlocking Shareholder value”
 Ltd. At present has 1 Support Vessel. But the company has a huge Vessel Delivery Schedule. The Cash Flows arising out of these have been factored into our valuation. However the renewed focus on Offshore business after the demerger with Great Offshore indicates that the demerger was due to control and family reasons rather than unlocking shareholder value . Disputes on the Non Compete agreements could be a cause of concern. However, refocus on Offshore business through Greatship( India) Ltd. Seems. To suggest that the demerger was due to family reasons and not unlocking. Shareholder value")
42
Snapshot of Demerged Entities
Size of the demerged Great Offshore Company is 15% of the revenues of GE Shipping GE Shipping with its focus on Offshore Activities through subsidiary Great Ship India Ltd. Is poised to benefit from the increase in E&P activities. Investing into GE Shipping at its current low valuations is an attractive proposition. Market gives a better premium to Offshore companies owing to their strong earnings potential

43
GE Shipping De-merger
Valuation of GE Shipping

44
Valuation Concerns PE is not a useful metric to Value Shipping Companies Shipping is a highly volatile business and freight rates are determined depending on global supply and demand. Price to book value (P/BV) would be an appropriate Asset intensive nature of the shipping business. Captures the Balance Sheet strength of the business. Net Asset Value Method is most appropriate Book value does not indicate the market value of the fleet. NAV method captures the market value of the fleet. For Cyclical businesses like Shipping, Market and Assets (NAV) Based Multiples are more relevant. In valuing GE Shipping more emphasis has been given to this concern. Price to Earnings would be apt for Offshore companies Revenue visibility is higher and also less volatile.
 would be an appropriate. Asset intensive nature of the shipping business. Captures the Balance Sheet strength of the business. Net Asset Value Method is most appropriate. Book value does not indicate the market value of the fleet. NAV method captures the market value of the fleet. For Cyclical businesses like Shipping, Market and Assets (NAV) Based Multiples are more relevant. In valuing GE Shipping more emphasis has been given to this concern. Price to Earnings would be apt for Offshore companies. Revenue visibility is higher and also less volatile.")
45
Revenue Forecast Assumptions.
Apart from looking at the market factors, the Sales projections have been made considering the Vessel Delivery Schedules of GE Shipping and its Subsidiary. The company’s subsidiary Greatship (India) Ltd. At present has 1 Support Vessel. But the company has a huge Vessel Delivery Schedule. The Cash Flows arising out of these have been factored into our valuation. However the renewed focus on Offshore business after the demerger with Great Offshore indicates that the demerger was due to control and family reasons rather than “unlocking shareholder value”. Disputes on the Non Compete agreements could be a cause of concern.
 Ltd. At present has 1 Support Vessel. But the company has a huge Vessel Delivery Schedule. The Cash Flows arising out of these have been factored into our valuation. However the renewed focus on Offshore business after the demerger with Great Offshore indicates that the demerger was due to control and family reasons rather than unlocking shareholder value . Disputes on the Non Compete agreements could be a cause of concern.")
46
Valuation Forecasts Capex requirements of the company for the Next Three Years are taken as GE Shipping – Approx Rs Crores Great Ship (India) Ltd – Approx Rs Crores. The company also has not been leveraged to a large extent and intends to expand when asset prices reduce over time. Based on the Global trends and Demand –Supply factors outlined earlier, we estimate a downward trend in Average Yields. The Drop in yields is as high as 15% for VLCC carriers. * Based on Industry reports and interactions Average Yields:
 Ltd – Approx Rs Crores. The company also has not been leveraged to a large extent and intends to expand when asset prices reduce over time. Based on the Global trends and Demand –Supply factors outlined earlier, we estimate a downward trend in Average Yields. The Drop in yields is as high as 15% for VLCC carriers. * Based on Industry reports and interactions. Average Yields:")
47
DCF Valuation DCF Valuation Terminal Growth (%) Beta Equity Debt Equity WACC (%) Enterprise Value Rs Crores Equity Value Rs Crores No of Shares Cr. Shares Value Per Share Rs. 244 Growth for the Next three years is assumed at 5.5%. Terminal Growth is assumed to be 4%.
 Enterprise Value Rs Crores. Equity Value Rs Crores. No of Shares Cr. Shares. Value Per Share Rs Growth for the Next three years is assumed at 5.5%. Terminal Growth is assumed to be 4%.")
48
GE Shipping De-merger
Relative Valuation

49
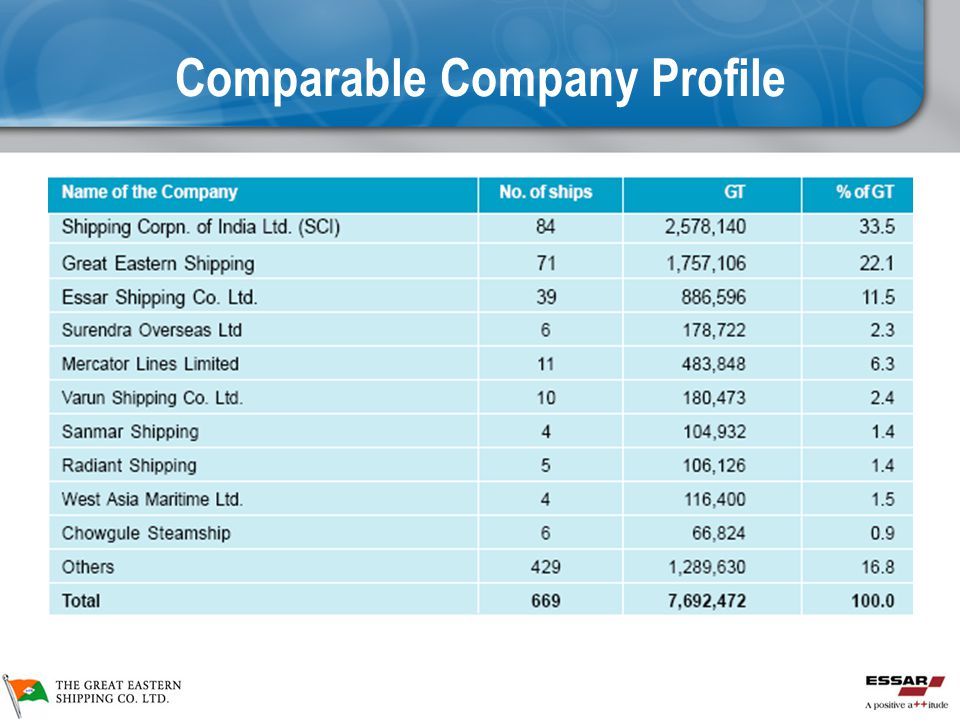
Comparable Company Profile
49 49
50
Competition Analysis

51
Comparable Multiples Company EV/EBIDTA P/BV Essar Shipping 8.41 0.67
GE shipping 4.37 1.33 Mercator lines 6.27 1.27 SCI 2.71 1.02 Varun Shipping 5.61 1.35 Industry Average 4.44 1.11 Price per share (Rs) 228 233
")
52
Net Asset Value Depressed market prices and Rising asset prices have resulted in attractive Price/NAV prices. Buying into this sector looks attractive for an existing player

53
Market Vs. Book & NAV The market price of GE Shipping has improved drastically viz a viz its Book Value and Net Asset Value. The Stock still trades at approx. 0.5 to 0.65 times its Net Asset Value.

54
Valuation Assessment DCF – Rs.244 Relative range – Rs. 228 to 233
NAV per share – Rs.400 Current Market price – Rs.230

55
GE Shipping De-merger
Investment Case for GE Shipping

56
Strengths of GE shipping
Largest private sector shipping industry Management has decades of experience Approvals from most of the Global oil majors Follows a blend of long term contracts and spot exposure to reduce volatility Expansion plans in place to benefit from increasing commodity trade Strengthening presence in the offshore business as well

57
Strengths of GE shipping
Rated as Asia’s third best company under a billion in Forbes list, 2006 Business Today rated it amongst the top 5 investor friendly companies. Low leverage of 0.67 Strong client base Conservative accounting practices maintained Unforeseen liability unlikely – write-backs possible

58
Concern Areas for GE shipping
60% of GE shipping fleet is single hull Exposed to inherent volatility in the shipping industry Cyclical industry Freight rates are highly volatile Offshore business yet to take off

59
GE Shipping De-merger
Essar Shipping

60
Essar Shipping – A Snapshot
One of the world’s leading integrated sea logistics company Experts in transportation solutions for the global energy business Accounts for 14% of Indian fleet Owns country’s largest, double hull VLCC One of world’s largest owner/operator od Suezmax tankers Strong management team and consistent financial performance

61
Essar – A snapshot Experts in transportation solutions for the global energy business Owns India’s first and largest double hull double bottom VLCC Internationally recognized player, with a majority of vessels on international charters End-to-end sea logistics company 61

62
Essar – A snapshot Internationally recognized player, with a majority of vessels on international charters Has customers from rig to refinery and beyond Handles 5 mn metric tonnes of coastal dry bulk cargo Amongst the low cost operators globally with exemplary safety records

63
Essar Fleet Total Fleet (30) Containers (7) Product Tankers (7)
Tugs (4) Offshore units Dry bulk carriers (16) VLCC (1) Bulk carriers (7) Mini-bulk carriers(7) Suezmax(6) Fleet valued at USD 415 mn (Rs. 1.9 bn) Fleet is modern, sophisticated, fuel efficient. Fleet is among the youngest in India with average age of 14 yrs compared to world average of 19 yrs
 Offshore units. Dry bulk. carriers (16) VLCC (1) Bulk carriers (7) Mini-bulk carriers(7) Suezmax(6) Fleet valued at USD 415 mn (Rs. 1.9 bn) Fleet is modern, sophisticated, fuel efficient. Fleet is among the youngest in India with average age of 14 yrs compared to world average of 19 yrs.")
64
Strategic perspective - Essar
Leader in Offshore business Leader in logistics Presence in other segments as well GE shipping largest private player with focus on dry and wet bulk segment increasing focus on Offshore through Greatship (India) Importance of acquisition Essar strengthens presence in the highly leveraged and rewarding Offshore segment Essar gets an opportunity to diversify into other shipping segments with a significant scale and client base
 Importance of acquisition. Essar strengthens presence in the highly leveraged and rewarding. Offshore segment. Essar gets an opportunity to diversify into other shipping segments. with a significant scale and client base.")
65
Essar – looking for opportunities
Essar is already restructuring its business it is hiving off Essar Logistics & Vadinar Oil Terminal ( wholly owned subsidiaries) It has pumped fresh equity worth 1500 cr to be used to repayment of liabilities expansion plans in power, steel and shipping GE shipping is certified by ISO – hence no compromise on quality and safety standards
 It has pumped fresh equity worth 1500 cr to be used to. repayment of liabilities. expansion plans in power, steel and shipping. GE shipping is certified by ISO – hence no compromise on quality and safety standards.")
66
In a Nut shell Essar is looking for investment opportunities
GE Shipping has low book value and high NAV Offshore business has very high margins and is set to grow in India GE has growing presence in Offshore business Delivery of huge number of offshore vessels by 2009 Current valuation of GE Shipping does not reflect the growth potential of its Offshore division

67
Advantages for Essar Market share to increase from current 7% to 30%
Substantial client addition esp. in the dry bulk segment Ownership of additional 41 fleets (excluding those yet to be delivered) which compliment the existing fleet composition It was the first Indian company to get the ISO certificate from the Lloyds Register of Shipping in It is also one of the first companies to be awarded the ISM Document of Compliance in 1995, three years ahead of the ISM requirement. ESL is now working towards obtaining the ISO 9002:2004 and the International Ship & Port Security (ISPS) code in addition to getting the AMVER award. The shipping business has been awarded the ISO 9001: 2000 standard certification by DNV.
 which compliment the existing fleet composition. It was the first Indian company to get the ISO certificate from the Lloyds Register of Shipping in It is also one of the first companies to be awarded the ISM Document of Compliance in 1995, three years ahead of the ISM requirement. ESL is now working towards obtaining the ISO 9002:2004 and the International Ship & Port Security (ISPS) code in addition to getting the AMVER award. The shipping business has been awarded the ISO 9001: 2000 standard certification by DNV.")
68
Questions

Similar presentations


>")


