Download presentation
Presentation is loading. Please wait.

1
Application of Geospatial technology in MGNREGS

2
Objectives Use of GIS and RS for planning and monitoring of MGNREGS works for generation of social capital and employment. Mapping the area and understanding the demographic profile, economic status of the stakeholders Usage of the model as a platform for capacity building of the local community, Village/Taluka Panchayat and Project Implementing Agencies (PIA) . Capturing the existing assets, current coverage of the area and generation of future action plan. Use of various tools including RS Imagery for monitoring & evaluation.
 . Capturing the existing assets, current coverage of the area and generation of future action plan. Use of various tools including RS Imagery for monitoring & evaluation.")
3
Scope Monitoring and Evaluation Development of Action Plan
Mapping of the Project Area Development of Action Plan Monitoring and Evaluation Incorporation of asset inventory & socio-economic details

4
Convergence of Geospatial Technologies
GPS RS GIS ICT e-Gram Total Turnkey Solutions Courtesy: NRSA/ISRO

5
Tools to be used Geographic Information System (GIS)
Global Positioning System (GPS) instruments Remote Sensing (RS) Imagery Management Information System (MIS) [NREGASoft] Participatory Rural Appraisal(PRA) & Focus Group Discussions (FGD) Social Audit
 instruments. Remote Sensing (RS) Imagery. Management Information System (MIS) [NREGASoft] Participatory Rural Appraisal(PRA) & Focus Group Discussions (FGD) Social Audit.")
6
Availability of GIS Spatial Layers
Features Source LAND Land use Satellite Data Landform (hill, Alluvial, Coastal areas etc ) Soil type Soil and Land Use Survey of India, National Bureau of Soil Survey & Land Use Planning, Agri. Deptt. Slope/Elevation Satellite Data & Open Source WATER Surface Water Bodies Ground Water condition GWRDC, CGWB Wells Revenue Deptt. Check Dam Departmental Data Vegetation Agriculture Agriculture Deptt, Satellite Data Forest Forest Deptt, Satellite Data
 Soil type. Soil and Land Use Survey of India, National Bureau of Soil Survey & Land Use Planning, Agri. Deptt. Slope/Elevation. Satellite Data & Open Source. WATER. Surface Water Bodies. Ground Water condition. GWRDC, CGWB. Wells. Revenue Deptt. Check Dam. Departmental Data. Vegetation. Agriculture. Agriculture Deptt, Satellite Data. Forest. Forest Deptt, Satellite Data.")
7
Availability of GIS Spatial Layers
Features Source Village Socio-Economic Facilities, SC & ST data , Actual Wages, Drinking Waters, % of SF &MF, % Poverty Index Deptt. of Rural Development., Bureau of Economic & Statistics Village Map Computerized maps from Revenue Deptt. Infrastructure Roads, Canals, Water Supply Line Departments Ownership Details Forests, Government, Panchayat, Private Others Sanctuaries, Mining areas, CRZs, SEZs Datasets Integrated in GIS Different Types of Maps can be generated

8
Various GIS Spatial Layers
Soil Slope BPL details Various GIS Spatial Layers Asset details Cadastral Map Drainage SC/ST population

9
Why Plan at Micro watershed level
80% of the MGNREGS works are based on Natural Resource Management (NRM), Drought proofing, Flood control & protection works, Land development, Micro & macro irrigation works, Renovation of traditional water bodies (Desilting) Absence of holistic & integrated approach leads to inadequate returns on investment Effective planning at Micro-watershed Level ( Ha.) would result in the creation of sustainable assets and concrete measurable outcomes at village level.
, Drought proofing, Flood control & protection works, Land development, Micro & macro irrigation works, Renovation of traditional water bodies (Desilting) Absence of holistic & integrated approach leads to inadequate returns on investment. Effective planning at Micro-watershed Level ( Ha.) would result in the creation of sustainable assets and concrete measurable outcomes at village level.")
10
GIS for Planning From Macro to Micro
Vadodara Taluka Plot boundaries on Satellite image Survey nos. transferred on the plots Fajalpur Village, Vadodara Taluka, Vadodara District Selected District Selected Taluka Selected Village Vadodara District

11
GIS Framework Monitoring and Impact Assessment using Web based GIS
GIS Spatial Layers Demographic Data Socio-Economic profile of Stakeholder MGNREGA-MIS Physical Infrastructure & Assets PRA exercise Annual Action Plan

12
GIS based planning & monitoring for MGNREGS
A CASE STUDY

13
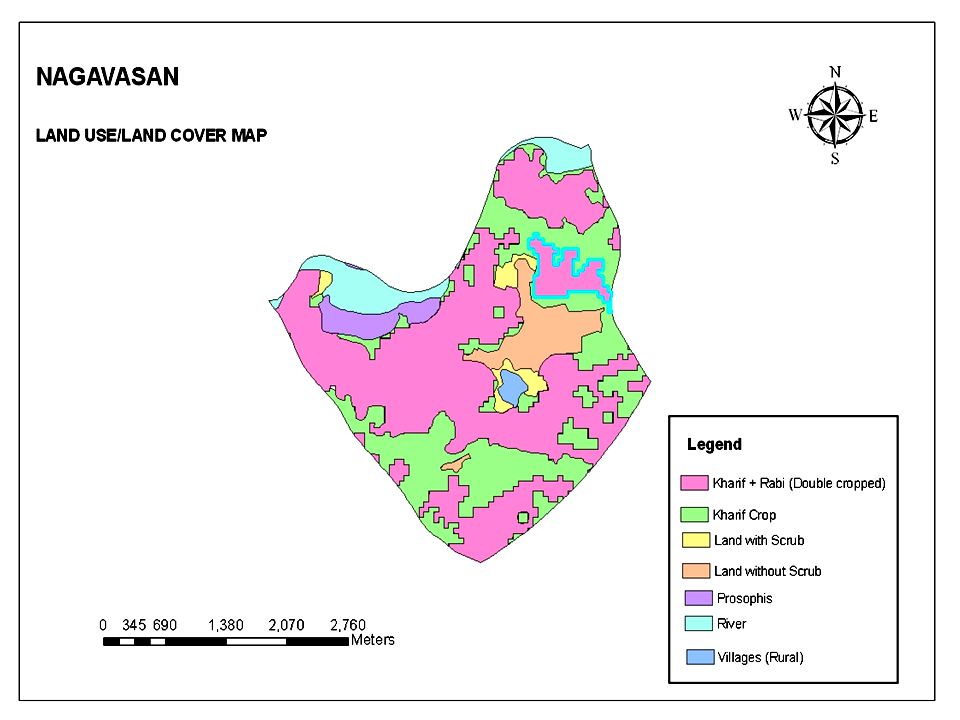
Study Area Patan Dist. Sidhpur Taluka Nagavasan Village (5H3B7d1b )
3/31/2017 Study Area Patan Dist. Sidhpur Taluka Nagavasan Village (5H3B7d1b ) Sidhpur Taluka Patan Dist. Gujarat State 230 57’26.17” N and ’1.76” E to 230 55’1.45” N and ’37.08” E. Ictard.daiict.ac.in
 Sidhpur Taluka. Patan Dist. Gujarat State ’26.17 N and ’1.76 E. to ’1.45 N and ’37.08 E. Ictard.daiict.ac.in.")
14
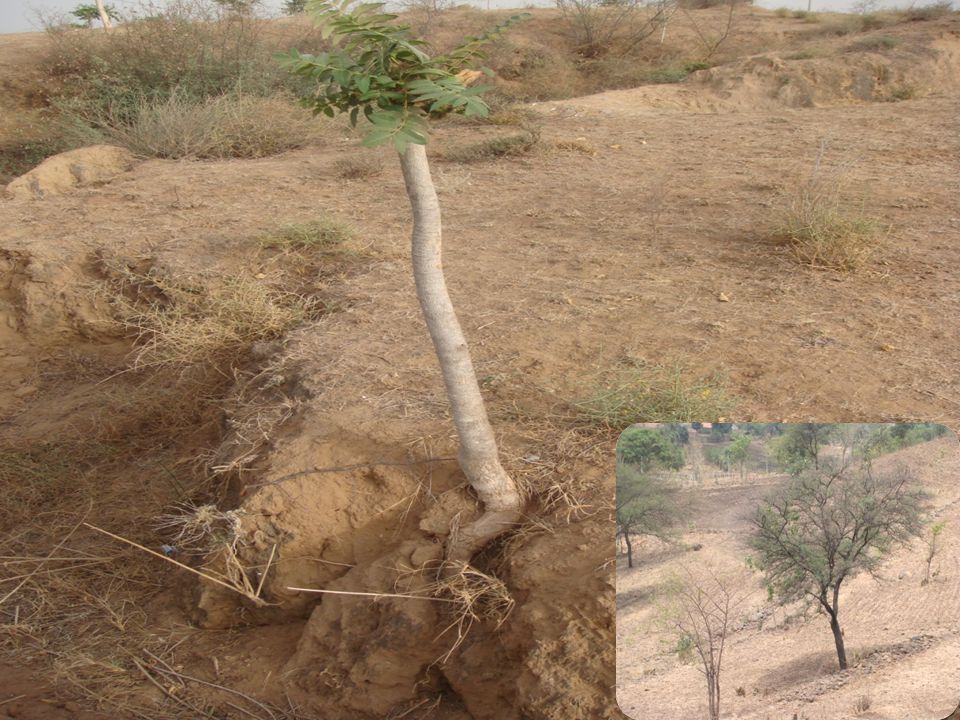
About Study area Low rainfall area (700 mm)
Prone to excessive soil erosion due to ravines and sparse vegetative cover leads to inadequate recharge of ground water and siltation of water harvesting structures. Low agriculture & milk productivity Biotic pressure on Gauchar and community land because of non-production of fodder on private land

16
Advantages of Mapping Mapping facilitates better understanding of activities both by the literate and illiterate (major beneficiaries). Mapping helps deriving a platform for coordination between MGNREGS and other line department for convergence. The maps (in digital form) can be easily shared between the line departments & other stakeholders which results in better fund flow and aids in monitoring and evaluation.
 can be easily shared between the line departments & other stakeholders which results in better fund flow and aids in monitoring and evaluation.")
17
Land Parcel Map with Survey Numbers

20
Action Plan Parameters
3/31/2017 Action Plan Parameters Socio-economic parameters BPL population SC/ST population Small/Marginal farmers Landless Bio-Physical parameters Ground water status Vegetative cover status Geomorphology of the area Soil erodability status Cropping pattern etc Ictard.daiict.ac.in

21
Action Plan Parameters (Contd.)
Asset inventory Existing water harvesting structures Community land Gauchar land Land holdings by SC/ST Land holdings by Marginal Farmers Road connectivity Gram Panchayat office Irrigation structures (wells, field channels etc.) Previous works under NREGS & other schemes
 Previous works under NREGS & other schemes.")
22
Measuring Soil Erodibility
3/31/2017 Measuring Soil Erodibility A sustainable model which decreases soil erosion, silting and degradation of present water harvesting structures Use of Soil erosion equation for identifying various parameter Universal Soil Loss Equation (USLE) Soil Loss = RKLSCP Soil erosion was estimated using Universal soil Loss Equation (USLE) (Wischemier, W.H and Smith, D.D, 1978). Ictard.daiict.ac.in
 Soil Loss = RKLSCP. Soil erosion was estimated using Universal soil Loss Equation (USLE) (Wischemier, W.H and Smith, D.D, 1978). Ictard.daiict.ac.in.")
23
Measuring Soil Erodibility
‘K’ is the erodibility factor - depends on soil characteristics (percent of sand, silt, organic matter content. K- Factor map for soil is prepared accordingly. ‘LS’ is calculated from slope map - mainly dependent on percent slope and slope-length for each category of slope ‘C’ factor is dependent on crop and the local vegetation. This is mapped from the land use and land cover map ‘P’ factor is dependent on conservation practices applied or ought to be applied in watershed under NREGA.

24
Baseline Survey Details
3/31/2017 Baseline Survey Details Parameters Mapping Village Profile Asset Inventory Ictard.daiict.ac.in

25
PRA Exercise Contour Trench Construction of Road
Desilting of Farm Pond Check dams Earthen Dams Construction of Well(ST Land)
")
26
Man-Day Calculation* S.No Detail of NREGA work Specification Unit
Net Cost (in Rs.) Man Days 1 Staggered Contour Trenches, 1.24 m3 8827 4918 2 Plantation pits 0.045m3 17654 357 3 Desilting of Check- Dam 220m3 4 39560 395 Repairing of Bori-Bund 28 28000 280 Total 5955 (Approx) * as per the NREGA Schedule of Rates (SOR) – Rs per m3
 Man Days. 1. Staggered Contour Trenches, 1.24 m Plantation pits m Desilting of Check- Dam. 220m Repairing of Bori-Bund Total (Approx) * as per the NREGA Schedule of Rates (SOR) – Rs per m3.")
27
ST Land Community Land (CPR) Gamtal
MGNREGS ANNUAL ACTION PLAN STAGGERED CONTOUR TRENCH Man-day required = 4918 Expense (Rs.)= ST Land Community Land (CPR) Construction of Well Pits excavation for plantation Man-day Required = 357 Expense(Rs.) = Repairing and formation of new Bori-bund Man-day Required =280 Expense(Rs.) = 28000 Gamtal Desilting the check dams Man-day Required = 400 Expense(Rs.) = 40000 Construction of Seva Kendra
= ST Land. Community Land (CPR) Construction of Well. Pits excavation for plantation. Man-day Required = 357. Expense(Rs.) = Repairing and formation of new Bori-bund. Man-day Required =280. Expense(Rs.) = Gamtal. Desilting the check dams. Man-day Required = 400. Expense(Rs.) = Construction of Seva Kendra.")
28
Annual Planning Cycle Maintenance of Assets Grass seeding - May-June
Jan-Dec Capacity building, Nursery /Vermi-culture unit Oct-Dec Staggered Contour trench/ Desilting check dams Jan- May Const. of wells /roads/ Seva Kendra Oct- May Grass seeding - May-June Plantation June-July

29
Monitoring & Impact Assessment System
Creation of Web based GIS monitoring system at village level using e-Gram facilities with following database. Type of assets Use of GPS coordinates for asset created Land parcel survey numbers. The volume of work Cost incurred. Availability of Labour.

30
Monitoring & Impact Assessment System (Contd.)
Use of Mobile based software for updating the Geo- spatial database. Integrating with MGNREGA-MIS system. Summarised and specialized spatial reports for different hierarchies Annual satellite images (CARTOSAT Imagery) to assess the outcome. Monitoring System output will become input data for next annual action plan.
 to assess the outcome. Monitoring System output will become input data for next annual action plan.")
31
Monitoring and evaluation Model
Web based GIS Monitoring And Evaluation System MGNREGA MIS Remote Sensing Satellite Imagery Mobile Based Data updation GPS Coordinate of Assets Spatial Report

32
Professional Team(5 Members) Technical Assistant ,NREGS
Functional Structure State GIS Unit Professional Team(5 Members) District GIS Unit One Technical Expert Taluka GIS Unit Technical Assistant ,NREGS
 District GIS Unit. One Technical Expert. Taluka GIS Unit. Technical Assistant ,NREGS.")
33
Technical Resources Computer and Printer(At District and Taluka level)
GIS Software GPS Instrument Scanner Digital Camera

34
Financial Implications
State Level GIS Unit – Rs. 5 crore (Initial) and Rs. 1 Crore Recurring Cost Per annum. District Level GIS Unit – Rs. 25 Lakh (Intial) and Rs. 5 Lakh Recurring Cost Per annum Taluka Level GIS Unit - Rs. 5 Lakh and Rs. 1 Lakh Recurring Cost Per annum
 and Rs. 1 Crore Recurring Cost Per annum. District Level GIS Unit – Rs. 25 Lakh (Intial) and Rs. 5 Lakh Recurring Cost Per annum. Taluka Level GIS Unit - Rs. 5 Lakh and Rs. 1 Lakh Recurring Cost Per annum.")
35
Capacity Building at village level
Capacity building of Village & Taluka level panchayat employees regarding the use of various GIS map and GPS instruments. Technical assistance to field engineers/Talati-cum- Mantri for better data collection. Exposure visit of different stakeholders to best managed projects

36
Conclusion Geographic Information system (GIS) has a vital role as a Decision Support System. Decentralization of MGNREGS activities and creation & management of asset inventory requires a proper scientific tool. The scope of GIS as an Information System acts as a solution for reliable, real-time and authentic information.

37
Thank You

38
Monitoring Mapping NAGAVASAN
3/31/2017 Monitoring Mapping NAGAVASAN BACK Ictard.daiict.ac.in

Similar presentations


 G.P. Singh Technical Director National Informatics Centre, Govt. of India Kendriya Bhawan.>")
 HYDERABAD. Web–enabled school mapping helps to Identify habitations without access to schooling facilities. Conduct proximity.>")


>")


>")

 in Jharkhand by B. NIJALINGAPPA Additional Secretary Department of Rural Development, Jharkhand, Ranchi Date- 2-3 August.>")


