Download presentation
Presentation is loading. Please wait.

1
Total Revenue Management and Billing solution for Power Utilities.
A presentation From NSOFT(India) Services Pvt. Ltd. Bangalore
 Services Pvt. Ltd. Bangalore.")
2
About NSOFT(India) An ISO 9001-2000 Software solution Company
In operation since 1996. In the Total Revenue Management Services since 1998. In the Power sector since 1999. Working on CMMi level 4 certification.

3
Experience Utility Revenue Management
Expertise in handling Water Supply Utilities. Expertise in Handling Power Utility Companies. Expertise in handling the Financial Accounting and works management for Utility Companies.

4
Experience Contd... Implemented across 100 sub divisions in Karnataka. Total coverage across 5 utility companies covering 53 lakh consumers. Implemented in Gujarat in two utilities and carrying out Live billing across 2.9 lakh consumers in 23 sub divisions. Implementation in Progress in Allahabad for 1.75 lakh consumers.

5
Total Revenue Management
Complete Digitisation of the consumer and Utility Data. Building this data on a Geographical Information System platform. Decentralised – On the spot billing through Hand held devices. Bill Collection – On the spot or through different mechanisms of collection.

6
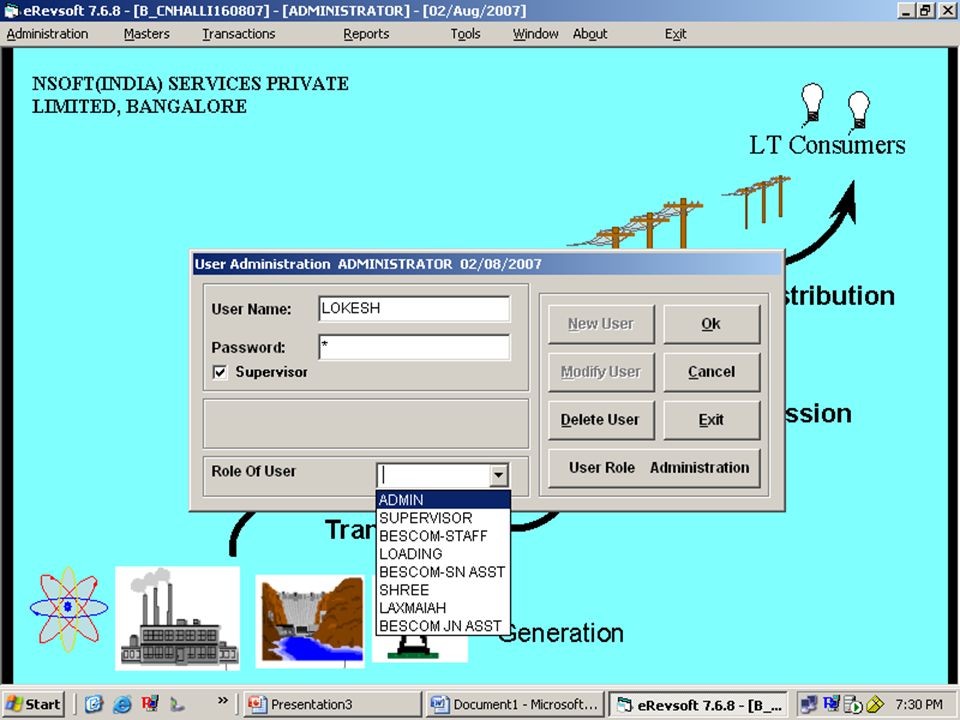
Security Features Built in workflow with security features built in to prevent any manipulation of data. Data flows through n-tiered workflow layers with users given role based permissions to create/access / approve transactions. All access to backend database completely cut-off and modifications allowed through transactions which are logged to facilitate audit trail tracking.

7
Integration of data on a Web Server through dedicated communication channels.
Preparation of MIS Reports and also reports to monitor the day to day work. Integration of Revenue Management with enterprise level Project accounting system.

8
Capability of the software
Architecture of Software The software is available in both the Client Server and Web enabled platforms. The software addresses the complete needs of the Revenue Management for the utility companies. The scope covers Maintaining the Consumer ledgers Billing data preparation on a daily basis. Revenue Collection monitoring.

9
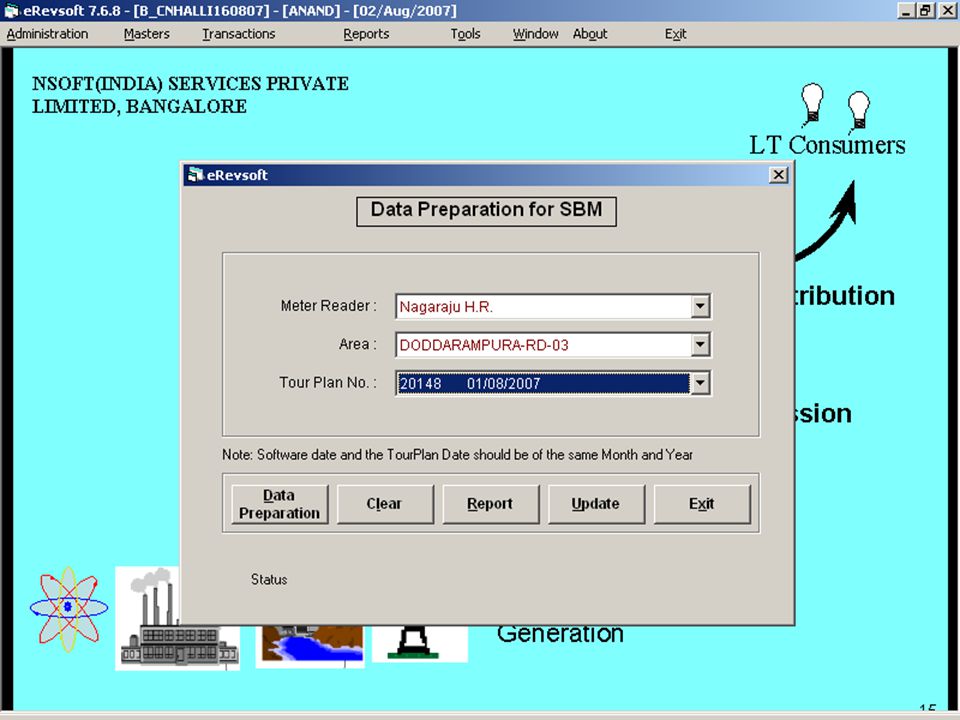
Data Downloading to Spot Billing Machine Bill Data Uploading From SBM
Architecture Diagram Dial up /Leased Lines connectivity Cash Counter Cash Counter Section Office/ SDO / DO Data Downloading to Spot Billing Machine Data Receive Data Sending Cash Counter Meter Reader Bill Data Uploading From SBM Spot Billing Machine (SBM) Generating the Bills Generating the Receipts Taking the Complaints & Issuing the Acknowledgment Customer’s Site
 Generating the Bills. Generating the Receipts. Taking the Complaints & Issuing the Acknowledgment. Customer’s Site.")
10
Data Downloading to Spot Billing Machine Bill Data Uploading From SBM
Wide Area Connectivity (Leased Lines / Internet etc- Data Aggregation SDO/DO/CO/HO SDO / Section Office 1 SDO 2 / Section Office 2 SDO 3 / Section Office 3 Data Receive Data Sending Data Downloading to Spot Billing Machine CashCntr Spot Billing Machine (SBM) Bill Data Uploading From SBM Meter Reader Generating the Bills Generating the Receipts Taking the Complaints & Issuing the Acknowledgment Customer’s Site
 Bill Data Uploading From SBM. Meter Reader. Generating the Bills. Generating the Receipts. Taking the Complaints & Issuing the Acknowledgment. Customer’s Site.")
11
Enterprise-wide Data Integration
NSOFT HO/ Central Data warehouse MIS system Enterprise Integration (Uploads all transactional data) Office-Datalink (Extracts data / Integrates Master Data ) Office-Datalink (Extracts /Integrates Master data) Section Office a) LT Billing b) Collection c) MIS Reports d) Fin.Accounts e) Customer Mgt. SDO/DO/ERO/CO a) HT Billing b) Collection c) MIS Reports d) Fin. Accounts e) Customer Mgt. MIS Data for Billing Collection Meters etc.
 Office-Datalink. (Extracts data / Integrates Master Data ) Office-Datalink. (Extracts /Integrates Master data) Section Office. a) LT Billing. b) Collection. c) MIS Reports. d) Fin.Accounts. e) Customer Mgt. SDO/DO/ERO/CO. a) HT Billing. b) Collection. c) MIS Reports. d) Fin. Accounts. e) Customer Mgt. MIS Data for. Billing. Collection. Meters etc.")
43
Capability of the software
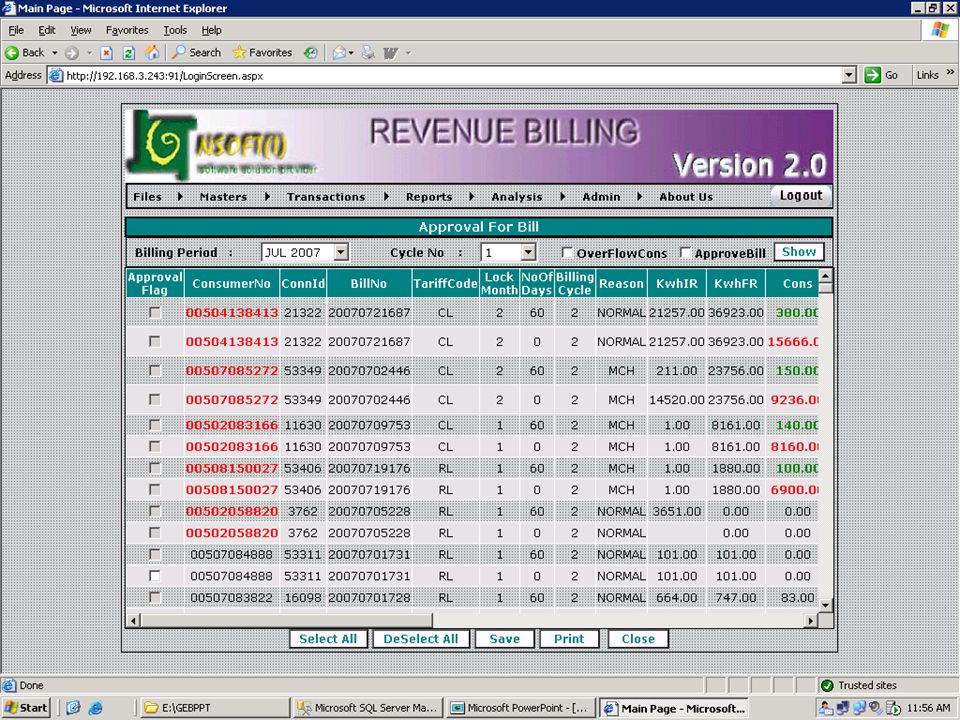
Integration of collection with the Demand on a daily basis. Integration of data from multiple locations to a central database. Facility to produce the Daily Demand Collection and Balance Report for the consumer / Meter Reader / Sub Division / Division / Corporate Office. Generation of reports relating to Revenue Management and Presentation of the Reports on the Web for authorised consumers / Utility Staff. Energy Auditing Transformer Center wise.

44
Physical Architecture For Billing- Proposed.
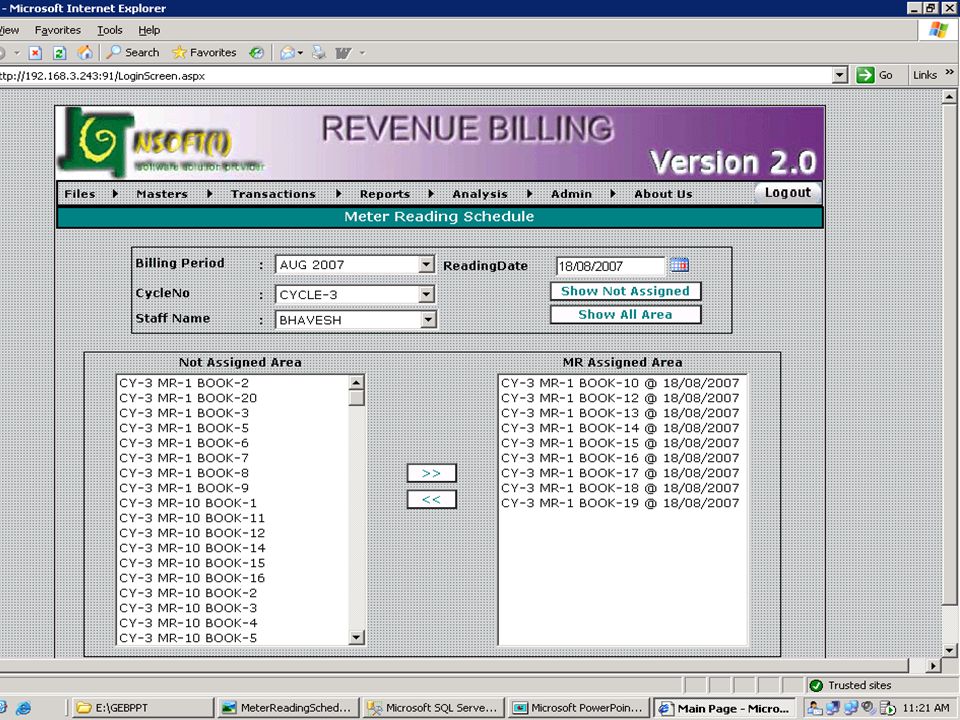
The consumer master should reside at the local billing center. The collections should be updated to the billing center on a daily basis. The consumers data is kept current and helps in Complaint Management. The billed consumers tour plan is made. The Meter Reader will walk across the consumers houses and generate the bills through Spot Billing Machines

45
Validation of consumers
Bar-coding of the Meters with a combination of Meter Serial Numbers / Consumer Numbers. Labels [ Polyester ] are fixed to the meters by our staff. Bar-code Reader equipped SBM’s. The input is restricted to the I R entry. Reduced Inputs Accurate consumer identification. This facilitates Meter management Info reconciliation with the Consumer Numbers.

46
Bar-Code Printing on the Bill
The bill generated through the SBM’s can have a bar-code printed for use in Cash Counters. The Vertical bar-code will have 20 characters on Code 128 C standard. 11 Characters – Consumer number 8 Characters – Amount [ Max of 9.99 lakhs]

47
The data is downloaded at the sub division office in to the server.
In Web enabled platform the data is updated to a central server. The MIS reports are generated at the sub division. Energy auditing facilitated.

48
Energy Auditing Consumers are mapped to Transformer Centers.
Transformers are linked to Feeders. Consumption of the Transformer Centers are monitored through Metering. The billing cycles are re-organised to ensure that the Transformer Centers are read on the same day as the consumers linked to Transformers.

49
The consumption of the Transformers are compared to the Consumers and the difference in consumption is the loss of Energy which has to be traced. This includes both the Technical as well as Commercial Losses. The spot billing machines are equipped to generate the Loss Percentages soon after the day’s meter reading is completed.

50
Interface to Other Systems
Interface to Geographical Information System. Interface to Enterprise wide Project and Works accounting system. Payroll maintenance

51
Geographical Information System
Maps created through High resolution satellite imagery like Ikonos / Cartosat / Quick bird. Accuracy of the data could be 0.60 to 1 meters. Database created on 1 : 5000 scale. Network created by physical tracking with a tracking device.

52
Asset Identification Assets like the Feeders / Transformers are created on such network. The Poles are marked and linked to Transformers. Each of the consumer is linked to the Pole and this is carried out through the Meter Reading Devices.

53
Information Extracted
Identification of the Loads on the network. Identification of Transformer loading. Identification billed energy on any Transformer. Identification of the Arrears / Demand on any area / Transformer / Feeder. Identification of the Geographical features on the network Identification of the Voltage Regulation at various points of the network. Pictorial view gives a clear picture for a decision making.

54
Project and Works accounting
Creation of the projects database. Creation of the Estimates. Creation of the Indents Creation of the purchase orders for stores. Receipt of supplies from suppliers. Issue of materials against Indents. Work Completion certificate generation Asset Creation from the projects completed.

55
Generation of Financial accounts from transparent flow of transactions from various points of transactions. All reports for a Commercial Accounting system generated. Data Integrated from different sources to a centralised location. MIS reports are made available on a Unit office level to a Corporation Level.

56
Payroll - Features Employee Master maintenance
Configurable Salary components master Advances, deductions and recovery of advances maintenance Pay bill generation Salary slips generation Linkage to accounts software

57
Revenue Management Implementation History and results.
Implemented In Bangalore Electricity Supply company since Jan 2003. Over a period of 6 months increase in Demand was 47% , from 14 crores to 24 Crores. Increase in Collection by over 30%. Billing efficiency improved to near 100%. Complaints from customers dropped to 0%.

58
Current implementation Base
Bangalore Electricity Supply Company – 36 sub divisions – 18 Lakh consumers. Hubli Electricity Supply Company – 37 sub divisions – 15 Lakh Consumers Mangalore Electricity Supply Company – 32 sub division – 9 lakh consumers Gulbarga Electricity Supply Company – 14 sub divisions – 6 lakh consumers. C E S C , Mysore - 6 lakh consumers

59
Implemented In Dakshin Gujarat Electricity Supply Company – For 1
Implemented In Dakshin Gujarat Electricity Supply Company – For 1.5 lakh consumers. Implemented In Madhiya Gujarat Electricity Supply Company – For 1.4 lakh consumers. Implementation in progress in Allahabad – 1.75 lakh consumers.

60
What is the responsibility of the solution provider
Solution provider will implement The hardware [ Computers + Spot Billing Machines ] required for the implementation. The software will be totally customised to the requirements of the Electricity Board. Manpower to implement the software will be deployed. Stationery required for the implementation will be provided. The electricity Board will provide Space / Furniture [ minimal] and Power required for the implementation. It will also provide high speed Internet connectivity for information exchange. An implementation monitoring team.

61
Advantages of the solution Proposed
The solution provider carries extensive experience in implementing such solutions in Utility undertakings. The solution proved over the last 5 years in Karnataka and over 18 months in Gujarat. Very easy adaptation to the new requirements due to a flexible software design.

62
Extensive MIS Reports. The tangible benefits are Increase in the Demand Improvement in the Collection Reduction of staff requirement to monitor the software implementation [ Average of 5 persons to handle a consumer base of 50000]. Realisation [ after implementation] per consumer per month – approximately – 100 Rs per consumer.

63
Intangible Benefits Improved Consumer satisfaction Reduced consumer visits to the utility Office. More checks on the departmental staff due to the transparency built in the software. Immediate availability of data to senior officers to enable taking appropriate decisions.

64
Cost – Benefit Analysis
An Average Cost to Benefit ratio will of the order of 20

65
Our Strengths We understand the customer’s requirements and customise to their requirements. Ready In-House developed software implemented on the State of the Art Technology. Expertise in handling and supporting implementations in Urban and Rural Areas. Support center at Bangalore supporting nearly 130 discrete sites for implementation. All over Internet. Implementation Turnaround cycle minimum.

66
Thank You

Similar presentations


 Group D Fong Hui Yun Kyung Jung Yijia Li Roxana Hernandez UC-Berkeley Strategic Computing and Communications Technology.>")


