Download presentation
Presentation is loading. Please wait.

1
MENA Water Outlook 2050 Future Water Availability
Peter Droogers, Walter Immerzeel, Wilco Terink The Netherlands

2
Climate Change

4
Current Problems

6
Shiklomanov, I.A World Water Resources at the Beginning of the 21st Century. Cambridge University Press

7
Food Water Requirements

8
Existing Water-Climate Change studies limitations:
Not only climate change, but global changes increased population increased GDP increased consumption: domestic, industry Conceptual limitations focus on economics, not on water resources focus on annual numbers focus on limited sectors Impact and not adaptation

9
concepts

10
Study Design Objectives Steps Limitations
Detailed water supply and demand analysis Identification of potential options to overcome water shortage Steps Climate and other change projections Hydrological impact model Water resources supply/demand analysis Cost and benefits adaptation options Limitations Large scale so simplifications, generalizations

11
Study design

12
Monthly approach 20 mm shortage? Month Renewable (mm)
Irrigation requirement (mm) Water stress (mm) January 30 10 February 20 March April May 40 June July August September October November December TOTAL 240 260 120 20 mm shortage?
 Water stress (mm) January February. 20. March. April. May. 40. June. July. August. September. October. November. December. TOTAL mm shortage")
13
Downscaling of climate change scenarios

14
Projected climate change in the MENA
IPCC (Intergovernmental Panel on Climate Change) uses four scenario families (A1, A2, B1 and B2) Each scenario family explores alternative development pathways This study uses the A1B scenario because: It is widely used and recommended by the IPCC It is the most likely scenario: Assumes a world of rapid economic growth Global population that peaks in mid-century Rapid introduction of new and more efficient technologies
 uses four scenario families (A1, A2, B1 and B2) Each scenario family explores alternative development pathways. This study uses the A1B scenario because: It is widely used and recommended by the IPCC. It is the most likely scenario: Assumes a world of rapid economic growth. Global population that peaks in mid-century. Rapid introduction of new and more efficient technologies.")
15
Projected climate change in the MENA
All of MENA is likely to warm during the 21st century Warming is very likely to be larger than the global, annual mean warming throughout the continent and in all seasons, with drier subtropical regions warming more than the moister tropics Annual rainfall is likely to decrease in much of Mediterranean Africa and northern Sahara There is likely to be an increase in annual rainfall in East Africa Temperature and precipitation changes over Africa. Differences between and , averaged over 21 GCMs

16
Selection of General Climate Models
GCM performance in North-East Africa: GCM Model r (-) MSE (mm /day) Included BCCR CM2.0 0.81 1.12 1 CCCMA CGCM 3.1 T47 0.79 CNRM CM3 1.23 CSIRO Mk3.0 0.75 0.97 GFDL CM2.0 0.82 1.00 IPSL CM4 0.78 0.84 MPI ECHAM5 0.88 0.59 HadCM3 0.76 0.90 HadGEM1 CCCMA CGCM 3.2 T63 1.22 GFDL CM2.1 0.68 1.03 GISS AOM 1.60 GISS EH 0.65 1.19 GISS ER 0.71 1.18 IAP FGOALS 1.0g 0.60 INM CM3.0 0.58 1.07 MIROC 3.2 (hires) 0.83 1.59 MIROC 3.2 (medres) 1.17 MIUB ECHO-G 0.61 1.56 MRI CGCM 2.3.2a 1.78 NCAR CCSM 3 0.54 1.79 NCAR PCM1 0.55 2.11 9 GCMs were selected, because of the large variation in climate projections between the GCMs The table shows the mean of monthly correlation and mean squared difference of 20th century GCM experiments with the CRU TS 2.1 analysis The first nine GCMs are included in the current study
 MSE (mm /day) Included. BCCR CM CCCMA CGCM 3.1 T CNRM CM CSIRO Mk GFDL CM IPSL CM MPI ECHAM HadCM HadGEM1. CCCMA CGCM 3.2 T GFDL CM GISS AOM GISS EH GISS ER IAP FGOALS 1.0g INM CM MIROC 3.2 (hires) MIROC 3.2 (medres) MIUB ECHO-G MRI CGCM 2.3.2a NCAR CCSM NCAR PCM GCMs were selected, because of the large variation in climate projections between the GCMs. The table shows the mean of monthly correlation and mean squared difference of 20th century GCM experiments with the CRU TS 2.1 analysis. The first nine GCMs are included in the current study.")
17
Why downscaling? GCMs generate forcing data (precipitation, temperature) at a coarse spatial resolution (>100 km) Hydrological processes occur on a higher spatial resolution The statistics of the coarse GCM forcing data do not match the statistics of the observed forcing data

20
Downscaling approach Temperature Reference evapotranspiration
Precipitation Reference period is (NCEP/NCAR and TRMM) Monthly GCM data from Monthly absolute anomalies with respect to (ΔTy,m) Select random year For each day in : Future ETref using Hargreaves assuming no change in diurnal temperature range (Tmax-Tmin)
 Monthly GCM data from Monthly absolute anomalies with respect to (ΔTy,m) Select random year For each day in : Future ETref using Hargreaves assuming no change in diurnal temperature range (Tmax-Tmin)")
21
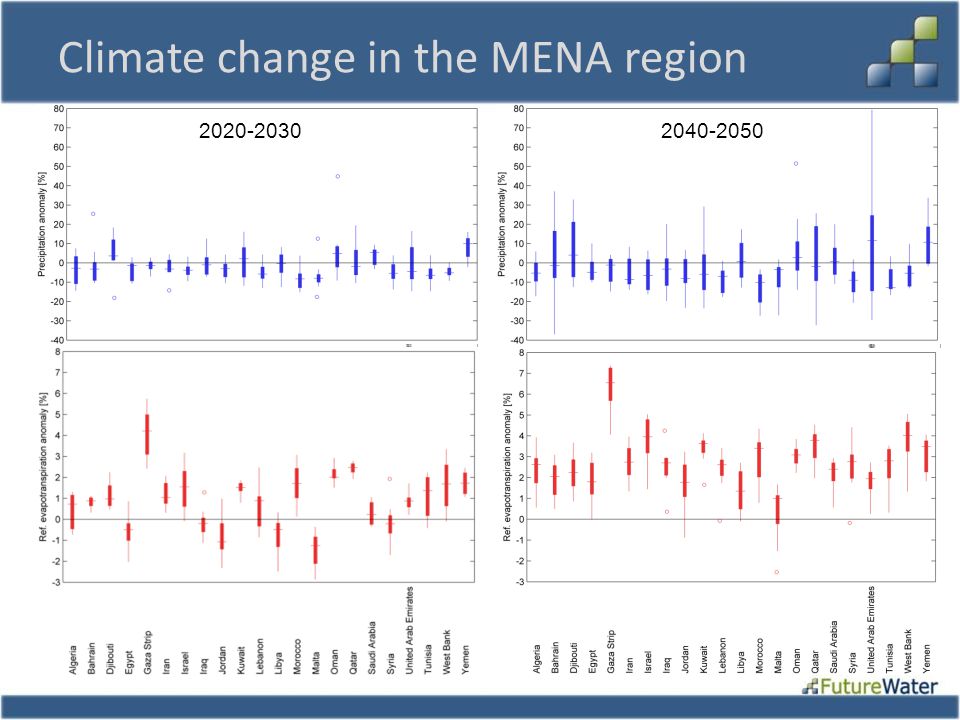
Climate change in the MENA region
22
Climate change in the MENA region

23
Climate change in the MENA region

24
Changes in Population, Domestic and industrial water demand

25
Changes Irrigation water demand changes
FAO: Agriculutre Towards 2050 Industrial water demand changes AquaStat: f(GDP, GDP/cap) Domestic water demand changes Population growth Environmental Assessment Agency
 Domestic water demand changes. Population growth. Environmental Assessment Agency.")
27
Hydrological model

28
The MENA hydrological model
PCRaster - Water Balance Distributed water balance model Daily time step 10 km x 10 km resolution Model domain includes MENA including upstream basins (5210 km x 8770 km)
")
29
The MENA hydrological model
Model resolution: Regular grid of 10 km Daily time step Each cell describes: The vertical flow of water through four compartments Canopy Three soil compartments Soil and canopy are fed by rainfall and depleted by evapotranspiration The transfer of runoff to the drainage network Sub-grid processes at 1 km: Short and tall vegetation Fraction of soil type Topography Open water

30
Key process: vegetation and evaporation
Etr Interception: Es Ei Imax I Etr Ei Transpiration and soil evaporation: F(s) s 1 Evapotranspiration:
 s. 1. Evapotranspiration:")
31
Model domain

32
Validation of model results

33
Location of GRDC discharge stations
Validation of model results using stream flow

34
Validation results

35
Water availability

36
Aridity (current)
")
37
Total and irrigated evapotranspiration

38
Internal water resources and per capita water availability (current)
")
39
Future water availability

40
Total Renewable Water Resources
Total change from 2010 to 2050 in % in total renewable water resources

41
Main Findings Changes MENA (2010-2050):
Internal renewable water resources: 20% reduction (8% less rainfall) (12% more evapotranspiration) Total renewable water resources: 8% reduction Large variation between countries Large year-to-year variability Per capita water availability will drop even further below critical levels in the future
 (12% more evapotranspiration) Total renewable water resources: 8% reduction. Large variation between countries. Large year-to-year variability. Per capita water availability will drop even further below critical levels in the future.")
42
Thank You

Similar presentations


>")


 projections Olivier Crespo Thanks to M. Tadross Climate Systems Analysis Group University.>")


