Download presentation
Presentation is loading. Please wait.

1
The Geography of Census October 6, 2014

2
What is the Census? The U.S. Census Bureau conducts many surveys but the most widely known and used is the decennial census. The decennial census is mandated by the Constitution. First conducted in 1790 and conducted every 10 years since.

3
1790 Census Free White males of 16 years and upward (to assess the country's industrial and military potential) Free White males of 16 years and upward (to assess the country's industrial and military potential) Free White males under 16 years Free White males under 16 years Free White females Free White females All other free persons All other free persons Slaves Slaves
 Free White males of 16 years and upward (to assess the country s industrial and military potential) Free White males under 16 years Free White males under 16 years Free White females Free White females All other free persons All other free persons Slaves Slaves")
4
1790 Census Total population of the 13 states was 3,929,214. Top 3 Places RankCityPopulation 1New York, NY33,131 2Philadelphia, PA28,522 3Boston, MA18,320

5
1890 Census For the first time, enumerators were given detailed maps to follow so they could account for every street or road and not stray beyond their assigned boundaries.

6
1890 Census Total population of the 42 states was 62,979,766. Top 3 Places RankCityPopulation 1New York, NY1,515,301 2Chicago, IL1,099,850 3Philadelphia, PA1,046,964

7
1990 Census The Topologically Integrated Geographic Encoding and Referencing System (TIGER), developed by the U.S. Geological Survey and the Census Bureau, was introduced for the 1990 Census. It is a computerized representation of various map features such as streets, and rivers, and census geographic boundaries and their attributes such as latitude, longitude and address ranges.

8
1990 Census Total population of the 50 states was 248,709,873. Top 3 Places RankCityPopulation 1New York, NY7,322,564 2Los Angeles, CA3,485,398 3Chicago, IL2,783,726

9
2000 Census In previous censuses, responses to the race question were limited to a single category; in 2000, for the first time, respondents could check as many boxes as necessary to identify their race.

10
2000 Census Total population of the 50 states was 281,421,906. Top 3 Places RankCityPopulation 1New York, NY8,008,278 2Los Angeles, CA3,694,820 3Chicago, IL2,896,016

11
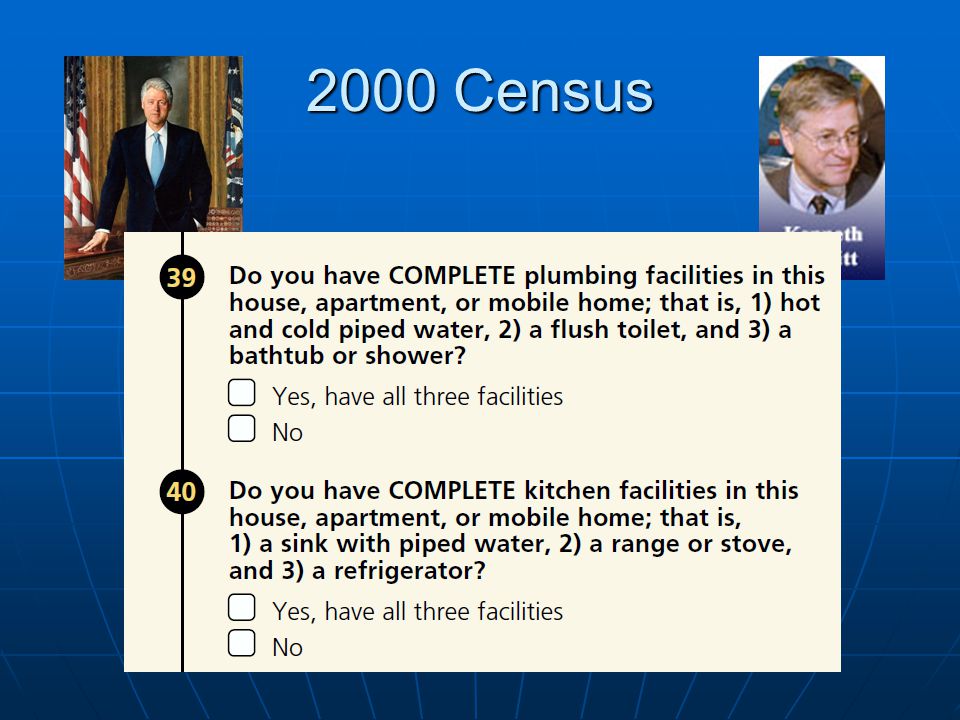
2000 Census Since the 1940 Census, the decennial census consisted of a “short-form” and a “long-form”. The short form questions are basics like age, gender, race, and Hispanic origin. These questions are asked of 100% of the population.

12
2000 Census The “long-form” on the other hand is sent to a sample of the population. These questions ask about detailed characteristics like income, occupation, disability, education level, and much more…

13
2000 Census

16
2010 Census The 2010 census questionnaire was one of the shortest in history - asking just 10 questions. The 2010 Census ONLY contains basic data on age, gender, race, and Hispanic origin along with a few housing items.

17
2010 Census Total population of the 50 states was 308,745,538. Top 3 Places RankCityPopulation 1New York, NY8,175,133 2Los Angeles, CA3,792,621 3Chicago, IL2,695,598

18
Why is there a Census?

19
Apportionment

20
Redistricting

21
What areas have data?

22
Primary Components of Census Geography Source: U.S. Census Bureau, TIGER/Line Files documentation

23
Levels of Census Geography Source: U.S. Census Bureau, TIGER/Line Files documentation

24
Sources for TIGER ® Data U.S. Census BureauU.S. Census Bureau http://www.census.gov/geo/www/tiger/ Data Access & Support Center (DASC)Data Access & Support Center (DASC) http://www.kansasgis.org/ ESRIESRI http://www.census.gov/geo/maps-data/data/tiger.htmlhttp://www.census.gov/geo/maps-data/data/tiger.html. http://www.census.gov/geo/maps-data/data/tiger.html
Data Access & Support Center (DASC) ESRIESRI")
25
TIGER ® Vintages 1990 TIGER Boundaries2000 TIGER Boundaries2010 TIGER Boundaries

26
American Community Survey

27
A large, continuous survey that: has an initial sample of about 3.5 million addresses per yearhas an initial sample of about 3.5 million addresses per year produces characteristics of population and housingproduces characteristics of population and housing produces estimates for small areas and small population groupsproduces estimates for small areas and small population groups

28
American Community Survey Content

29
ACS Content 4 types of characteristics: 4 types of characteristics: SocialSocial EconomicEconomic HousingHousing DemographicDemographic Characteristics, not population counts Characteristics, not population counts

30
American Community Survey Demographic Characteristics Sex Sex Age Age Race Race Hispanic Origin Hispanic Origin

31
American Community Survey Social Characteristics Education Education Marital Status Marital Status Fertility Fertility Grandparent Caregivers Grandparent Caregivers Veterans Veterans Disability Status Disability Status Place of Birth Place of Birth Citizenship Citizenship Year of Entry Year of Entry Language Spoken at Home Language Spoken at Home Ancestry / Tribal Affiliation Ancestry / Tribal Affiliation

32
American Community Survey Economic Characteristics Income Income Benefits Benefits Employment Status Employment Status Occupation Occupation Industry Industry Commuting to Work Commuting to Work Place of Work Place of Work

33
American Community Survey Housing Characteristics Tenure Tenure Occupancy & Structure Occupancy & Structure Housing Value Housing Value Taxes & Insurance Taxes & Insurance Utilities Utilities Mortgage/Monthly Rent Mortgage/Monthly Rent

34
American Community Survey 2008 Content Changes Three new questions Three new questions Health Insurance CoverageHealth Insurance Coverage Veteran’s Service-connected DisabilityVeteran’s Service-connected Disability Marital HistoryMarital History Deletion of one question Deletion of one question Time and main reason for staying at the addressTime and main reason for staying at the address Changes in some wording and format Changes in some wording and format

35
Types of ACS Estimates

37
Period Estimates Describe the average characteristics over a specific period of time Describe the average characteristics over a specific period of time Contrast with point-in-time estimates Contrast with point-in-time estimates Do not describe the characteristics on a specific dateDo not describe the characteristics on a specific date Period is 1 year, 3 years, or 5 years for ACS Period is 1 year, 3 years, or 5 years for ACS

38
How to Label Multiyear Estimates ACS estimates based on data collected from 2008-2012 should not be labeled “2008” or “2012” estimates ACS estimates based on data collected from 2008-2012 should not be labeled “2008” or “2012” estimates Multiyear estimates do not represent any one year or the midpoint of a period Multiyear estimates do not represent any one year or the midpoint of a period Correct labeling for multiyear estimate: “The child poverty rate for the 2008-2012 period was X percent.” Correct labeling for multiyear estimate: “The child poverty rate for the 2008-2012 period was X percent.”

39
Constructing Multiyear Estimates Data are pooled across 36 or 60 months Data are pooled across 36 or 60 months Data are weighted to produce estimates Data are weighted to produce estimates Estimates are controlled for age, sex, race, and Hispanic origin Estimates are controlled for age, sex, race, and Hispanic origin Multiyear estimates are not an average of 1-year estimates Multiyear estimates are not an average of 1-year estimates

40
When should I use multiyear estimates?

41
Use Multiyear Estimates When … No 1-year estimate is available No 1-year estimate is available Margins of error for 1-year estimates are larger than required Margins of error for 1-year estimates are larger than required Analyzing data for small population groups Analyzing data for small population groups

42
Currency vs. Reliability CurrencyReliability 1-year estimates provide information based on the last year Larger sample sizes produce estimates that are more statistically reliable 3-year estimates provide information based on the last year and the 2 years before that 3-year estimates are based on 3 times as many sample cases as 1-year estimates 5-year estimates provide information based on the last year and the 4 years before that 5-year estimates are based on 5 times as many sample cases as 1-year estimates

43
Reliability Note: Fictional data

44
Example 2008 1-year estimates 2006-2008 3-year estimates 2008 2006-2008

45
What should I be aware of when using multiyear estimates?

46
Inflation Adjustment Dollar-valued data items are inflation adjusted to the most recent year for the period Dollar-valued data items are inflation adjusted to the most recent year for the period Income, rent, home value, and energy costs Income, rent, home value, and energy costs Adjusted using inflation factors based on the Consumer Price Index (CPI) Adjusted using inflation factors based on the Consumer Price Index (CPI) Adjustment designed to put the data into dollars with equal purchasing power Adjustment designed to put the data into dollars with equal purchasing power
 Adjusted using inflation factors based on the Consumer Price Index (CPI) Adjustment designed to put the data into dollars with equal purchasing power Adjustment designed to put the data into dollars with equal purchasing power")
47
Geographic Boundaries Multiyear estimates are based on geographic boundaries as of January 1 of the last year in the multiyear period Multiyear estimates are based on geographic boundaries as of January 1 of the last year in the multiyear periodExample: 2008-2012 ACS estimates use boundaries as of Jan 1, 2012 Boundaries of other statistical areas will be updated every decade in conjunction with the decennial census Boundaries of other statistical areas will be updated every decade in conjunction with the decennial census

48
Geographic Boundaries

49
Summary: What Have We Learned? Multiyear estimates are period estimates Multiyear estimates are period estimates Multiyear estimates should be interpreted and labeled as period estimates Multiyear estimates should be interpreted and labeled as period estimates Data users should consider the tradeoffs of currency versus reliability Data users should consider the tradeoffs of currency versus reliability

50
Where can I find Census data?

51
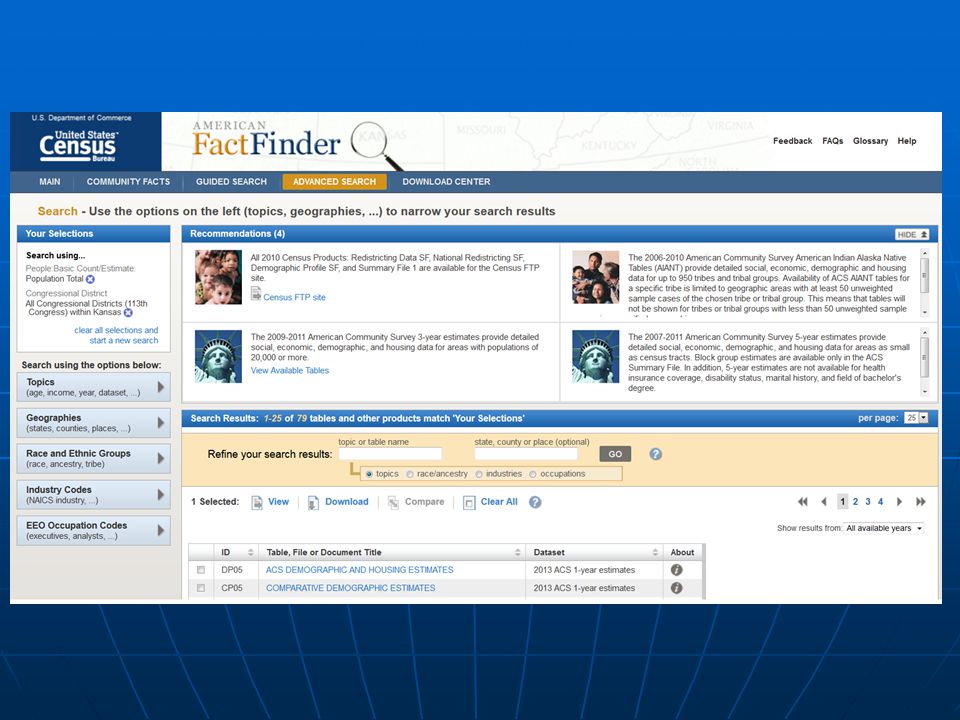
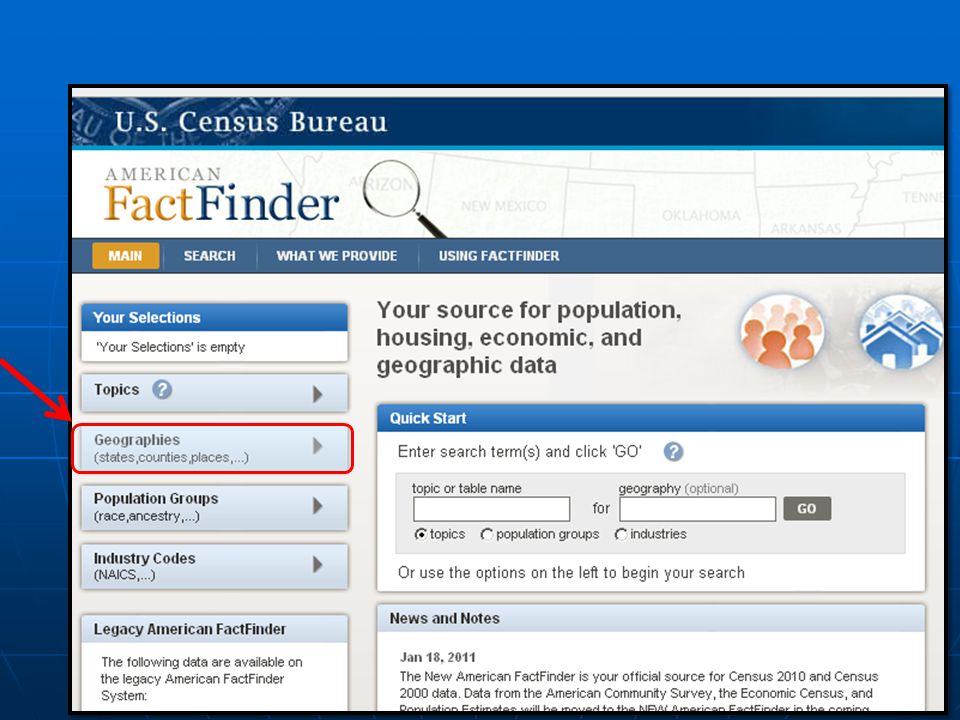
American FactFinder

60
TIGER ® Products

61
Example 1: Create simple county-level map using Census 2010 geodatabase

62
2010 Census Geodatabase National level geodatabase containing boundaries and data for states, counties, and Census tracts. National level geodatabase containing boundaries and data for states, counties, and Census tracts. Data items include total population, total housing units, median age, population 16 years and over, population 65 years and over, race, relationship, average household size, and many others. Data items include total population, total housing units, median age, population 16 years and over, population 65 years and over, race, relationship, average household size, and many others.

63
Median Age

64
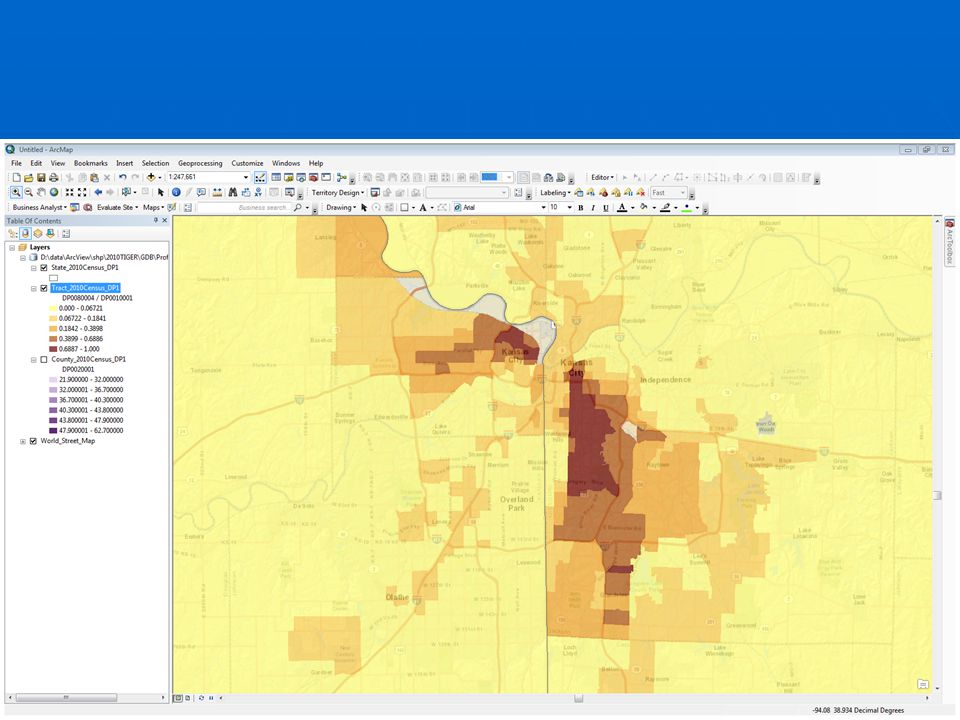
Example 2: Create tract-level map using Census 2010 data

65
Percent African-American

67
Example 3: Create block-level map using Census 2010 data

68
Dot density map of race/ethnicity

69
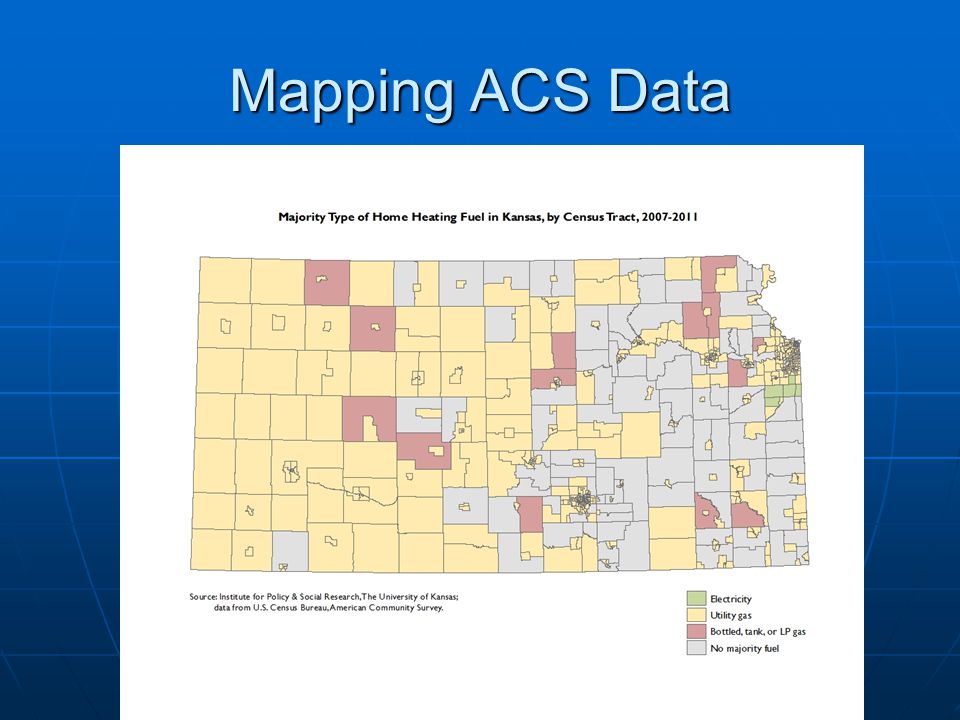
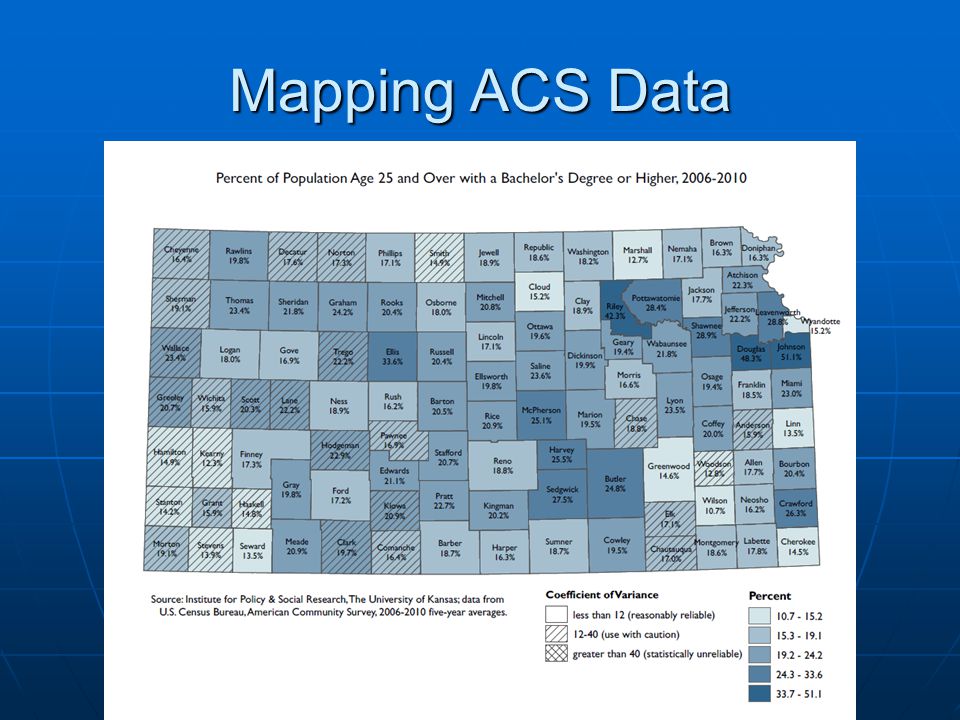
Examples 4-8: Mapping ACS Data

70
Mapping ACS Data

75
Questions? Xan Wedel Institute for Policy & Social Research 607 Blake Hall xan@ku.edu

Similar presentations


 Data Frank Gossette November 16, 2013.>")


 2005 Data Release.>")


