Download presentation
Presentation is loading. Please wait.

1
Integration in London Eric Kaufmann Birkbeck College, University of London e.kaufmann@bbk.ac.uk

2
Social Integration Commission “Londoners are proportionally less integrated by social grade, ethnicity and age than the rest of Britain.” Source: ‘How Integrated is Modern Britain?’, Social Integration Commission, 2014, p. 28

3
London’s White British are distinct White British in London are more elite than rest of England and Wales, minorities not Larger gap means class and ethnicity reinforce segregation in London, more so than rest of England & Wales Same picture 2011 as 1971, but transition from student to work seems even harder for minorities now

4
LONDON 2011 Occupational ClassWhite BritishMinoritiesDifference Higher professionals14.1%9.2%5.0% Lower professionals26.4%16.3%10.0% Intermediate15.3%9.9%5.4% Own account9.2%7.7%1.6% Lower supervisory5.5%5.4%0.1% Routine18.5%20.8%-2.3% Not working4.9%16.0%-11.1% Full-time students6.0%14.7%-8.7% ENGLAND & WALES Occupational ClassWhite BritishMinoritiesDifference Higher professionals9.9%8.9%1.0% Lower professionals21.4%14.6%6.8% Intermediate14.0%8.8%5.2% Own account9.6%8.7%0.9% Lower supervisory7.6%5.3%2.2% Routine26.9%22.5%4.4% Not working4.5%15.9%-11.4% Full-time students6.1%15.2%-9.1%

5
LONDON 1971 Occupational ClassWhite BritishMinorities%Difference Higher professionals11.87.04.7 Lower professionals22.012.69.4 Intermediate12.87.65.1 Own account7.75.91.8 Lower supervisory4.64.10.5 Routine15.416.0-0.6 Not working4.112.3-8.2 Full-time students5.011.3-6.3 ENGLAND AND WALES 1971 Occupational ClassWhite BritishMinoritiesDifference Higher professionals8.26.71.5 Lower professionals17.711.06.7 Intermediate11.66.74.9 Own account7.96.61.3 Lower supervisory6.34.02.2 Routine22.217.05.2 Not working3.712.0-8.3 Full-time students5.111.5-6.4

6
Share in Social Housing, by Ethnic Group, 2011 MinorityWhite BritishWhite Other North East13.5%20.6%21.2% North West17.6%15.2%12.6% Yorkshire & Humber16.5%15.4%11.0% East Midlands14.6%13.5%8.9% West Midlands16.3% 10.6% East of England14.6%15.0%9.2% London29.5%19.4%13.3% South East12.3%12.9%5.4% South West17.0%12.4%6.1% Wales14.4%14.5%9.3%

7
2011 London Youth Unemployment Source: Hughes, C. and L. Crowley. 2014. ‘London: A Tale of Two Cities,’ Work Foundation, April, p. 14

8
2011 London non-European Minorities

9
Source: London: A Tale of Two Cities-Addressing the youth employment challenge (Work Foundation, April 2014

10
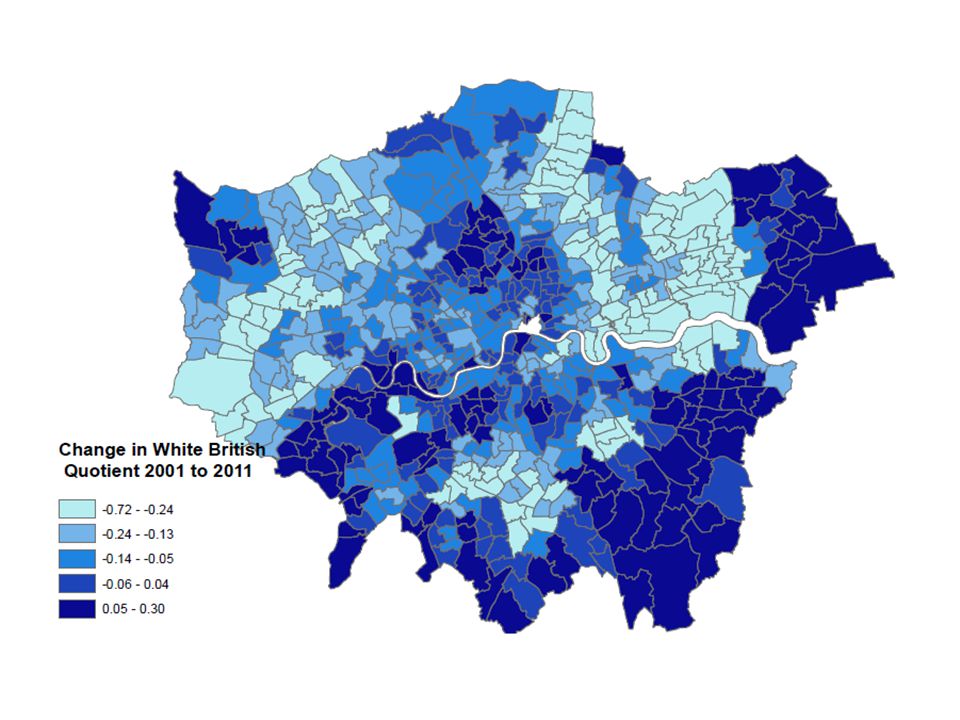
Integration in London Segregation is relative, not absolute: over 1 in 5 households in London is mixed-ethnicity, about twice the number as England & Wales Ethnic groups leaving their concentrations But White British avoiding diverse areas

12
Source: Catney, G. 2013. ‘Has neighbourhood ethnic segregation decreased?’ (CoDE/JRF/ESRC/U Manchester)
.")
13
Save our Census! The permission of the Office for National Statistics to use the Longitudinal Study is gratefully acknowledged, as is the help provided by staff of the Centre for Longitudinal Study Information & User Support (CeLSIUS). CeLSIUS is supported by the ESRC Census of Population Programme (Award Ref: ES/K000365/1). The authors alone are responsible for the interpretation of the data. Census output is Crown copyright and is reproduced with the permission of the Controller of HMSO and the Queen's Printer for Scotland. The results presented are based on a test version of the LS database incorporating 2011 Census data. Figures may be subject to change when the final version of this database is released in November 2013.
. CeLSIUS is supported by the ESRC Census of Population Programme (Award Ref: ES/K000365/1). The authors alone are responsible for the interpretation of the data. Census output is Crown copyright and is reproduced with the permission of the Controller of HMSO and the Queen s Printer for Scotland. The results presented are based on a test version of the LS database incorporating 2011 Census data. Figures may be subject to change when the final version of this database is released in November")
14
White BritishNet Migration to London from Rest of England and Wales InOutNet% Change 1971-19813,0307,495-4,465-14.7% 1981-19913,7247,208-3,484-11.0% 1991-20013,5667,402-3,836-11.0% 2001-112,9536,962-4,009-13.4% White British WB Working/ Middle Class WB Professional WB with Children WB Twenties 1971-1981-14.7%-14.0%-11.2%-21.9%-2.1% 1981-1991-11.0%-12.0%-10.0%-13.1%11.7% 1991-2001-11.0%-12.7%-6.4%-15.1%27.7% 2001-11-13.4%-15.3%-12.4%-19.6%24.0% Minority Minority Working/ Middle Class Minority Professional Minority with Children Minority Twenties 1971-19811.0%2.1%1.9%0.7%9.6% 1981-19912.7%2.3%3.1%3.3%11.0% 1991-2001-1.9%-1.5%-1.3%-3.6%2.3% 2001-11-4.1% -3.8%-6.9%0.5% Net Migration from London by Ethnicity: with rest of England & Wales, 1971-2011

15
Displacement in cities Avoidance elsewhere

18
Source: BHPS 1991-2008; UKLHLS 2009-2012

19
White Flight?: Yougov-ESRC-BBK Survey, August 2013 Moved To Whiter Ward past 10 yrs Moved To More Diverse Ward past 10 yrsSample Not White British53%47%47 White British62%38%239 Total60%40%286

20
Comfort with spouse of different race among ward movers, White British only (Yougov/ESRC survey) To WhiterTo Diverse Sample very comfortable61%39%83 fairly comfortable67%33%33 neither comfortable n57%43%46 fairly uncomfortable64%36%11 very uncomfortable76%24%25 don't know58%42%24 Total63%37%222
 To WhiterTo Diverse Sample very comfortable61%39%83 fairly comfortable67%33%33 neither comfortable n57%43%46 fairly uncomfortable64%36%11 very uncomfortable76%24%25 don t know58%42%24 Total63%37%222")
21
Toward v Away from Diversity – Statistical Models White British leave diversity when: in more diverse ward, with children, working/middle class more than Professionals; Toward diversity: in mixed-ethnicity house, renter, 20s. English v. British/Celtic not significant (no white flight?) Minorities leave diversity when: in mixed-race house, English; toward diversity: in whiter ward. London: – White: in mixed ethnic house, degree, young, foreign-born predicts stayer. – 20% of white British in Inner London live in mixed ethnicity households – English, UK-born predicts move out – Higher education/occupation, foreign-born predicts move to London from elsewhere in UK
 Minorities leave diversity when: in mixed-race house, English; toward diversity: in whiter ward. London: – White: in mixed ethnic house, degree, young, foreign-born predicts stayer. – 20% of white British in Inner London live in mixed ethnicity households – English, UK-born predicts move out – Higher education/occupation, foreign-born predicts move to London from elsewhere in UK.")
22
Unconscious Segregation Source: Citizenship Surveys 2007-11

23
Source: Home Office Citizenship Survey (Office for National Statistics and Home Office 2011)
")
24
Source: Plymouth Elections Centre BNP Vote and Ethnic Change

25
Conclusion High levels of mixing, but not relative to what is expected in a more diverse population (where more opportunities to mix) London has high relative class and ethnic segregation Caused by greater overlap of ethnicity and class in London because of elite nature of white British population Minorities are spreading out, White British are avoiding diversity (unconsciously) Issues: – *minority transition from university/FE into work – minority isolation from White British – mass housebuilding causing rapid ethnic shifts in homogeneous areas, may stoke majority response – alienation from rest of England (??)
 London has high relative class and ethnic segregation Caused by greater overlap of ethnicity and class in London because of elite nature of white British population Minorities are spreading out, White British are avoiding diversity (unconsciously) Issues: – *minority transition from university/FE into work – minority isolation from White British – mass housebuilding causing rapid ethnic shifts in homogeneous areas, may stoke majority response – alienation from rest of England ( )")
Similar presentations