Download presentation
Presentation is loading. Please wait.

1
White Flight in England? Opposition to Diversity and Mobility Decisions in Britain, 1991-2012 Eric Kaufmann and Gareth Harris, Birkbeck College e.kaufmann@bbk.ac.uke.kaufmann@bbk.ac.uk; g.harris1@bbk.ac.ukg.harris1@bbk.ac.uk http://www.sneps.net/research-interests/whiteworkingclass http://www.sneps.net/research-interests/whiteworkingclass twitter: @epkaufm

2
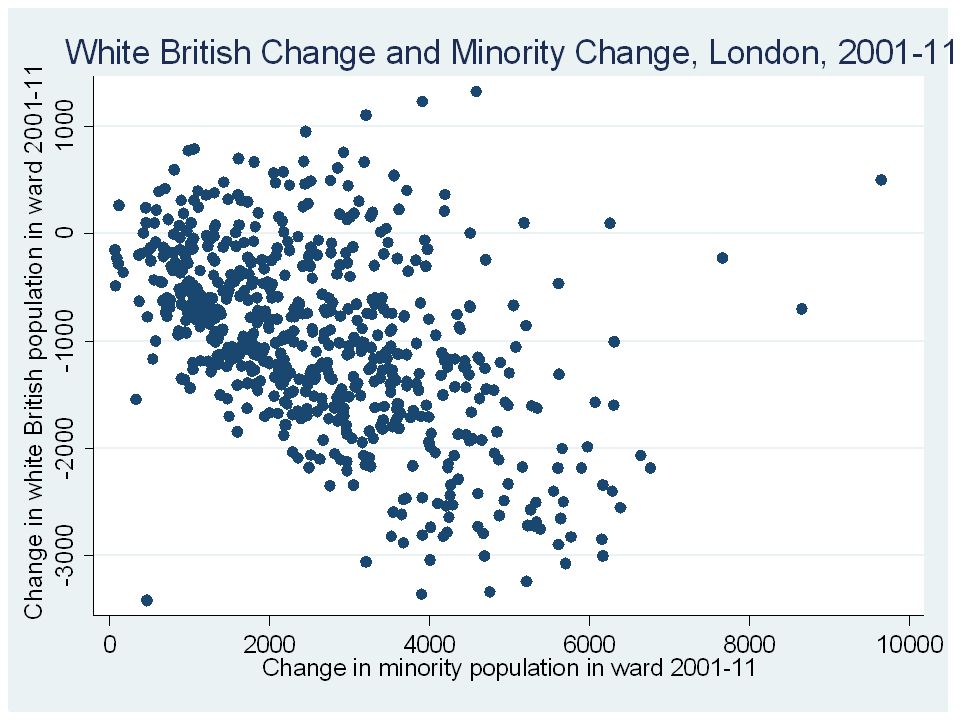
White Flight?

4
Save our Census! The permission of the Office for National Statistics to use the Longitudinal Study is gratefully acknowledged, as is the help provided by staff of the Centre for Longitudinal Study Information & User Support (CeLSIUS). CeLSIUS is supported by the ESRC Census of Population Programme (Award Ref: ES/K000365/1). The authors alone are responsible for the interpretation of the data. Census output is Crown copyright and is reproduced with the permission of the Controller of HMSO and the Queen's Printer for Scotland. The results presented are based on a test version of the LS database incorporating 2011 Census data. Figures may be subject to change when the final version of this database is released in November 2013.
. CeLSIUS is supported by the ESRC Census of Population Programme (Award Ref: ES/K000365/1). The authors alone are responsible for the interpretation of the data. Census output is Crown copyright and is reproduced with the permission of the Controller of HMSO and the Queen s Printer for Scotland. The results presented are based on a test version of the LS database incorporating 2011 Census data. Figures may be subject to change when the final version of this database is released in November")
6
Predicted Ward Minority Change among Inter-ward Movers, 1991-2011 (BHPS/UKHLS) % Ethnic Minority in Ward a year ago % Change in Ethnic Minorities in Ward
 % Ethnic Minority in Ward a year ago % Change in Ethnic Minorities in Ward")
8
Simpson (2007) Method Wards % White Quintile 1755498 Quintile 272687 Quintile 328873 Quintile 418057 Quintile 510234 Total885091 Toward diversity Away from diversity
 Method Wards % White Quintile Quintile Quintile Quintile Quintile Total Toward diversity Away from diversity")
9
Predicted Probability of Move Away from Diversity, Inter-ward Movers, 2001-11 (ONS LS) Most Diverse Ward Whitest ward Probability of move to less diverse ward quintile
 Most Diverse Ward Whitest ward Probability of move to less diverse ward quintile")
10
Ordered Logit of Change in White Quintile in the direction of % White, 2001-11. Inter-ward movers only. (ONS Longitudinal Study):
:.")
11
White Flight?: Yougov-ESRC-BBK Survey, August 2013 Moved To Whiter Ward past 10 yrs Moved To More Diverse Ward past 10 yrsSample Not White British53%47%47 White British62%38%239 Total60%40%286

12
Comfort with spouse of different race among ward movers, White British only (Yougov/ESRC survey) To WhiterTo Diverse Sample very comfortable61%39%83 fairly comfortable67%33%33 neither comfortable n57%43%46 fairly uncomfortable64%36%11 very uncomfortable76%24%25 don't know58%42%24 Total63%37%222
 To WhiterTo Diverse Sample very comfortable61%39%83 fairly comfortable67%33%33 neither comfortable n57%43%46 fairly uncomfortable64%36%11 very uncomfortable76%24%25 don t know58%42%24 Total63%37%222")
13
Local Council Wards in the UK have a population of about 10,000 to 30,000 people. Have you moved Local Council Ward to live somewhere new at any time in the past ten years? – No 66.24% (1085) – Yes 28.39% (465) – Don’t know 5.37% (88) As far as you know, did the last Local Council Ward in which you lived have…? – More people from an ethnic minority background than the ward I now live in now 37.4% (174) – Fewer people from an ethnic minority background than the ward I now live in now 22.8% (106) – About the same number of people from an ethnic minority background than the ward I now live in now 23.2% (108) – Don’t know 16.6% (77)
 – Yes 28.39% (465) – Don’t know 5.37% (88) As far as you know, did the last Local Council Ward in which you lived have…. – More people from an ethnic minority background than the ward I now live in now 37.4% (174) – Fewer people from an ethnic minority background than the ward I now live in now 22.8% (106) – About the same number of people from an ethnic minority background than the ward I now live in now 23.2% (108) – Don’t know 16.6% (77).")
16
Cultural Amenities not Ethnocentrism “If the church bulletin board is where people advertise rooms for rent, blacks will rent rooms from blacks and whites from whites because of a communication system…correlated with color” – Thomas Schelling 1978 White British family/friend/association networks and minority networks differ in England, affecting where people relocate once they decide to move Cultural amenities (food, recreation, religion) are also correlated with ethnic composition
 are also correlated with ethnic composition")
17
Unconscious Segregation I: Social Ties Source: UKHLS 2009-12

18
Unconscious Segregation II: Amenities Source: Citizenship Surveys 2007-11

19
Future Research Look at individual ethnic minorities to screen out friends & family effect Each ethnic group is relatively attracted to own area, i.e. Caribbeans to Caribbean areas, but white/minority appears to remain important

20
Integration with Ethnic Preference 54.2% 16.6% 5.3% ‘Segregation’ 8.2% ‘Integration’ White British Minorities

21
Prob. move away from Diversity by 4 quintiles Prob. move toward Diversity by 4 quintiles Prob. move away from Diversity by 1 quintile Prob. move toward Diversity by 1 quintile Increasingly white quintiles

Similar presentations


 pantry survey found that.>")


