Download presentation
Presentation is loading. Please wait.

1
Ag Outlook Ackley State Bank Ag Outlook Iowa Falls, Iowa Dec. 17, 2015
Chad Hart Associate Professor/Crop Markets Specialist 1 1

2
Key Factors for Livestock
Feedstuffs – ADVANTAGEOUS for livestock sector Size of hog industry driven by last year’s profitability – Productivity to guide 2016 supply prospects Tight cattle-beef supplies but expansion well underway – Supply of heavy cattle has driven market lately HPAI in U.S. poultry – HUGE hit on layers/eggs, only meat impact was turkey, broilers were okay – Rebuild/expansion underway Relatively stable domestic dairy herd expected through 2017 – Worldwide production up, prices U.S. consumer demand has been GOOD – International trade a bit of a drag but should improve

3
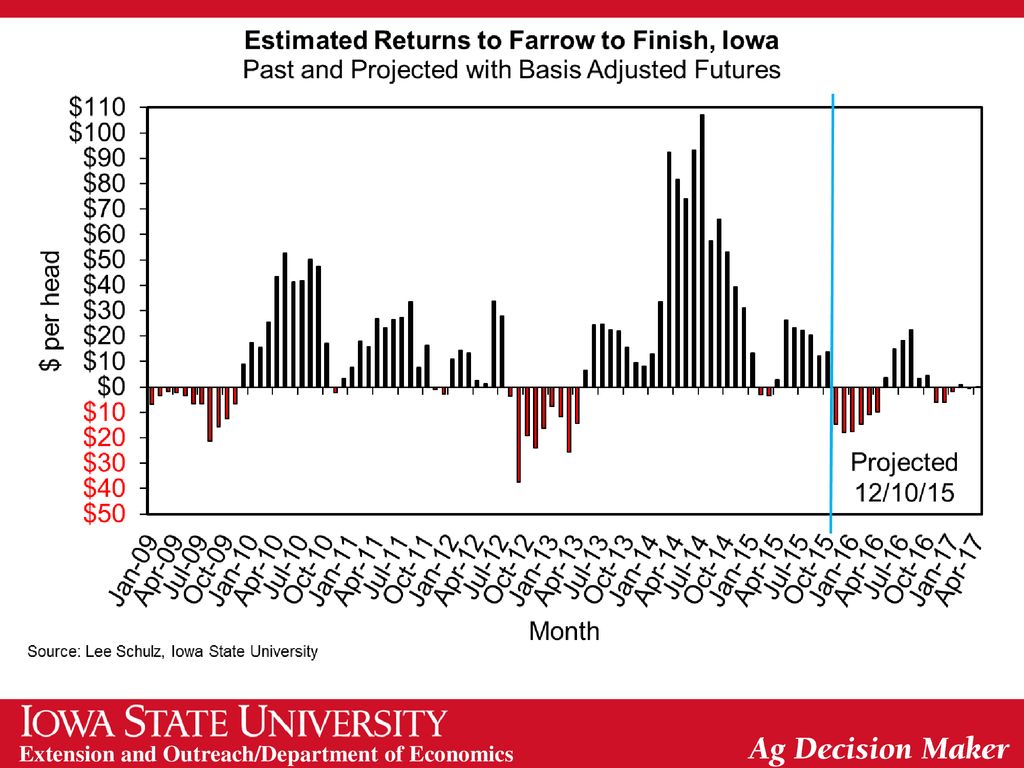
Hog Crush Margin The Crush Margin is the return after the pig, corn and soybean meal costs. Carcass weight: 200 pounds Pig price: 50% of 5 mth out lean hog futures Corn: 10 bushels per pig Soybean meal: 150 pounds per pig Source: ISU Extension

5
USDA Quarterly Hogs and Pigs Report – United States
September 25, 2015 2015 as % Pre-Report Actual - 2014 2015 of 2014 Range Estimate Inventories on Sep 1 * All hogs and pigs 65,979 68,395 103.7 103.6 0.1 Kept for breeding 5,920 5,986 101.1 100.3 0.8 Market 60,059 62,410 103.9 0.0 Under 50 pounds 20,390 20,291 99.5 100.2 -0.7 pounds 17,458 17,986 103.0 103.2 -0.2 pounds 12,112 13,080 108.0 106.6 1.4 180 pounds and over 10,098 11,053 109.5 109.7 Farrowing ** Jun – Aug sows farrowed 2,991 2,944 98.4 98.1 0.3 Sep – Nov intentions 2,994 2,920 97.5 97.2 Dec – Feb intentions 2,895 2,875 99.3 99.1 0.2 Jun – Aug Pig Crop * 30,402 30,585 100.6 100.4 Jun – Aug Pigs per Litter 10.16 10.39 102.3 102.4 -0.1 * 1,000 head ** 1,000 litters Data Source: USDA/NASS. Urner Barry pre-report estimates

6
New Pork Packing Plants (2017) Sioux City, IA ― Seaboard/Triumph
Coldwater, MI ― Clements Foods Data Source: USDA/AMS. * Steve Meyer, Vice President, Pork Analysis, Express Markets Inc. Analytics.

7
U.S. Pork Exports, Jan-Oct 2015
(Volume excluding by-products & variety meats) Oct-15/Sep-15 Oct-15/Oct-14 Year-to-Date Country Percent 1,000 lbs Japan -10% -4% -40,063 Mexico 3% 10% 134,708 12% Canada -15% -1% -15,458 -3% South Korea 50% -6% 104,843 34% China (Mainland) -9% 7% -92,686 -30% Hong Kong 126% 45% -12,032 -12% Australia -25% 87% 13,165 Philippines -11% 99% -24,900 -29% China (Taiwan) 29% 378% 11,199 49% Honduras 5% 11,100 27% Colombia 38% 6% -17,701 -16% Dominican Republic 1% 60% 14,422 36% Chile -22% -41% 2,144 Other Countries 23% -107,287 -39% Total 2% -18,544 -0.5% WASDE U.S.: 2014: 4,857 mil lbs : 4,946 (+1.8% vs 2014) : 5,125 (+3.6% vs 2015) Source: USDA/ERS
 Oct-15/Sep-15. Oct-15/Oct-14. Year-to-Date. Country. Percent. 1,000 lbs. Japan. -10% -4% -40,063. Mexico. 3% 10% 134, % Canada. -15% -1% -15, % South Korea. 50% -6% 104, % China (Mainland) -9% 7% -92, % Hong Kong. 126% 45% -12, % Australia. -25% 87% 13,165. Philippines. -11% 99% -24, % China (Taiwan) 29% 378% 11, % Honduras. 5% 11, % Colombia. 38% 6% -17, % Dominican Republic. 1% 60% 14, % Chile. -22% -41% 2,144. Other Countries. 23% -107, % Total. 2% -18, % WASDE U.S.: 2014: 4,857 mil lbs 2015: 4,946 (+1.8% vs 2014) 2016: 5,125 (+3.6% vs 2015) Source: USDA/ERS.")
8
LMIC Pork Production and Price Quarterly Forecasts (12/10/15)
Sources: USDA/NASS; USDA/AMS Livestock Market News; Projections and Forecasts by LMIC Year Comm’l % Chg. Avg Carcass Comm’l Pork Quarter Slaughter Year Ago Weight Production 2015 I 28,723 5.9 215 0.8 6,161 6.5 II 27,848 8.9 213 -1.1 5,925 7.6 III 28,474 11.4 209 -1.5 5,957 9.8 IV 30,243 5.7 214 -0.2 6,478 115,288 7.9 -0.5 24,521 7.3 2016 29,161 1.5 6,257 1.6 27,536 0.2 5,877 -0.8 28,319 0.1 5,929 30,435 0.6 0.3 6,537 0.9 115,451 24,600 2017 29,909 2.6 6,431 2.8 28,163 2.3 6,023 2.5 28,495 210 5,976 31,335 3.0 6,742 3.1 117,902 2.1 25,172

9
LMIC Pork Production and Price Quarterly Forecasts (12/10/15)
Sources: USDA/NASS; USDA/AMS Livestock Market News; Projections and Forecasts by LMIC Year Nat’l Wtd % Chg. CME Quarter Avg Base Price Year Ago LHF Price 2015 I 68.55 -25.0 II 73.52 -34.3 III 74.60 -32.3 IV 63-64 -29.5 70-71 -30.2 2016 64-66 -5.2 59-63 74-78 3.4 63-76 75-80 4.0 67-76 65-71 7.1 64-67 71-73 2.1 2017 62-69 0.8 67-68 70-78 -2.6 70-79 -3.9 60-70 -4.4 66-74 -2.8

10
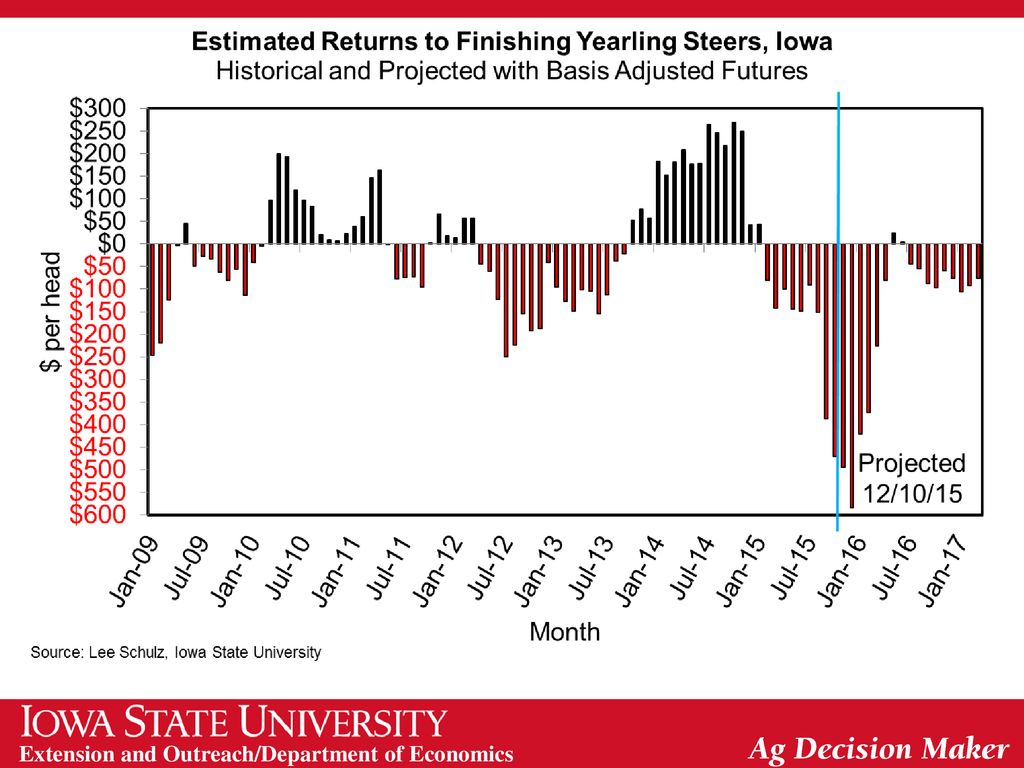
Cattle Crush Margin The Crush Margin is the return after the feeder steer and corn costs. Live weight: pounds Feeder weight: 750 pounds Corn: 50 bushels per head Source: ISU Extension

11
Quarterly Cattle & Beef Forecasts (LMIC: 12/10/2015)
Change Average Commercial from Dressed Beef Year Slaughter Year Ago Weight Production Quarter (1,000 hd) (%) (lbs) (mil lbs) 2015 I 6,967 -5.5 813 2.2 5,664 -3.5 II 7,227 -7.8 810 2.7 5,855 -5.3 III 7,288 -4.5 832 2.8 6,066 -1.8 IV 7,283 -0.6 841 2.3 6,123 1.7 28,765 -4.7 824 2.5 23,708 -2.2 2016 7,140 822 1.1 5,868 3.6 7,405 0.4 6,020 7,623 4.6 836 6,370 5.0 7,519 3.2 839 -0.2 6,309 3.0 29,687 828 24,567 2017 7,446 4.3 827 0.7 6,161 7,720 816 6,299 7,815 6,559 7,857 4.5 842 6,616 4.9 30,838 3.9 831 0.5 25,635
 (%) (lbs) (mil lbs) I. 6, , II. 7, , III. 7, , IV. 7, , , , , , , ,020. 7, , , , , , , ,161. 7, ,299. 7,815. 6,559. 7, , , ,635.")
12
Quarterly Cattle & Beef Forecasts (LMIC: 12/10/2015)
Steer Price Change From Feeder Steer Price Year 5-Mkt Avg Year Ago Southern Plains Quarter ($/cwt) (%) 7-800# 5-600# 2015 I 162.43 11.0 215.87 276.14 II 158.11 7.0 225.29 279.32 III 144.22 -9.0 214.38 246.04 IV -20.0 -3.3 2016 -12.6 -7.7 -2.6 6.4 -4.3 2017 -0.4 -2.7 -1.8 -1.1 -2.1
 (%) 7-800# 5-600# I II III IV")
13
Data Source: USDA & LMIC, Compiled by LMIC
Livestock Marketing Information Center

15
Cattle on Feed―11/20 report (1,000+ head capacity feedlots)
Nov .1 On Feed: +2.1% Vs. +2.2% pre-report est. (+1.6%, +3.2%) IA: +8.5% vs last year [1,000+ Head] IA: +6.3% vs last year [<1,000 Head] Oct. Placements: -3.7% Vs. -3.9% pre-report est. (-6.2%, -1.6%) IA: +18.2% vs last year; largest (+) of main states [1,000+ Head] IA: +9.3% vs last year [<1,000 Head] Oct. Marketings: -3.3% Vs. -3.9% pre-report est. (-5.0%, -2.0%) IA: +13.0% vs last year (TX -14%, KS -6%, SD -9%, MN +45%) [1,000+ Head] IA: +28.8% vs last year [<1,000 Head]
 IA: +8.5% vs last year [1,000+ Head] IA: +6.3% vs last year [<1,000 Head] Oct. Placements: -3.7% Vs. -3.9% pre-report est. (-6.2%, -1.6%) IA: +18.2% vs last year; largest (+) of main states [1,000+ Head] IA: +9.3% vs last year [<1,000 Head] Oct. Marketings: -3.3% Vs. -3.9% pre-report est. (-5.0%, -2.0%) IA: +13.0% vs last year (TX -14%, KS -6%, SD -9%, MN +45%) [1,000+ Head] IA: +28.8% vs last year [<1,000 Head]")
16
Data Source: USDA-AMS & USDA-NASS
Livestock Marketing Information Center

17
Data Source: USDA-AMS & USDA-NASS
Livestock Marketing Information Center

18
U.S. Beef Exports, Jan-Oct 2015
(Volume excluding by-products & variety meats) Oct-15/Sep-15 Oct-15/Oct-14 Year-to-Date Country Percent 1,000 lbs Mexico 14% 13% -72,469 -20% Japan -12% -41% -102,254 -18% Canada 16% -10% -39,635 -13% South Korea 24% -11% 13,385 5% Hong Kong 79% -93,350 -28% China (Taiwan) 20% -16% 2,785 3% Vietnam 65% 42% 2,871 43% Netherlands -1% 2,459 8% Philippines 28% -17% 2,510 10% United Arab Emirates 87% -3% 1,273 11% Dominican Republic 40% 37% 3,022 Chile 6% 7% -2,688 Italy -40% -582 -4% Other Countries 2% -6,337 -5% Total 18% -14% -289,010 -13.4% WASDE U.S.: 2014: 2,573 mil lbs 2015: 2,223 (-13.6%) 2016: 2,425 (+9.1%) Source: USDA/ERS
 Oct-15/Sep-15. Oct-15/Oct-14. Year-to-Date. Country. Percent. 1,000 lbs. Mexico. 14% 13% -72, % Japan. -12% -41% -102, % Canada. 16% -10% -39, % South Korea. 24% -11% 13,385. 5% Hong Kong. 79% -93, % China (Taiwan) 20% -16% 2,785. 3% Vietnam. 65% 42% 2, % Netherlands. -1% 2,459. 8% Philippines. 28% -17% 2, % United Arab Emirates. 87% -3% 1, % Dominican Republic. 40% 37% 3,022. Chile. 6% 7% -2,688. Italy. -40% % Other Countries. 2% -6, % Total. 18% -14% -289, % WASDE U.S.: 2014: 2,573 mil lbs 2015: 2,223 (-13.6%) 2016: 2,425 (+9.1%) Source: USDA/ERS.")
19
U.S. Beef Imports, Jan-Oct 2015
(Volume excluding by-products & variety meats) Oct-15/Sep-15 Oct-15/Oct-14 Year-to-Date Country Percent 1,000 lbs Australia -33% 292,365 34% Canada -6% 5% 33,975 7% New Zealand -17% 8% 91,299 17% Brazil -29% 20% 66,532 99% Uruguay 13% 57% 43,388 Mexico 9% 76,725 30% Nicaragua 53% -42% -13,396 -13% Argentina -100% -186 Costa Rica -14% -22% 1,811 Other Countries -8% 755 Total -18% 593,269 25% WASDE U.S.: 2014: 2,947 mil lbs 2015: 3,382 (+14.8%) 2016: 2,945 (-12.9%) Source: USDA/ERS
 Oct-15/Sep-15. Oct-15/Oct-14. Year-to-Date. Country. Percent. 1,000 lbs. Australia. -33% 292, % Canada. -6% 5% 33,975. 7% New Zealand. -17% 8% 91, % Brazil. -29% 20% 66, % Uruguay. 13% 57% 43,388. Mexico. 9% 76, % Nicaragua. 53% -42% -13, % Argentina. -100% Costa Rica. -14% -22% 1,811. Other Countries. -8% 755. Total. -18% 593, % WASDE U.S.: 2014: 2,947 mil lbs 2015: 3,382 (+14.8%) 2016: 2,945 (-12.9%) Source: USDA/ERS.")
20
U.S. Corn Supply and Use 2012 2013 2014 2015 2015 Δ Area Planted
(mil. acres) 97.3 95.4 90.6 88.4 Yield (bu./acre) 123.1 158.1 171.0 169.3 Production (mil. bu.) 10,755 13,829 14,216 13,654 Beg. Stocks 989 821 1,232 1,731 Imports 160 36 32 30 Total Supply 11,904 14,686 15,479 15,415 Feed & Residual 4,315 5,040 5,315 5,300 Ethanol 4,641 5,124 5,209 5,200 25 Food, Seed, & Other 1,397 1,369 1,359 1,380 Exports 730 1,920 1,864 1,750 -50 Total Use 11,083 13,454 13,748 13,630 -25 Ending Stocks 1,785 Season-Average Price ($/bu.) 6.89 4.46 3.70 3.65 Source: USDA-WAOB 20 20
 Yield. (bu./acre) Production. (mil. bu.) 10, , , ,654. Beg. Stocks ,232. 1,731. Imports Total Supply. 11, , , ,415. Feed & Residual. 4,315. 5,040. 5,315. 5,300. Ethanol. 4,641. 5,124. 5,209. 5, Food, Seed, & Other. 1,397. 1,369. 1,359. 1,380. Exports ,920. 1,864. 1, Total Use. 11, , , , Ending Stocks. 1,785. Season-Average Price. ($/bu.) Source: USDA-WAOB")
21
U.S. Soybean Supply and Use
2012 2013 2014 2015 2015 Δ Area Planted (mil. acres) 77.2 76.8 83.3 83.2 Yield (bu./acre) 40.0 44.0 47.5 48.3 Production (mil. bu.) 3,042 3,358 3,927 3,981 Beg. Stocks 169 141 92 191 Imports 41 72 33 30 Total Supply 3,252 3,570 4,052 4,203 Crush 1,689 1,734 1,873 1,890 Seed & Residual 105 107 145 133 Exports 1,317 1,638 1,843 1,715 Total Use 3,111 3,478 3,861 3,738 Ending Stocks 465 Season-Average Price ($/bu.) 14.40 13.00 10.10 8.90 Source: USDA-WAOB 21 21
 Yield. (bu./acre) Production. (mil. bu.) 3,042. 3,358. 3,927. 3,981. Beg. Stocks Imports Total Supply. 3,252. 3,570. 4,052. 4,203. Crush. 1,689. 1,734. 1,873. 1,890. Seed & Residual Exports. 1,317. 1,638. 1,843. 1,715. Total Use. 3,111. 3,478. 3,861. 3,738. Ending Stocks Season-Average Price. ($/bu.) Source: USDA-WAOB")
22
Corn Yield Estimate Top: 2015 Estimated Yields
Bottom: Change from last month Units: Bushels/acre Source: USDA-NASS

23
Soybean Yield Estimate
Top: 2015 Estimated Yields Bottom: Change from last month Units: Bushels/acre Source: USDA-NASS

24
World Corn Production Source: USDA-WAOB 24 24

25
World Soybean Production
Source: USDA-WAOB 25 25

26
U.S. Meat Production & Prices
Source: USDA-WAOB 26 26

27
Corn Export Sales Source: USDA-FAS

28
Corn Export Sales Source: USDA-FAS

29
Strength of the U.S. Dollar
Source: Federal Reserve

30
Crude Oil Prices Sources: EIA and CME

31
Soybean Export Sales Source: USDA-FAS

32
Soybean Export Sales Source: USDA-FAS

33
Corn Grind for Ethanol

34
Ethanol Stocks Source: EIA

35
Ethanol Exports Source: EIA

36
Current Corn Futures 3.71 3.55 Source: CME Group, 12/16/2015

37
Current Soybean Futures
8.47 8.36 Source: CME Group, 12/16/2015

38
2015/16 Crop Margins

39
2016/17 Crop Margins

40
Iowa Corn Prices vs. Costs

41
Iowa Soybean Prices vs. Costs

42
2015 Iowa Land Values

43
2015 Iowa Land Values - % Change

44
2015 Iowa Land Values

45
2015 Iowa Land Values - % Change

46
Thank you for your time. Any questions. My web site: http://www2. econ
Thank you for your time! Any questions? My web site: Iowa Farm Outlook: Ag Decision Maker:

Similar presentations