Download presentation
Presentation is loading. Please wait.

1
Agricultural Economic Outlook
Iowa Division of Banking Annual Meeting Des Moines, Iowa June 9, 2015 Chad Hart Associate Professor/Crop Markets Specialist 1 1

2
U.S. Meat Production & Prices
Source: USDA-WAOB 2 2

3
Overarching Pork Industry
Economic Outlook Supplies Increasing; Breeding herd expansion ongoing Increase in com slght depends on inv, wts, PEDv & PRRS Demand Strength “lost” in supply story + Yr-over-Yr for 10 straight quarters +5% in Q1.2014, +8% Q2, +7% Q3, +11% Q4, & 18% Q1:2015 Combined: “excitement & uncertainty”

4
Hog Crush Margin The Crush Margin is the return after the pig, corn and soybean meal costs. Carcass weight: 200 pounds Pig price: 50% of 5 mth out lean hog futures Corn: 10 bushels per pig Soybean meal: 150 pounds per pig Source: ISU Extension

5
Data Source: USDA-NASS, Compiled & Analysis by LMIC
Livestock Marketing Information Center

6
2013 = +$ [-$25.60 to +$24.57] 2014 = +$ [+$13.15 to +$107.25] ~2015 = +$ [-$3.23 to +$39.26] ~Jan-Aug 2016 = +$18.43 [+$7.76 to +$29.96]
![2013 = +$6.21 [-$25.60 to +$24.57] 2014 = +$61.85 [+$13.15 to +$107.25] ~2015 = +$17.31 [-$3.23 to +$39.26]](http://slideplayer.com/slide/14670586/90/images/6/2013+%3D+%2B%246.21+%5B-%2425.60+to+%2B%2424.57%5D+2014+%3D+%2B%2461.85+%5B%2B%2413.15+to+%2B%24107.25%5D+%7E2015+%3D+%2B%2417.31+%5B-%243.23+to+%2B%2439.26%5D.jpg "~Jan-Aug 2016 = +$18.43 [+$7.76 to +$29.96]")
7
USDA Quarterly Hogs and Pigs Report – United States
March 27, 2015 2015 as % Pre-Report Actual - 2014 2015 of 2014 Range Estimate Inventories on Mar 1 * All hogs and pigs 61,494 65,934 107.2 106.8 0.4 Kept for breeding 5,851 5,982 102.2 103.5 -1.3 Market 55,643 59,953 107.7 0.5 Under 50 pounds 17,336 18,959 109.4 108.6 0.8 pounds 15,487 16,509 106.6 -0.2 pounds 12,538 13,290 106.0 106.1 -0.1 180 pounds and over 10,281 11,195 108.9 107.0 1.9 Farrowing ** Dec – Feb sows farrowed 2,763 2,829 102.4 103.7 Mar – May intentions 2,810 2,870 102.1 103.1 -1.0 Jun – Aug intentions 2,991 2,927 97.9 102.7 -4.8 Dec – Feb Pig Crop * 26,326 28,758 109.2 0.0 Dec – Feb Pigs per Litter 9.53 10.17 106.7 105.3 1.4 * 1,000 head ** 1,000 litters Data Source: USDA/NASS

8
Data Source: USDA/NASS

9
Data Source: USDA/NASS

10
Data Source: USDA/NASS

11
LMIC Pork Production and Price Quarterly Forecasts (6/1/15)
Sources: USDA/NASS; USDA/AMS Livestock Market News; Projections and Forecasts by LMIC Year Comm’l % Chg. Avg Carcass Comm’l Pork Quarter Slaughter Year Ago Weight Production 2014 I 27,131 -2.6 213 2.7 5,784 0.2 II 25,575 -4.4 215 4.4 5,504 -0.2 III 25,558 -7.6 212 4.3 5,424 -3.5 IV 28,612 -4.0 1.7 6,131 -2.3 106,876 -4.6 214 3.3 22,843 -1.5 2015 28,723 5.9 0.8 6,161 6.5 27,435 7.3 -1.3 5,832 6.0 27,739 8.5 210 -1.1 5,824 7.4 30,542 6.7 6,541 114,439 7.1 -0.5 24,358 6.6 2016 29,536 2.8 -0.4 6,327 27,211 -0.8 5,797 -0.6 27,764 0.1 211 0.3 5,845 0.4 30,237 -1.0 6,491 114,748 24,460

12
2015-YTD 0.13% (vs. 2014) Data Source: USDA/AMS
 Data Source: USDA/AMS")
13
LMIC Pork Production and Price Quarterly Forecasts (6/1/15)
Sources: USDA/NASS; USDA/AMS Livestock Market News; Projections and Forecasts by LMIC Year lbs Per Capita % Chg. Nat’l Wtd Quarter Consumption Year Ago Avg Base Price 2014 I 11.3 -1.0 91.44 12.8 II 11.0 -2.6 111.84 25.2 III 11.1 -2.3 110.03 15.5 IV 13.0 2.2 90.13 8.6 46.4 -0.8 100.86 16.1 2015 12.4 9.1 68.55 -25.0 12.0 9.3 73-75 -33.8 11.9 6.6 74-77 -31.4 13.2 1.8 63-67 -27.9 49.5 6.5 70-72 -29.7 2016 12.6 1.7 65-70 -1.5 11.6 -3.2 77-83 8.1 -2.4 78-85 7.9 12.9 -2.1 67-75 9.2 48.7 73-77 5.6

14
% of U.S. Inventory 2014 2015 IL 8.5% 8.2% IA 17.3% 17.2% MN 9.4% 9.5%
MO 6.1% 6.7% NE 6.8% 7.0% NC 14.9% OK 7.3% 7.4% Data Source: USDA/NASS

15
% of U.S. Inventory 6.7% 6.9% 5.5% 5.6% 33.2% 32.3% 12.5% 12.1% 3.6%
2014 2015 IL 6.7% 6.9% IN 5.5% 5.6% IA 33.2% 32.3% MN 12.5% 12.1% MO 3.6% 4.0% NE 4.7% 4.4% NC Data Source: USDA/NASS

16
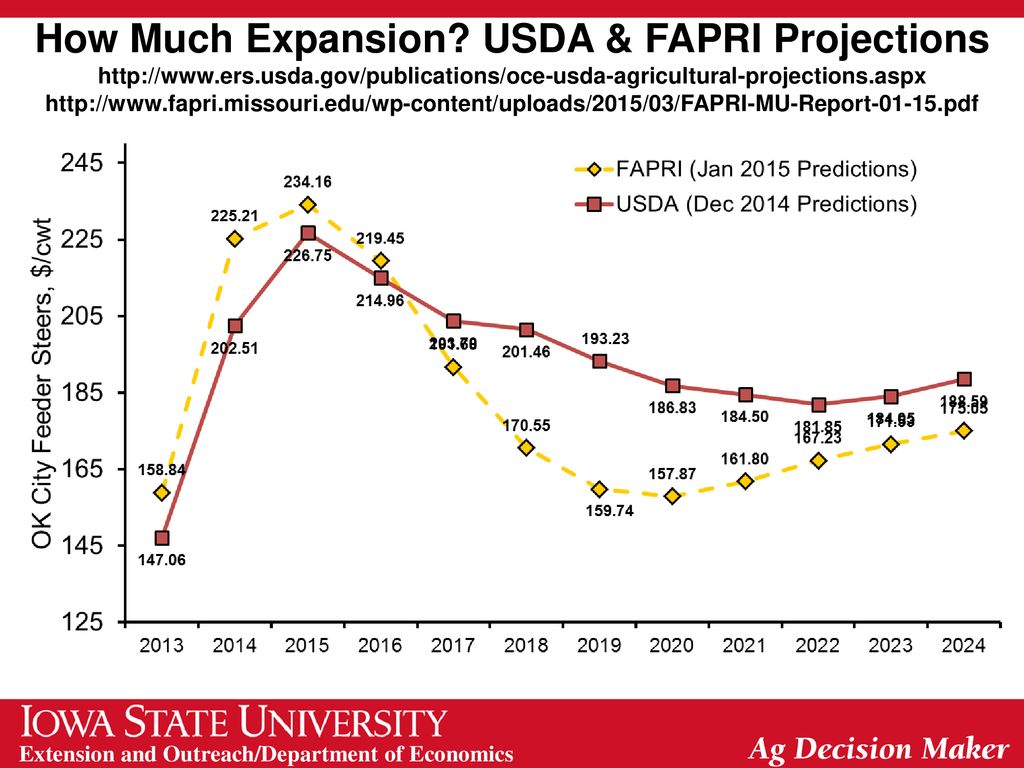
How Much Expansion? USDA & FAPRI Projections
Yr-over-Yr FAPRI 2015: +2.0% 2016: +6.9% 2017: +4.2% 2018: +0.6% : +14.0% Yr-over-Yr USDA 2015: +1.0% 2016: +2.3% 2017: +0.8% 2018: +0.8% : +8.1%

17
Overarching Beef Industry
Economic Outlook Tight beef & cattle supplies + Attractive beef-to-feed price ratios + Strong retail meat demand + Initiated (slow???) herd expansion = Record: Prices throughout industry Cash at-stake (so ROI may not be record) Opportunity/Threat ... in the eye of the beholder...
 herd expansion = Record: Prices throughout industry. Cash at-stake (so ROI may not be record) Opportunity/Threat ... in the eye of the beholder...")
18
Cattle Crush Margin The Crush Margin is the return after the feeder steer and corn costs. Live weight: pounds Feeder weight: 750 pounds Corn: 50 bushels per head Source: ISU Extension

19
Data Source: USDA-NASS, Compiled & Analysis by LMIC
Livestock Marketing Information Center

20
Quarterly Cattle & Beef Forecasts (LMIC: 6/1/2015)
Change Average Commercial from Dressed Beef Year Slaughter Year Ago Weight Production Quarter (1,000 hd) (%) (lbs) (mil lbs) 2013 I 7,781 -3.1 794 1.4 6,175 -1.7 II 8,325 0.2 782 0.4 6,513 0.6 III 8,321 -0.1 0.5 6,609 IV 8,035 -3.0 799 0.7 6,423 -2.3 32,462 -1.5 792 25,720 -0.7 2014 7,374 -5.2 796 0.3 5,868 -5.0 7,837 -5.9 789 0.9 6,184 -5.1 7,632 -8.3 810 1.9 6,179 -6.5 7,326 -8.8 822 2.8 6,021 -6.3 30,170 -7.1 804 1.5 24,252 -5.7 2015 6,967 -5.5 813 2.2 5,664 -3.5 7,430 3.1 6,044 7,553 -1.0 823 1.7 6,216 7,353 824 6,061 29,303 -2.9 819 1.8 23,985 -1.1 2016 7,073 821 1.0 5,810 2.6 7,532 815 6,142 1.6 7,617 0.8 829 6,313 7,379 6,114 29,601 24,379
 (%) (lbs) (mil lbs) I. 7, , II. 8, , III. 8, ,609. IV. 8, , , , , , , , , , , , , , , , , ,044. 7, ,216. 7, , , , , , , , , ,313. 7,379. 6, , ,379.")
21
Quarterly Cattle & Beef Forecasts (LMIC: 6/1/2015)
Live Sltr. Change Steer Price from Feeder Steer Price Year 5-Mkt Avg Year Ago Southern Plains Quarter ($/cwt) (%) 7-800# 5-600# 2014 I 146.34 16.6 171.77 209.30 II 147.82 18.3 193.16 227.67 III 158.49 29.6 225.93 263.14 IV 165.59 26.6 239.81 285.63 154.56 22.8 207.67 246.44 2015 162.43 11.0 215.87 276.14 8.6 -1.9 -4.6 2.9 2016 -2.4 -0.9 0.0 -0.6
 (%) 7-800# 5-600# I II III IV")
22
Data Source: USDA-AMS, Compiled and Analysis by LMIC
Livestock Marketing Information Center

23
2014 Slaughter -17.9% (vs. 2013) -27.3% (vs. 2008-12)
2015-YTD Slaughter -15.7% (vs. 2014) -14.9% (vs ) Beef Cow Culling Rates 2005 = 7.9% = 9.4% = 11.3% 2013 = 10.5% 2014 = 8.8% Data Source: USDA-AMS & USDA-NASS Livestock Marketing Information Center
 -14.9% (vs ) Beef Cow Culling Rates = 7.9% = 9.4% = 11.3% 2013 = 10.5% 2014 = 8.8% Data Source: USDA-AMS & USDA-NASS. Livestock Marketing Information Center.")
24
Data Source: USDA/AMS

25
(still lowest level since 1962)
CHANGE IN BEEF COWS NUMBERS JANUARY 1, 2014 TO JANUARY 2015 (1000 Head) ― U.S. Total: National Cow Herd: 2.1% vs 2014 (still lowest level since 1962) Livestock Marketing Information Center Data Source: USDA-NASS
 ― U.S. Total: National Cow Herd: 2.1% vs (still lowest level since 1962) Livestock Marketing Information Center. Data Source: USDA-NASS.")
26
Data Source: USDA/NASS

27
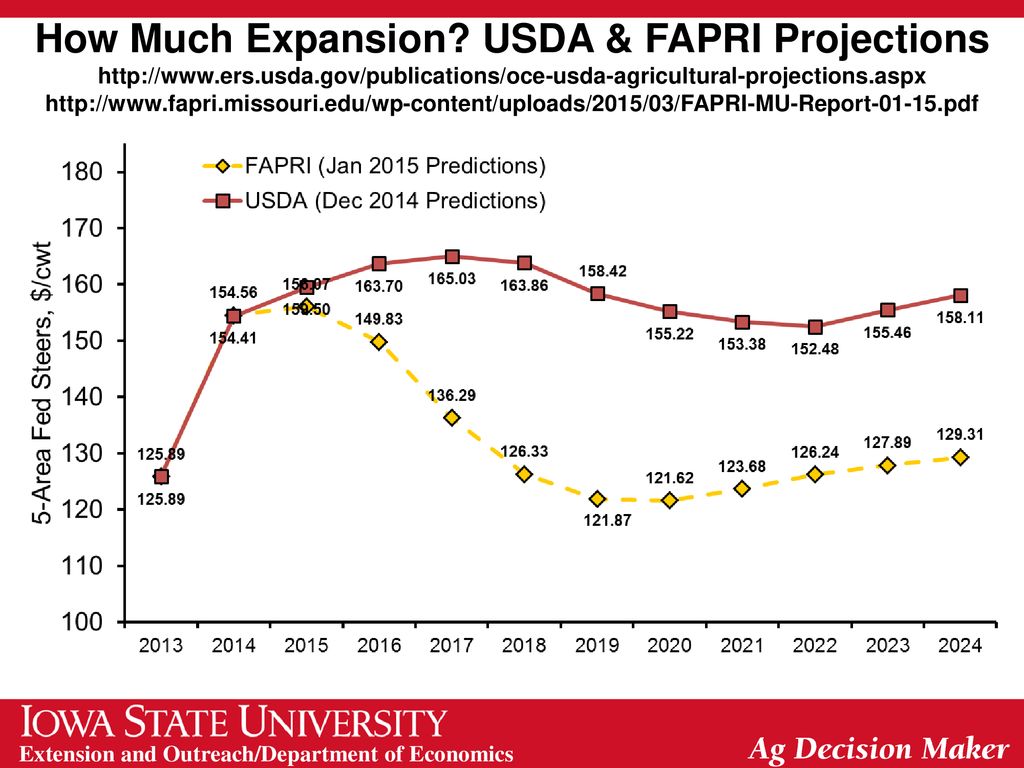
How Much Expansion? USDA & FAPRI Projections
Yr-over-Yr FAPRI 2015: +1.8% 2016: +3.1% 2017: +1.6% 2018: +0.7% : +2.6% Yr-over-Yr USDA 2015: -0.4% 2016: +0.2% 2017: +2.6% 2018: +4.2% : +16.5%

28
How Much Expansion? USDA & FAPRI Projections
29
How Much Expansion? USDA & FAPRI Projections
30
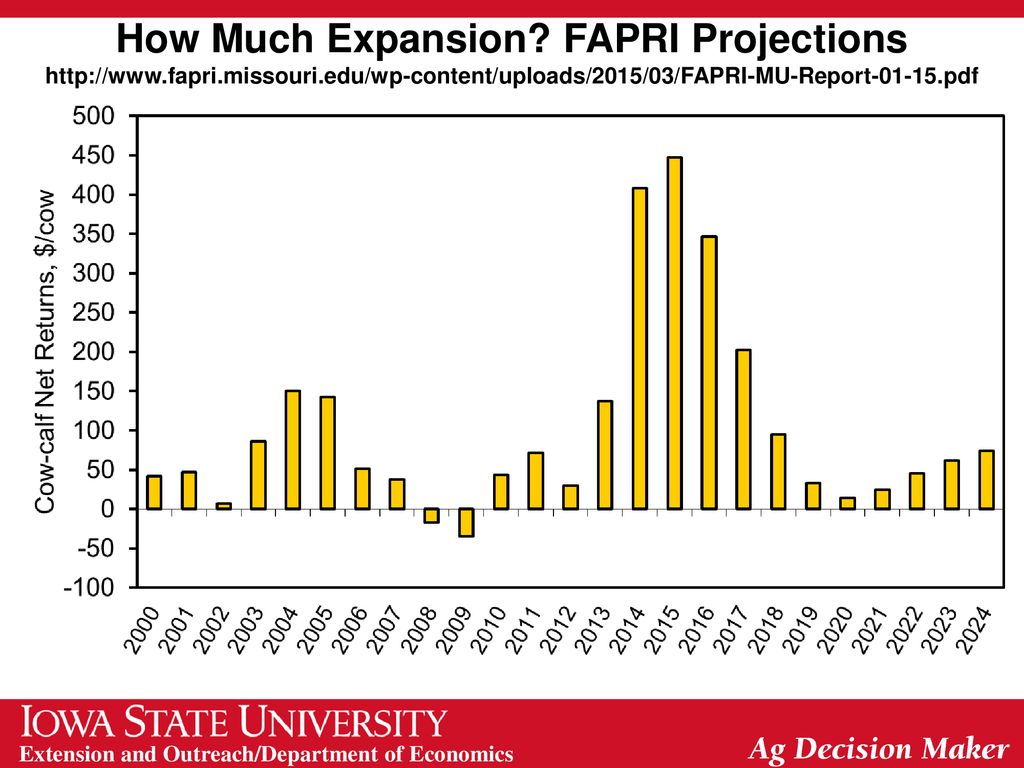
How Much Expansion? FAPRI Projections
31
Data Source: USDA/NASS

32
2013 Profits = -$100.77 2014 Profits = +$197.24 ~2015 Profits = -$91.18 ~Jan-Oct 2016 Profits = -$113.18 Oct-03 Profit = $378 Total Cost: = $920 ROI = 41% Oct-14 Profit = $269 Total Cost: = $1,857 ROI = 15%

33
U.S. Corn Supply and Use 2011 2012 2013 2014 2015 Area Planted
(mil. acres) 91.9 97.3 95.4 90.6 89.2 Yield (bu./acre) 147.2 123.1 158.1 171.0 166.8 Production (mil. bu.) 12,360 10,755 13,829 14,216 13,630 Beg. Stocks 1,128 989 821 1,232 1,851 Imports 29 160 36 25 Total Supply 13,517 11,904 14,686 15,472 15,506 Feed & Residual 4,557 4,315 5,036 5,250 5,300 Ethanol 5,000 4,641 5,134 5,200 Food, Seed, & Other 1,428 1,397 1,367 1,347 1,360 Exports 1,543 730 1,917 1,825 1,900 Total Use 12,528 11,083 13,454 13,622 13,760 Ending Stocks 1,746 Season-Average Price ($/bu.) 6.22 6.89 4.46 3.65 3.50 Source: USDA-WAOB 33 33
 Yield. (bu./acre) Production. (mil. bu.) 12, , , , ,630. Beg. Stocks. 1, ,232. 1,851. Imports Total Supply. 13, , , , ,506. Feed & Residual. 4,557. 4,315. 5,036. 5,250. 5,300. Ethanol. 5,000. 4,641. 5,134. 5,200. Food, Seed, & Other. 1,428. 1,397. 1,367. 1,347. 1,360. Exports. 1, ,917. 1,825. 1,900. Total Use. 12, , , , ,760. Ending Stocks. 1,746. Season-Average Price. ($/bu.) Source: USDA-WAOB")
34
Corn Planting Progress
Source: USDA-NASS

35
Corn Emergence Source: USDA-NASS

36
World Corn Production Source: USDA-WAOB 36 36

37
Corn Export Shifts Source: USDA-FAS

38
Corn Export Sales Source: USDA-FAS

39
Crude Oil Prices Sources: EIA and CME

40
Strength of the U.S. Dollar
Source: Federal Reserve

41
Corn Grind for Ethanol

42
Current Corn Futures 3.64 3.52 Source: CME Group, 6/1/2015

43
U.S. Soybean Supply and Use
2011 2012 2013 2014 2015 Area Planted (mil. acres) 75.0 77.2 76.8 83.7 84.6 Yield (bu./acre) 41.9 40.0 44.0 47.8 46.0 Production (mil. bu.) 3,094 3,042 3,358 3,969 3,850 Beg. Stocks 215 169 141 92 350 Imports 16 41 72 30 Total Supply 3,325 3,252 3,570 4,091 4,230 Crush 1,703 1,689 1,734 1,805 1,825 Seed & Residual 88 105 97 136 129 Exports 1,365 1,317 1,647 1,800 1,775 Total Use 3,155 3,111 3,478 3,741 3,729 Ending Stocks 500 Season-Average Price ($/bu.) 12.50 14.40 13.00 10.05 9.00 Source: USDA-WAOB 43 43
 Yield. (bu./acre) Production. (mil. bu.) 3,094. 3,042. 3,358. 3,969. 3,850. Beg. Stocks Imports Total Supply. 3,325. 3,252. 3,570. 4,091. 4,230. Crush. 1,703. 1,689. 1,734. 1,805. 1,825. Seed & Residual Exports. 1,365. 1,317. 1,647. 1,800. 1,775. Total Use. 3,155. 3,111. 3,478. 3,741. 3,729. Ending Stocks Season-Average Price. ($/bu.) Source: USDA-WAOB")
44
Soybean Planting Progress
Source: USDA-NASS

45
Soybean Emergence Source: USDA-NASS

46
World Soybean Production
Source: USDA-WAOB 46 46

47
Soybean Export Shifts Source: USDA-FAS

48
Soybean Export Shifts Source: USDA-FAS

49
Current Soybean Futures
9.96 8.69 Source: CME Group, 6/1/2015

50
2014/15 Crop Margins

51
2015/16 Crop Margins

52
Thoughts for 2015 and Beyond
Supply/demand concerns Demand has been weakening Outside markets have not helped Watching South American crop and U.S. planting progress Projected negative margins for 2014 and 2015 crops 2014/15 USDA 2015/16 Futures (6/1/15) Corn $3.65 $3.50 $3.64 $3.52 Soybeans $10.05 $9.00 $9.96 $8.69
 Corn. $3.65. $3.50. $3.64. $3.52. Soybeans. $ $9.00. $9.96. $8.69.")
53
Thank you for your time. Any questions. My web site: http://www. econ
Thank you for your time! Any questions? My web site: Iowa Farm Outlook: Ag Decision Maker:

Similar presentations


