Download presentation
Presentation is loading. Please wait.

1
Associate Professor/Crop Marketing Specialist
Ag Outlook Field to Finance Greene, Iowa Feb. 22, 2017 Chad Hart Associate Professor/Crop Marketing Specialist 1 1

2
U.S. Corn Supply and Use 2013 2014 2015 2016 2017 Area Planted
(mil. acres) 95.4 90.6 88.0 94.0 90.0 Yield (bu./acre) 158.1 171.0 168.4 174.6 170.8 Production (mil. bu.) 13,829 14,216 13,602 15,148 14,060 Beg. Stocks 821 1,232 1,731 1,737 2,320 Imports 36 32 67 55 50 Total Supply 14,686 15,479 15,401 16,940 16,430 Feed & Residual 5,040 5,280 5,131 5,600 5,500 Ethanol 5,124 5,200 5,206 5,350 5,325 Food, Seed, & Other 1,369 1,401 1,429 1,445 1,440 Exports 1,920 1,867 1,898 2,225 1,950 Total Use 13,454 13,748 13,664 14,620 14,215 Ending Stocks 2,215 Season-Average Price ($/bu.) 4.46 3.70 3.61 3.40 3.30 Source: USDA-WAOB , USDA-OCE 2017 2 2
 Yield. (bu./acre) Production. (mil. bu.) 13, , , , ,060. Beg. Stocks ,232. 1,731. 1,737. 2,320. Imports Total Supply. 14, , , , ,430. Feed & Residual. 5,040. 5,280. 5,131. 5,600. 5,500. Ethanol. 5,124. 5,200. 5,206. 5,350. 5,325. Food, Seed, & Other. 1,369. 1,401. 1,429. 1,445. 1,440. Exports. 1,920. 1,867. 1,898. 2,225. 1,950. Total Use. 13, , , , ,215. Ending Stocks. 2,215. Season-Average Price. ($/bu.) Source: USDA-WAOB , USDA-OCE")
3
U.S. Soybean Supply and Use
2013 2014 2015 2016 2017 Area Planted (mil. acres) 76.8 83.3 82.7 83.4 85.5 Yield (bu./acre) 44.0 47.5 48.0 52.1 47.9 Production (mil. bu.) 3,358 3,927 3,926 4,307 4,050 Beg. Stocks 141 92 191 197 420 Imports 72 33 24 25 30 Total Supply 3,570 4,052 4,140 4,528 4,500 Crush 1,734 1,873 1,886 1,930 1,935 Seed & Residual 107 146 122 128 130 Exports 1,638 1,842 1,936 2,050 2,100 Total Use 3,478 3,862 3,944 4,108 4,165 Ending Stocks 336 Season-Average Price ($/bu.) 13.00 10.10 8.95 9.50 9.35 Source: USDA-WAOB , USDA-OCE 2017 3 3
 Yield. (bu./acre) Production. (mil. bu.) 3,358. 3,927. 3,926. 4,307. 4,050. Beg. Stocks Imports Total Supply. 3,570. 4,052. 4,140. 4,528. 4,500. Crush. 1,734. 1,873. 1,886. 1,930. 1,935. Seed & Residual Exports. 1,638. 1,842. 1,936. 2,050. 2,100. Total Use. 3,478. 3,862. 3,944. 4,108. 4,165. Ending Stocks Season-Average Price. ($/bu.) Source: USDA-WAOB , USDA-OCE")
4
Corn Yields Top: 2016 Yield Bottom: Change from last year
Units: Bushels/acre Source: USDA-NASS

5
Soy Yields Top: 2016 Yield Bottom: Change from last year
Units: Bushels/acre Source: USDA-NASS

6
World Corn Production Source: USDA-WAOB 6 6

7
World Soybean Production
Source: USDA-WAOB 7 7

8
U.S. Meat Production & Prices
Source: USDA-WAOB 8 8

9
Corn Export Sales Source: USDA-FAS

10
Change in Corn Export Sales
Source: USDA-FAS

11
Soybean Export Sales Source: USDA-FAS

12
Change in Soybean Export Sales
Source: USDA-FAS

13
Strength of the U.S. Dollar
Source: Federal Reserve

14
Corn Grind for Ethanol

15
Current Corn Futures 4.03 3.95 3.57 Source: CME Group, 2/21/2017

16
Current Soybean Futures
9.99 9.81 9.60 Source: CME Group, 2/21/2017

17
2016/17 Crop Margins @ Actual Yields

18
2017/18 Crop Margins

19
Iowa Corn Prices vs. Costs

20
U.S. Meat Production & Prices
Source: USDA-WAOB 20 20

21
Hog Crush Margin The Crush Margin is the return after the pig, corn and soybean meal costs. Carcass weight: 200 pounds Pig price: 50% of 5 mth out lean hog futures Corn: 10 bushels per pig Soybean meal: 150 pounds per pig Source: ISU Extension

22
Data Source: USDA-ERS & USDA-FAS
Livestock Marketing Information Center

23
2013 = +$ [-$25.60 to +$24.57] 2014 = +$ [+$13.15 to +$107.25] 2015 = +$ [-$18.40 to +$26.25] 2016f = -$ [-$35.52 to +$32.92] 2017f = +$ [-$14.24 to +$22.50]
![2013 = +$6.21 [-$25.60 to +$24.57] 2014 = +$61.85 [+$13.15 to +$107.25] 2015 = +$7.93 [-$18.40 to +$26.25]](http://slideplayer.com/slide/14690119/90/images/23/2013+%3D+%2B%246.21+%5B-%2425.60+to+%2B%2424.57%5D+2014+%3D+%2B%2461.85+%5B%2B%2413.15+to+%2B%24107.25%5D+2015+%3D+%2B%247.93+%5B-%2418.40+to+%2B%2426.25%5D.jpg "2016f = -$1.03 [-$35.52 to +$32.92] 2017f = +$2.48 [-$14.24 to +$22.50]")
24
Source: USDA/AMS. * Steve Meyer, EMI.

25
U.S. Packing Capacity Under Construction
New (proposed) pork Fall 2016 Fall 2017 Fall 2018 Fall 2018 – TSF Doubled packing plants Daily Annual Pleasant Hope, MO 2,500 625,000 Windom, MN 4,000 1,000,000 Sioux City, IA 12,000 3,000,000 20,000 5,000,000 Coldwater, MI 10,000 2,500,000 Wright County, IA Total 6,500 1,625,000 28,500 7,125,000 38,500 9,625,000 46,500 11,625,000 Head per week 31,250 137,019 185,096 223,558 % of '15 avg = mil 1.4% 6.2% 8.4% 10.2 % % of '15 max = mil 1.2% 5.5% 7.4% 8.9 % July 19, 2016 Source: Steve Meyer. Published in National Hog Farmer Magazine.
 pork. Fall Fall Fall Fall 2018 – TSF Doubled. packing plants. Daily. Annual. Pleasant Hope, MO. 2, ,000. Windom, MN. 4,000. 1,000,000. Sioux City, IA. 12,000. 3,000, ,000. 5,000,000. Coldwater, MI. 10,000. 2,500,000. Wright County, IA. Total. 6,500. 1,625, ,500. 7,125, ,500. 9,625, , ,625,000. Head per week. 31, , , ,558. % of 15 avg = mil. 1.4% 6.2% 8.4% 10.2 % % of 15 max = mil. 1.2% 5.5% 7.4% 8.9 % July 19, Source: Steve Meyer. Published in National Hog Farmer Magazine.")
26
U.S. Pork Exports, Jan-Nov 2016
(Volume excluding by-products & variety meats) Year-to-Date Country 1,000 lbs Percent Mexico 16,874 1% Japan -55,946 -5% Canada 5,774 China (Mainland) 234,167 100% South Korea -92,915 -21% Australia 9,041 6% Hong Kong 25,740 23% Colombia 32 0% Philippines 3,603 5% Honduras 10,307 18% Dominican Republic 7,538 13% Chile 4,245 11% Guatemala 2,252 Panama 2,728 Other Countries -13,794 -8% Total 159,646 3% WASDE U.S.: 2015: 5,009 mil lbs : 5,179 (+3%) : 5,440 (+5%) Source: USDA/ERS
 Year-to-Date. Country. 1,000 lbs. Percent. Mexico. 16,874. 1% Japan. -55, % Canada. 5,774. China (Mainland) 234, % South Korea. -92, % Australia. 9,041. 6% Hong Kong. 25, % Colombia % Philippines. 3,603. 5% Honduras. 10, % Dominican Republic. 7, % Chile. 4, % Guatemala. 2,252. Panama. 2,728. Other Countries. -13, % Total. 159,646. 3% WASDE U.S.: 2015: 5,009 mil lbs 2016: 5,179 (+3%) 2017: 5,440 (+5%) Source: USDA/ERS.")
27
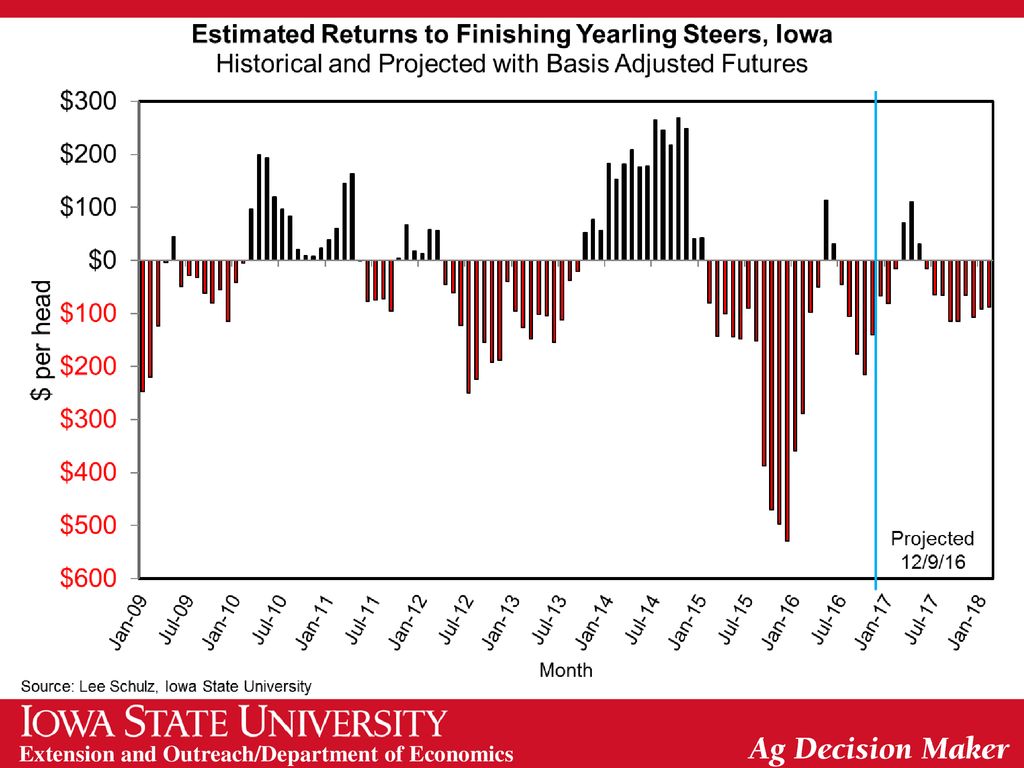
Cattle Crush Margin The Crush Margin is the return after the feeder steer and corn costs. Live weight: pounds Feeder weight: 750 pounds Corn: 50 bushels per head Source: ISU Extension

28
Top 10, 2015 to 2016 Head % TX +160,000 +3.9% OK +73,000 MO +61,000
+3.3% NE +96,000 +5.5% SD +79,000 +4.9% KS +4.3% MT -10,000 -0.7% KY +24,000 +2.4% IA +40,000 +4.4% FL +9,000 +1.0% Total 593,000 +3.5% Data Source: USDA/NASS

29
Projections for 11/6/15 9/2/16 9/27/16 11/1/16 2016 $300 $78 $15 -$30
2017 $86 $22 -$29 Data Source: USDA & LMIC, Compiled by LMIC Livestock Marketing Information Center

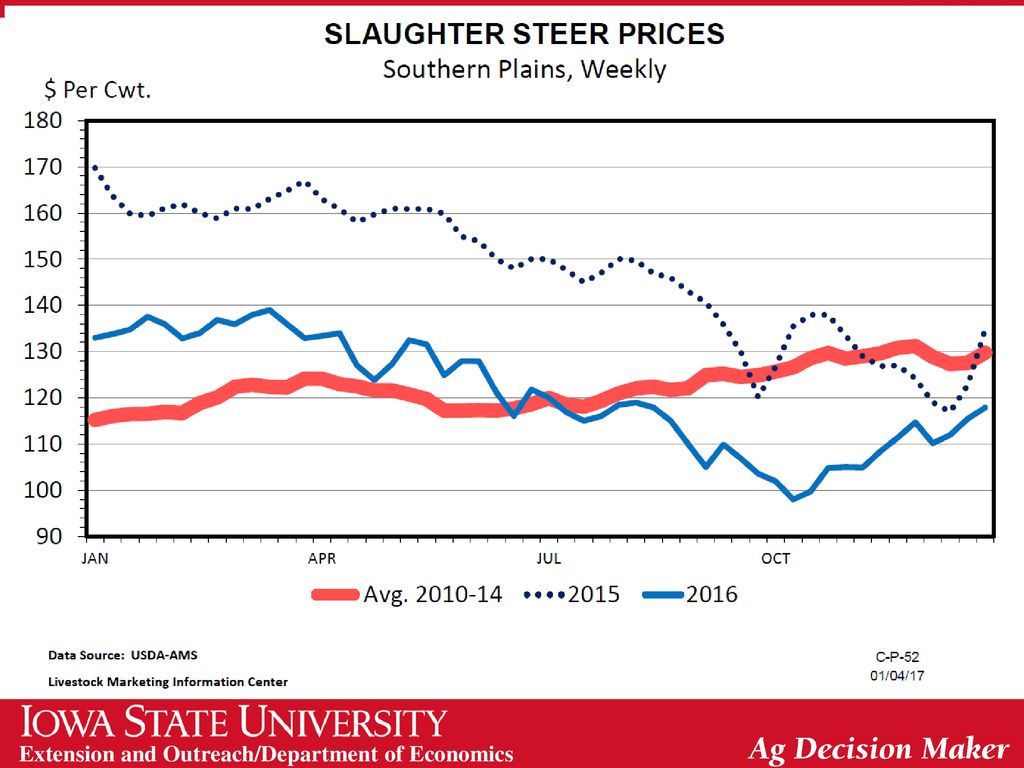
30
Data Source: USDA/AMS

33
U.S. Beef Exports, Jan-Nov 2016
(Volume excluding by-products & variety meats) Year-to-Date Country 1,000 lbs Percent Japan 98,130 19% South Korea 110,764 38% Mexico 27,796 8% Canada -18,363 -6% Hong Kong -17,692 China (Taiwan) 23,042 23% Netherlands -4,269 -12% Chile 1,871 Philippines -6,846 -23% Vietnam 4,920 45% Dominican Republic -4,239 -21% United Arab Emirates 1,150 Italy -3,000 -18% Guatemala 3,010 33% Other Countries 9,881 9% Total 226,153 11% WASDE U.S.: 2015: 2,265 mil lbs : 2,484 (+10%) : 2,630 (+6%) Source: USDA/ERS
 Year-to-Date. Country. 1,000 lbs. Percent. Japan. 98, % South Korea. 110, % Mexico. 27,796. 8% Canada. -18, % Hong Kong. -17,692. China (Taiwan) 23, % Netherlands. -4, % Chile. 1,871. Philippines. -6, % Vietnam. 4, % Dominican Republic. -4, % United Arab Emirates. 1,150. Italy. -3, % Guatemala. 3, % Other Countries. 9,881. 9% Total. 226, % WASDE U.S.: 2015: 2,265 mil lbs 2016: 2,484 (+10%) 2017: 2,630 (+6%) Source: USDA/ERS.")
34
U.S. Beef Imports, Jan-Nov 2016
(Volume excluding by-products & variety meats) Year-to-Date Country 1,000 lbs Percent Australia -477,829 -40% Canada 85,879 15% New Zealand -42,970 -7% Mexico 84,402 23% Nicaragua 7,903 8% Brazil -6,823 -5% Uruguay -17,579 -14% Costa Rica -12 0% Other Countries -2,509 -21% Total -369,538 -12% WASDE U.S.: 2015: 3,371 mil lbs : 3,021 (-10%) : 2,680 (-11%) Source: USDA/ERS
 Year-to-Date. Country. 1,000 lbs. Percent. Australia. -477, % Canada. 85, % New Zealand. -42, % Mexico. 84, % Nicaragua. 7,903. 8% Brazil. -6, % Uruguay. -17, % Costa Rica % Other Countries. -2, % Total. -369, % WASDE U.S.: 2015: 3,371 mil lbs 2016: 3,021 (-10%) 2017: 2,680 (-11%) Source: USDA/ERS.")
35
U.S. Meat Trade Source: USDA-WAOB 35 35

36
AVERAGE VALUES all farmland 1941−2016 $7,183 As of Nov 16 -5.9%

37
% Change in Nominal Iowa Farmland Values 1942-2016

38
Land Values by County, 2016

39
Percent Changes in Land Values from Nov 2015

40
Thank you for your time. Any questions. My web site: http://www2. econ
Thank you for your time! Any questions? My web site: Iowa Farm Outlook: Ag Decision Maker:

Similar presentations