Download presentation
Presentation is loading. Please wait.

1
Lecture: 13 World Population

2
The world population is the sum total of all living humans on Earth. Total population of the world is now approximately 7 billion. Six of Earth's seven continents are permanently inhabited on a large scale. Asia is the most populous continent Asia is the most populous continent, with its 4.2 billion inhabitants accounting for over 60% of the world population. The world's two most-populated countries alone, China and India, constitute about 37% of the world's population. Africa is the second-most-populated continent, with around 1 billion people, or 15% of the world's population. Europe's 733 million people make up 11% of the world's population, while the Latin American and Caribbean regions are home to around 600 million (9%).
..")
3
Northern America, primarily consisting of the United States and Canada, has a population of around 352 million (5%), and Oceania, the least-populated region, has about 35 million inhabitants (0.5%). Though it is not permanently inhabited by any fixed population, Antarctica has a small, fluctuating international population, based mainly in polar science stations. This population tends to rise in the summer months and decrease significantly in winter, as visiting researchers return to their home countries. Antarctica

4
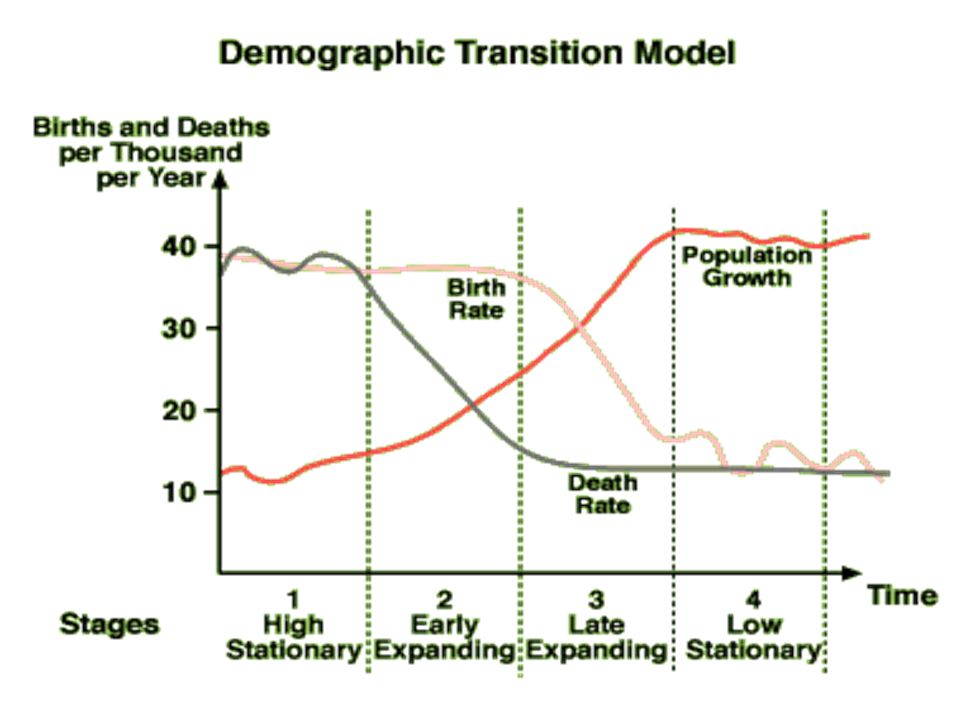
Demographic Transition Model This model is based on Population change over time The model was developed in 1929 by the American demographer Warren Thompson This model deals with Relationship between birth rates and death rates. According to this model Population growth rates for all countries can be divided into four stages

6
1 st Stage (pre demographic transition period): Characteristic of traditional agrarian societies, High birth rates and high and fluctuating death rate Little net population growth. Death rate fluctuates widely as diseases, epidemics, malnutrition, famine or other crisis situation occur sporadically on the landscape. Shortage of food and medicine are common. Increased susceptibility to natural hazards. Unstable economy Urbanization rate is minimum. Environmental degradation rate is also minimum. Main problem of this stage is underdevelopment. Spatial Configuration: pre-industrial Europe, Amazon and Congo forest areas

7
2 nd Stage (early demographic transition period) Death rate began declining as health and standard of living increased. Increase in permanent food supply and agricultural production. Diffusion and use of technology Availability of food and water Improvement in sanitation systems Increased use of medicine to control the spread of diseases. The population growth rates began increasing. GDP growth rate is low compare to population growth rate. This stage is called the ‘population Boom’ or ‘Population explosion’ stage. Spatial Configuration: Europe and North America just prior to industrial revolution, China from 1940 to 1970, Sub-Saharan Africa, Throughout much of Asia, Middle east, Latin America etc.

8
3 rd Stage (late demographic transition period): The birth rate declined with urbanization and economic change resulting in a lower rate of population growth. The death rate declined due to the use modern medical technology. Population growth rate is low compare to GDP growth rate. Spatial Configuration: China, industrialized nation of the North.

9
4 th Stage (post demographic transition period): Low birth rates, low death rates, and low rates of natural increase. In some cases the population declines or zero population growth. This is the stage associated with high economic development. Urbanization and industrialization rates are high Environmental pollution and degradation rates are high Spatial Configuration: industrialized and developed nation of the North.

10
POPULATION PYRAMIDS

11
Objectives WHAT is a population pyramid? HOW to read a population pyramid? Recognise SHAPES of population pyramids. IMPORTANCE of population pyramids.

12
What is a population pyramid? It is a diagram that gives information about the proportion of males and females in each age group. Also shows: - proportion of young people (0 -14 ) - proportion of working people (15 – 59) - proportion of elderly people (60+)
 - proportion of working people (15 – 59) - proportion of elderly people (60+).")
13
What is a population pyramid? Vertical Axis - Age Groups Horizontal Axis – Percentage / number Young dependents Working population Elderly dependents

14
How to read a population pyramid? Read the title e.g. country or city or racial group Comment on general shape of the pyramid Note the proportion of people in various age groups Note the sex ratio Interpret the data

15
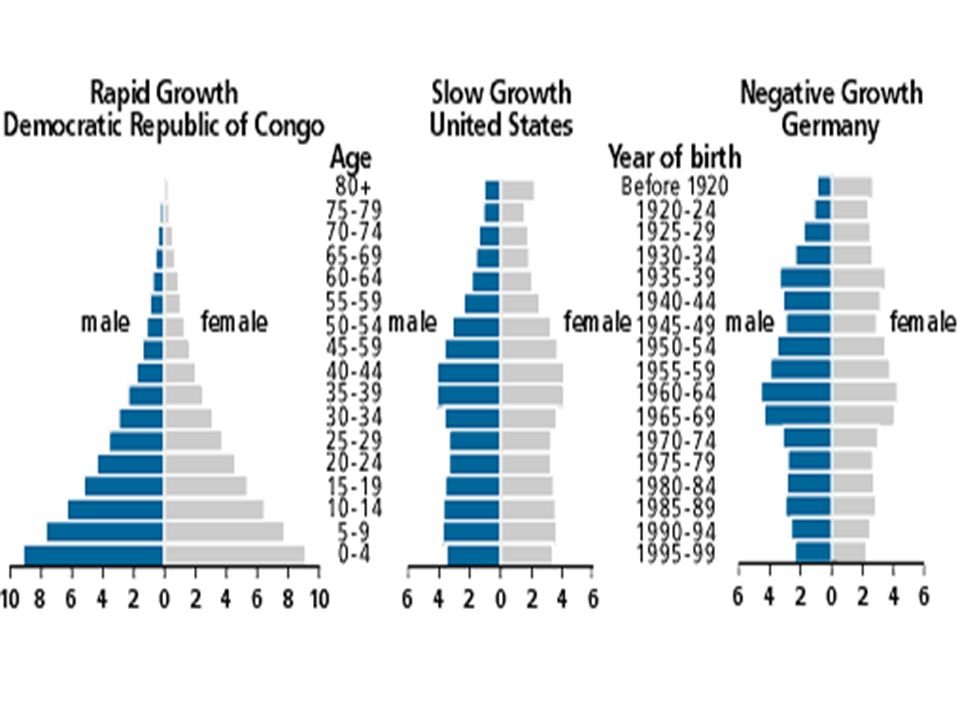
Types of Population Pyramid 1. Triangular-shaped 2. Beehive-shaped Pyramid 3. Rectangular-shaped Pyramid Shape of pyramids is controlled by –births, –deaths, & –migrations.

16
Triangular-shaped Pyramid (Broad-based Pyramid)
")
17
Broad-based Pyramid Title: India, 2000 Shape: Broad Base - high birth rates Narrow Top - small elderly pop - high death rate Proportion: - Large proportion of young - high young dependency ratio Sex Ratio: Balance pyramid - Balance sex ratio

18
Indonesia 2000 Malaysia 2000

19
Beehive-shaped Pyramid

20
Title: Singapore, 2000 Shape: Rocket-shaped / Narrow Base – Low Birth Rates, Slow pop growth Proportion: Large proportion of working population, 15-59 yr old - large group of economically active pop Sex Ratio: Balanced pyramid

21
Hong Kong 2000

22
Rectangular-shaped Pyramid

23
Rectangular Pyramid Title: Netherlands, 2000 Shape: Rectangular-shaped Broad Base - High Birth Rates - Life-expectancy is high e.g. 80+ - Low death rates Proportion: Bars of equal length - Balance Proportion Sex Ratio: Balance pyramid - Balance Sex Ratio

24
UK 2000 Netherlands 2000

26
Population Pyramids in Transition

27
Each pyramid tells a story about the past, present & future of a country & its people.

28
Importance of Population Pyramids Policy Planning ~ future housing estates ~ future schools ~ future jobs Comparison with other countries ~ developed (US) vs developing (India)
 vs developing (India)")
29
Population Pyramids of the world http://populationpyramid.net/

Similar presentations


 Mr Elliott SSOT.>")


>")
