Download presentation
Presentation is loading. Please wait.

1
The Physical Earth

15
The World Has Made Impressive Progress in the Last Century Food production vs. population growth. Science and technology Poverty reduction Disease eradication and treatment Life expectancy increased More children attend school Adult illiteracy reduced. Rising incomes Economic and political freedom Globalization Food production vs. population growth. Science and technology Poverty reduction Disease eradication and treatment Life expectancy increased More children attend school Adult illiteracy reduced. Rising incomes Economic and political freedom Globalization

16
However, The World Is Growing in Unsustainable Ways Income inequalities Demographic changes: POPULATION Growth Deterioration in environmental conditions Climate change Conflicts. WAR Financial crises

17
Four Key Forces Will Be Shaping The World In the Next 50 years. Demographic Transition Urban Transition Income Growth Scientific and technological innovation Source: WDR 2003 Demographic Transition Urban Transition Income Growth Scientific and technological innovation Source: WDR 2003

18
Will the Humanity Be Able to Handle Global development Challenges ? 1.3 B on Fragile Ecosystems Urban population doubles Equitable Development/Migration Growth In Poor Countries Renewable Natural Resources Migrate OutLanguish Engine of growth Poverty, Crime and Social Stress Shared growth Conflicts Socially and Environ- Mentally Sustainable Destabilizing Social/ Environmental stress Sustainable Management Depleted

19
World Population 6.5 Billion TOP 10 1. China 1,306,313,812 2. India 1,080,264,388 3. United States 295,734,134 4. Indonesia 241,973,879 5. Brazil 186,112,794 7. Pakistan 162,419,946 6. Bangladesh 144,319,628 8. Russia 143,420,309 9. Nigeria 128,771,988 10. Japan 127,417,244 TOP 10 1. China 1,306,313,812 2. India 1,080,264,388 3. United States 295,734,134 4. Indonesia 241,973,879 5. Brazil 186,112,794 7. Pakistan 162,419,946 6. Bangladesh 144,319,628 8. Russia 143,420,309 9. Nigeria 128,771,988 10. Japan 127,417,244

20
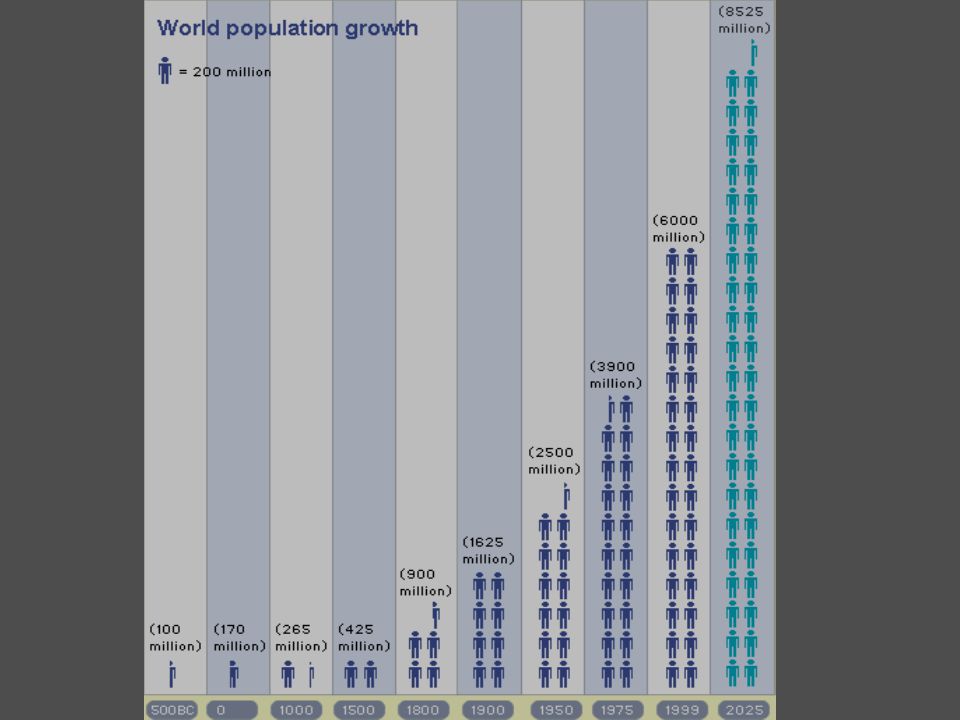
World Population Milestones Source: United Nations Population Division * 1 billion in 1804 * 2 billion in 1927(123 years later) * 3 billion in 1960(33 years later) * 4 billion in 1974(14 years later) * 5 billion in 1987(13 years later) * 6 billion in 1999(12 years later) Source: United Nations Population Division * 1 billion in 1804 * 2 billion in 1927(123 years later) * 3 billion in 1960(33 years later) * 4 billion in 1974(14 years later) * 5 billion in 1987(13 years later) * 6 billion in 1999(12 years later)
 * 3 billion in 1960(33 years later) * 4 billion in 1974(14 years later) * 5 billion in 1987(13 years later) * 6 billion in 1999(12 years later) Source: United Nations Population Division * 1 billion in 1804 * 2 billion in 1927(123 years later) * 3 billion in 1960(33 years later) * 4 billion in 1974(14 years later) * 5 billion in 1987(13 years later) * 6 billion in 1999(12 years later)")
22
Total Population of the World by Decade, 1950–2050 Year Total world population Ten-year growth rate (%) 19502,556,000,053 18.9% 19603,039,451,023 22.0 19703,706,618,163 20.2 19804,453,831,714 18.5 19905,278,639,789 15.2 20006,082,966,429 12.6 20106,848,932,929 10.7 20207,584,821,144 8.7 20308,246,619,341 7.3 20408,850,045,889 5.6 20509,346,399,468 — Year Total world population Ten-year growth rate (%) 19502,556,000,053 18.9% 19603,039,451,023 22.0 19703,706,618,163 20.2 19804,453,831,714 18.5 19905,278,639,789 15.2 20006,082,966,429 12.6 20106,848,932,929 10.7 20207,584,821,144 8.7 20308,246,619,341 7.3 20408,850,045,889 5.6 20509,346,399,468 —
 19502,556,000, % 19603,039,451, 19703,706,618, 19804,453,831, 19905,278,639, 20006,082,966, 20106,848,932, 20207,584,821, 20308,246,619, 20408,850,045, 20509,346,399,468 — Year Total world population Ten-year growth rate (%) 19502,556,000, % 19603,039,451, 19703,706,618, 19804,453,831, 19905,278,639, 20006,082,966, 20106,848,932, 20207,584,821, 20308,246,619, 20408,850,045, 20509,346,399,468 —")
23
Causes and rates of change The population of any place changes over time. There are three main causes of population change: * Births - usually measured using the birth rate (number of live births per 1000 of the population) * Deaths - usually measured using the death rate (number of deaths per 1000 of the population) * Migration - the movement of people in and out of an area The population of any place changes over time. There are three main causes of population change: * Births - usually measured using the birth rate (number of live births per 1000 of the population) * Deaths - usually measured using the death rate (number of deaths per 1000 of the population) * Migration - the movement of people in and out of an area
 * Deaths - usually measured using the death rate (number of deaths per 1000 of the population) * Migration - the movement of people in and out of an area The population of any place changes over time. There are three main causes of population change: * Births - usually measured using the birth rate (number of live births per 1000 of the population) * Deaths - usually measured using the death rate (number of deaths per 1000 of the population) * Migration - the movement of people in and out of an area.")
24
Rate of Change Births and deaths are natural causes of population change. The difference between the birth rate and the death rate of a country or place is called the natural increase, and you calculate the natural increase by subtracting the death rate per 1000 population from the birth rate per 1000 population: natural increase = birth rate - death rate. The rate of natural increase or growth rate of a population is given as a percentage, calculated by dividing the natural increase by 10. If for example the birth rate / 1000 pop = 14, and the death rate / 1000 pop = 8, then growth rate = 14 - 8 = 6 / 1000, or 0.6%. Births and deaths are natural causes of population change. The difference between the birth rate and the death rate of a country or place is called the natural increase, and you calculate the natural increase by subtracting the death rate per 1000 population from the birth rate per 1000 population: natural increase = birth rate - death rate. The rate of natural increase or growth rate of a population is given as a percentage, calculated by dividing the natural increase by 10. If for example the birth rate / 1000 pop = 14, and the death rate / 1000 pop = 8, then growth rate = 14 - 8 = 6 / 1000, or 0.6%.

25
Population will decline if death rate is greater than birth rate Population will increase if death rate is less than birth rate The table shows comparative birth rates, death rates and population-growth rates in some LEDC and MEDC countries: Population will decline if death rate is greater than birth rate Population will increase if death rate is less than birth rate The table shows comparative birth rates, death rates and population-growth rates in some LEDC and MEDC countries:

26
Population Definitions The crude birth rate is the number of births per 1000 people in a year. The crude death rate is the number of deaths per 1000 people in a year. The natural increase is the number of extra people (birth rate minus the death rate). This is usually given as a percentage. The infant mortality rate is the annual number of deaths of infants less than one year old per 1,000 live births. The crude birth rate is the number of births per 1000 people in a year. The crude death rate is the number of deaths per 1000 people in a year. The natural increase is the number of extra people (birth rate minus the death rate). This is usually given as a percentage. The infant mortality rate is the annual number of deaths of infants less than one year old per 1,000 live births.
. This is usually given as a percentage. The infant mortality rate is the annual number of deaths of infants less than one year old per 1,000 live births. The crude birth rate is the number of births per 1000 people in a year. The crude death rate is the number of deaths per 1000 people in a year. The natural increase is the number of extra people (birth rate minus the death rate). This is usually given as a percentage. The infant mortality rate is the annual number of deaths of infants less than one year old per 1,000 live births..")
27
Differences Between Developed and Developing Countries Developing countries have high birth rates because: * Many parents will have a lot of children in the expectation that some will die because of the high infant mortality rate * Large families can help in looking after the farm * The children will be able to look after their parents if they become old or sick; there may not be a old age pension scheme * There may be a shortage of family planning facilities and advice Developing countries have high birth rates because: * Many parents will have a lot of children in the expectation that some will die because of the high infant mortality rate * Large families can help in looking after the farm * The children will be able to look after their parents if they become old or sick; there may not be a old age pension scheme * There may be a shortage of family planning facilities and advice Developed countries have low birth rates because: * It is expensive to look after large families * More women prefer to concentrate on their careers * Increasing sexual equality has meant women have more control over their own fertility * There is a ready availability of contraception and family planning advice Developed countries have low birth rates because: * It is expensive to look after large families * More women prefer to concentrate on their careers * Increasing sexual equality has meant women have more control over their own fertility * There is a ready availability of contraception and family planning advice

28
What continent has the highest birth rates?

29
Death Rates Developing countries have high death rates * Dirty, unreliable water supplies * Poor housing conditions * Poor access to medical services * Endemic disease in some countries * Diets that are short in calories and/or protein Developing countries have high death rates * Dirty, unreliable water supplies * Poor housing conditions * Poor access to medical services * Endemic disease in some countries * Diets that are short in calories and/or protein Developed countries have low death rates because… * Good housing conditions * Safe water supplies * More than enough food to eat * Advanced medical services Some developed countries have a high death rate as they have an ageing population with many older people.

30
Which continent has the highest death rate?

31
Developing countries have high rates of natural increase as their birth rates are high, and although their death rates are also high there is usually a big gap between the two figures. Malawi's natural increase is 30 per year for every 1,000 people. This is calculated from the birth rate of 51 minus the death rate of 21 (51 - 21 = 30). Developed countries have both a low death rate and low birth rate, with only a small gap between the two. Norway's natural increase is 3 per year for every 1,000 (14 - 10 = 3). Developing countries have high rates of natural increase as their birth rates are high, and although their death rates are also high there is usually a big gap between the two figures. Malawi's natural increase is 30 per year for every 1,000 people. This is calculated from the birth rate of 51 minus the death rate of 21 (51 - 21 = 30). Developed countries have both a low death rate and low birth rate, with only a small gap between the two. Norway's natural increase is 3 per year for every 1,000 (14 - 10 = 3).
. Developed countries have both a low death rate and low birth rate, with only a small gap between the two. Norway s natural increase is 3 per year for every 1,000 ( = 3). Developing countries have high rates of natural increase as their birth rates are high, and although their death rates are also high there is usually a big gap between the two figures. Malawi s natural increase is 30 per year for every 1,000 people. This is calculated from the birth rate of 51 minus the death rate of 21 ( = 30). Developed countries have both a low death rate and low birth rate, with only a small gap between the two. Norway s natural increase is 3 per year for every 1,000 ( = 3)..")
32
Infant Mortality The infant mortality rates are higher in developing countries. The reasons for these higher rates are that developing countries often have health services and medical facilities.

33
Term Malawi Norway Crude birth rate51 per thousand 14 per thousand Crude death rate21 per thousand 10 per thousand Natural increase2.8% 0.3% Infant mortality rate134 deaths per 5.2 deaths per thousand births thousand births Term Malawi Norway Crude birth rate51 per thousand 14 per thousand Crude death rate21 per thousand 10 per thousand Natural increase2.8% 0.3% Infant mortality rate134 deaths per 5.2 deaths per thousand births thousand births A DEVELOPING COUNTRY COMPARED TO A DEVELOPED COUNTRY

35
The Demographic Transition Model The demographic transition model shows population change over time. The model studies how birth rate and death rate affect the total population of a country. It is divided into four stages: * Stage one - the total population is low but it is balanced due to high birth rates and high death rates. * Stage two - the total population is starting to rise as death rates start to fall, but birth rates remain quite high. * Stage three - the total population is still rising rapidly, but the gap between birth and death rates narrows. Now the natural increase is high. * Stage four - the total population is high, but it is balanced due to a low birth rate and a low death rate. The demographic transition model shows population change over time. The model studies how birth rate and death rate affect the total population of a country. It is divided into four stages: * Stage one - the total population is low but it is balanced due to high birth rates and high death rates. * Stage two - the total population is starting to rise as death rates start to fall, but birth rates remain quite high. * Stage three - the total population is still rising rapidly, but the gap between birth and death rates narrows. Now the natural increase is high. * Stage four - the total population is high, but it is balanced due to a low birth rate and a low death rate.

36
Population Structure The population structure of a country is how it is made up of people of different ages, and of males and females. The common method to show the structure is by a population pyramid. This diagram is made up by putting two bar graphs (one for male, one for female) side by side. From this you can read off what percentage of a population is of a certain gender and age range. In the example below 4% of the population are females aged between 25 and 29.
 side by side. From this you can read off what percentage of a population is of a certain gender and age range. In the example below 4% of the population are females aged between 25 and 29..")
37
Population Structure - Developing Countries This population pyramid is wide at the base, which means there are a large proportion of young people in the country. It tapers very quickly as you go up into the older age groups, and is narrow at the top. This shows that a very small proportion of people are elderly.

38
Population Structure - Developed Countries This shape is typical of a developed country. It is narrow at the base, wider in the middle, and stays quite wide until the very top, as there is a sizable percentage of older people. Note that there are more old women than men. Italy and Japan have population structures that are of this shape.

39
Population Pyramid of the Canadian Population by Age and Sex, 1996

41
Key things to know about population pyramids: * The shape of a population pyramid is very important and can tell us a lot about the people living in a particular country or place. * The shape of a population pyramid gives us information about birth and death rates as well as life expectancy. * A population pyramid tells us how many dependants there are living in an area. There are two groups of dependants; young dependants (aged below 15) and elderly dependants (aged over 65). * Those of working age are classed as economically active. Dependants rely upon the economically active for economic support. * Many Developing countries have a high number of young dependants, whilst many Developed countries have a growing number of elderly dependants. * The shape of a population pyramid is very important and can tell us a lot about the people living in a particular country or place. * The shape of a population pyramid gives us information about birth and death rates as well as life expectancy. * A population pyramid tells us how many dependants there are living in an area. There are two groups of dependants; young dependants (aged below 15) and elderly dependants (aged over 65). * Those of working age are classed as economically active. Dependants rely upon the economically active for economic support. * Many Developing countries have a high number of young dependants, whilst many Developed countries have a growing number of elderly dependants.
 and elderly dependants (aged over 65). * Those of working age are classed as economically active. Dependants rely upon the economically active for economic support. * Many Developing countries have a high number of young dependants, whilst many Developed countries have a growing number of elderly dependants. * The shape of a population pyramid is very important and can tell us a lot about the people living in a particular country or place. * The shape of a population pyramid gives us information about birth and death rates as well as life expectancy. * A population pyramid tells us how many dependants there are living in an area. There are two groups of dependants; young dependants (aged below 15) and elderly dependants (aged over 65). * Those of working age are classed as economically active. Dependants rely upon the economically active for economic support. * Many Developing countries have a high number of young dependants, whilst many Developed countries have a growing number of elderly dependants..")
42
* A population pyramid that is very triangular (eg Mozambique in 2000) illustrates a population with a high number of young dependants and a low life expectancy. * A population pyramid that has fairly straight sides (more like a barrel) illustrates a population with a falling birth rate and a rising life expectancy. * Over time, as a country develops, the shape of its population pyramid changes from a triangular shape to a barrel-like shape with straighter edges. * Places that are experiencing an ageing population and a very low birth rate may have a population structure that looks a little like an upside-down pyramid. * A population pyramid that is very triangular (eg Mozambique in 2000) illustrates a population with a high number of young dependants and a low life expectancy. * A population pyramid that has fairly straight sides (more like a barrel) illustrates a population with a falling birth rate and a rising life expectancy. * Over time, as a country develops, the shape of its population pyramid changes from a triangular shape to a barrel-like shape with straighter edges. * Places that are experiencing an ageing population and a very low birth rate may have a population structure that looks a little like an upside-down pyramid.
 illustrates a population with a falling birth rate and a rising life expectancy. * Over time, as a country develops, the shape of its population pyramid changes from a triangular shape to a barrel-like shape with straighter edges. * Places that are experiencing an ageing population and a very low birth rate may have a population structure that looks a little like an upside-down pyramid. * A population pyramid that is very triangular (eg Mozambique in 2000) illustrates a population with a high number of young dependants and a low life expectancy. * A population pyramid that has fairly straight sides (more like a barrel) illustrates a population with a falling birth rate and a rising life expectancy. * Over time, as a country develops, the shape of its population pyramid changes from a triangular shape to a barrel-like shape with straighter edges. * Places that are experiencing an ageing population and a very low birth rate may have a population structure that looks a little like an upside-down pyramid..")
Similar presentations


 and Immigration (people.>")


