Download presentation
Presentation is loading. Please wait.

1
Bell Ringer Find the median of the following set of numbers.

2
Announcements Quiz on Wednesday Relay for Life Donations due Today

3
Homework Check

6
Section 13.4 Box and Whisker Plots R drive > Key > April 20_24 > 4_22__13.4 Box and Whisker Plot File > Save As > P drive > Math > April 20_24 > 4_22__13.4 Box and Whisker Plot

7
Vocabulary Box – and – Whisker Plot- Uses a number line to show the distribution of a set of data

8
Notes A box – and – whisker plot divides a set of data into four parts using the median and quartiles. A box is drawn around the quartile values Whiskers extend from each quartile to the minimum and maximum values that are not outliers.

9
Example 1 Draw a Box – and – Whisker Plot

10
Example 2 Draw a Box – and – Whisker Plot

11
Example 3 Draw a Box – and – Whisker Plot The projected number of employees in 2010 in some of the fastest – growing occupations is shown below. Use the data in the table to draw a box – and – whisker plot for the fastest – growing jobs.

12
Notes Every part of the box – and – whisker plot is 25%. It uses 5 numbers to separate the data into four parts: The Minimum Value The Lower Quartile The Median The Upper Quartile The Maximum Value

13
Notes A long whisker or box indicates that the data have a greater range. The values of the data are spread out. A short whisker or box indicates the data have a lesser range. The values of the data in that part are concentrated.

14
Example 4 Interpret Data The number of chart hits for the top female groups in the U.S. are displayed. (a) What percent of the groups had at least 18 chart hits? (b) What does the length of the box tell about the data? Length of the whisker?
 What percent of the groups had at least 18 chart hits. (b) What does the length of the box tell about the data. Length of the whisker .")
15
Example 5 Interpret Data The number of Calories in one serving of various muffins are displayed in the box – and – whisker plot below. (A) What percent of the muffins have more than 275 Calories per muffin? (B) What does the length of the box tell about the data? Length of the whiskers?
 What percent of the muffins have more than 275 Calories per muffin. (B) What does the length of the box tell about the data. Length of the whiskers .")
16
Example 6 Compare Data

17
Example 7 Compare Data

18
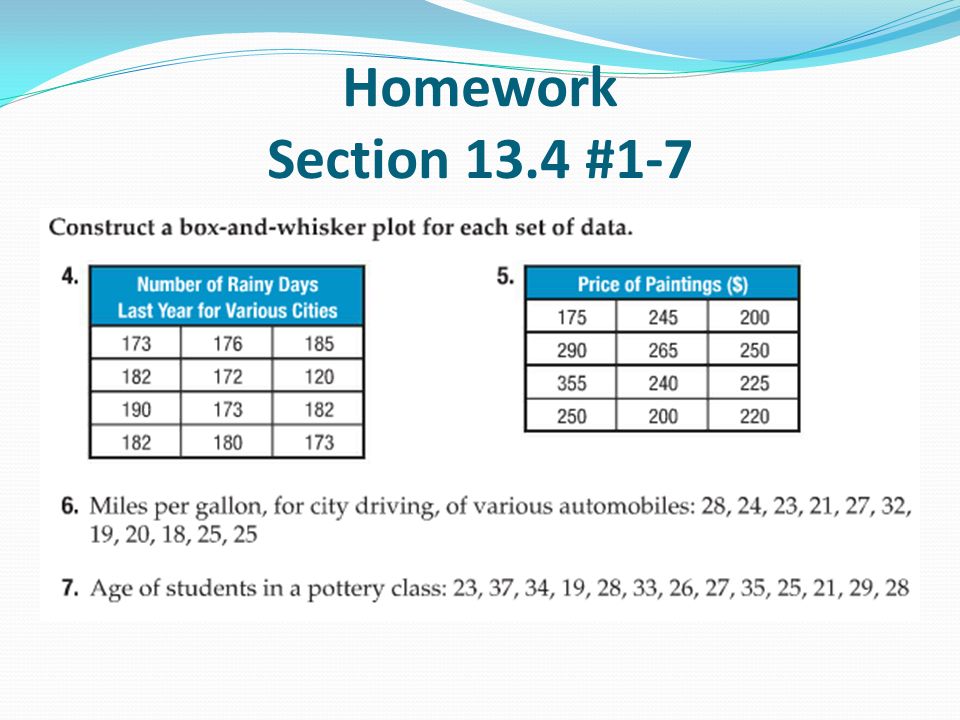
Homework Section 13.4 # 1-7

Similar presentations


 on a CD are listed below. Make a box-and-whisker plot of the song.>")


