Download presentation
Presentation is loading. Please wait.

1
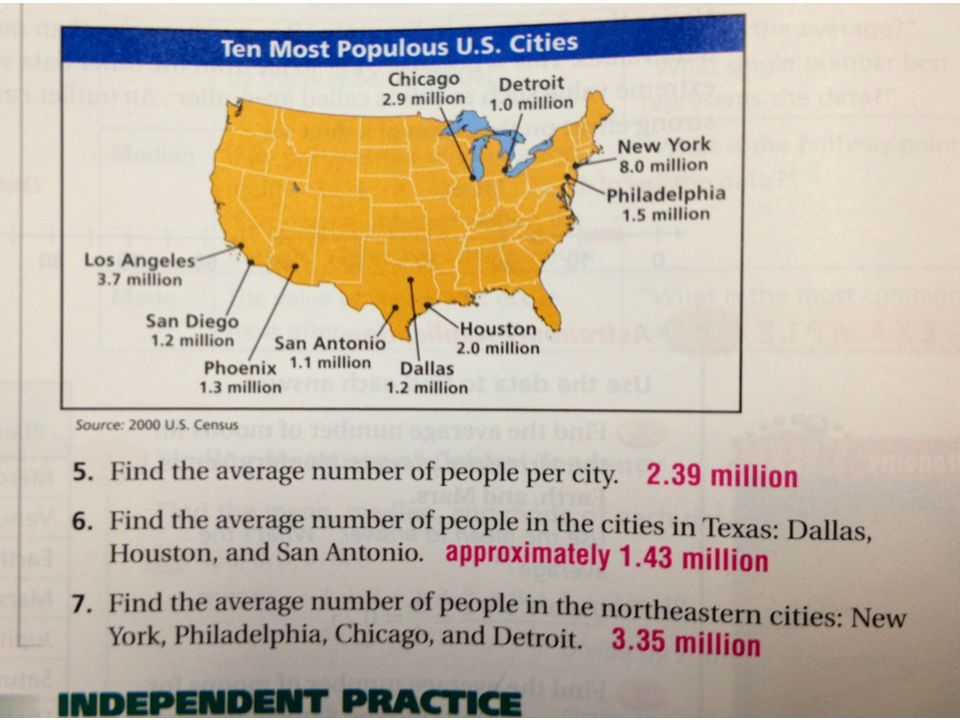
Page 186 #1-7 ANSWERS

3
Pre-Algebra 4-4 Variability Student Learning Goal Chart Lesson Reflection for Chapter 4 Section 4

4
Pre-Algebra 4-4 Variability Pre-Algebra Learning Goal Students will understand collecting, displaying, & analyzing data.

5
Pre-Algebra 4-4 Variability Students will understand collecting, displaying & analyzing data by being able to do the following: Learn to identify populations & recognize biased samples (4-1) Learn to organize data in tables and stem-and-leaf plots (4-2) Learn to find Euler circuits (14-6) Learn to find and use Hamiltonian circuits (14-7) Learn to find appropriate measures of central tendency (4-3) Learn to find measures of variability (4-4)
 Learn to organize data in tables and stem-and-leaf plots (4-2) Learn to find Euler circuits (14-6) Learn to find and use Hamiltonian circuits (14-7) Learn to find appropriate measures of central tendency (4-3) Learn to find measures of variability (4-4)")
6
Pre-Algebra 4-4 Variability Today’s Learning Goal Assignment Learn to find measures of variability.

7
Pre-Algebra 4-4 Variability Pre-Algebra HW Page 190 #1-6

8
Pre-Algebra 4-4 Variability 4-4 Variability Pre-Algebra Warm Up Warm Up Problem of the Day Problem of the Day Lesson Presentation Lesson Presentation

9
Pre-Algebra 4-4 Variability Warm Up 1. Order the test scores from least to greatest: 89, 93, 79, 87, 91, 88, 92. 2. Find the median of the test scores. Find the difference. 79, 87, 88, 89, 91, 92, 93 89 16.1 Pre-Algebra 4-4 Variability 166.9 0.8 3.4 3. 17 – 0.9 4. 8.4 – 7. 6 5. 9.1 – 5.7 6. 190.3 – 23.4

10
Pre-Algebra 4-4 Variability Problem of the Day What are the possible values for x in the data set 22, 12, 33, 25, and x if the median is 25? any number greater than or equal to 25

11
Pre-Algebra 4-4 Variability Today’s Learning Goal Assignment Learn to find measures of variability.

12
Pre-Algebra 4-4 Variability Vocabulary variability range quartile box-and-whisker plot

13
Pre-Algebra 4-4 Variability The table below summarizes a veterinarian’s records for kitten litters born in a given year. Litter Size23456 Number of Litters 168111 While central tendency describes the middle of a data set, variability describes how spread out the data is. The range of a data set is the largest value minus the smallest value. The range is affected by outliers, so another measure is often used. Quartiles divide a data set into four equal parts. The third quartile minus the first quartile is the range for the middle half of the data.

14
Pre-Algebra 4-4 Variability Litter Size23456 Number of Litters 168111 The range of a data set is the largest value minus the smallest value. For the kitten data, the range is 6 — 2 = 4. The range is affected by outliers, so another measure is often used. Quartiles divide a data set into four equal parts. The third quartile minus the first quartile is the range for the middle half of the data. Kitten Data 2 3 3 3 3 3 3 4 4 4 4 4 4 4 4 5 5 5 5 5 5 5 5 5 5 5 6 Lower halfUpper half First quartile: 3 median of lower half Third quartile: 5 median of upper half Median: 4 (second quartile)
.")
15
Pre-Algebra 4-4 Variability Find the range and the first and third quartiles for the data set. Additional Example 1A: Finding Measures of Variability A. 15, 83, 75, 12, 19, 74, 21 12 15 19 21 74 75 83 Order the values. range: 83 – 12 = 71 first quartile: 15 third quartile: 75

16
Pre-Algebra 4-4 Variability Find the range and the first and third quartiles for the data set. Try This: Example 1A A. 25, 38, 66, 19, 91, 47, 13 13 19 25 38 47 66 91 Order the values. range: 91 – 13 = 78 first quartile: 19 third quartile: 66

17
Pre-Algebra 4-4 Variability Find the range and the first and third quartiles for the data set. Additional Example 1B: Finding Measures of Variability B. 75, 61, 88, 79, 79, 99, 63, 77 61 63 75 77 79 79 88 99 range: 99 – 61 = 38 first quartile: = 69 63 + 75 2 third quartile: = 83.5 79 + 88 2 Order the values.

18
Pre-Algebra 4-4 Variability B. 45, 31, 59, 49, 49, 69, 33, 47 31 33 45 47 49 49 59 69 Order the values. range: 69 – 31 = 38 Find the range and the first and third quartiles for the data set. Try This: Example 1B first quartile: = 39 33 + 45 2 third quartile: = 54 49 + 59 2

19
Pre-Algebra 4-4 Variability 1 2 3 4 5 6 7 8 9 A box-and-whisker plot shows the distribution of data. The middle half of the data is represented by a “box” with a vertical line at the median. The lower fourth and upper fourth quarters are represented by “whiskers” that extend to the smallest and largest values. First quartile Third quartile Median

20
Pre-Algebra 4-4 Variability Use the given data to make a box-and-whisker plot: 21, 25, 15, 13, 17, 19, 19, 21 Additional Example 2: Making a Box-and-Whisker Plot Step 1. Order the data and find the smallest value, first quartile, median, third quartile, and largest value. 13 15 17 19 19 21 21 25 smallest value: 13 largest value: 25 first quartile: = 16 15 + 17 2 third quartile: = 21 21 + 21 2 median: = 19 19 + 19 2

21
Pre-Algebra 4-4 Variability Step 1. Order the data and find the smallest value, first quartile, median, third quartile, and largest value. Use the given data to make a box-and-whisker plot. 12 14 16 18 20 22 24 26 28 Step 2. Draw a number line and plot a point above each value from step 1. smallest value 13 13 15 17 19 19 21 21 25 first quartile 16 median 19 third quartile 21 largest value 25 Additional Example 2 Continued

22
Pre-Algebra 4-4 Variability Step 2. Draw a number line and plot a point above each value. Use the given data to make a box-and-whisker plot. 12 14 16 18 20 22 24 26 28 Step 3. Draw the box and whiskers. 13 15 17 19 19 21 21 25 Additional Example 2 Continued

23
Pre-Algebra 4-4 Variability 23 24 26 29 31 31 33 35 Use the given data to make a box-and-whisker plot. 31, 23, 33, 35, 26, 24, 31, 29 Try This: Example 2 Step 1. Order the data and find the smallest value, first quartile, median, third quartile, and largest value. smallest value: 23 largest value: 35 first quartile: = 25 24 + 26 2 third quartile: = 32 31 + 33 2 median: = 30 29 + 31 2

24
Pre-Algebra 4-4 Variability Use the given data to make a box-and-whisker plot. 22 24 26 28 30 32 34 36 38 Step 2. Draw a number line and plot a point above each value. 23 24 26 29 31 31 33 35 Try This: Example 2 Continued

25
Pre-Algebra 4-4 Variability Step 2. Draw a number line and plot a point above each value. Use the given data to make a box-and-whisker plot. 22 24 26 28 30 32 34 36 38 Step 3. Draw the box and whiskers. 23 24 26 29 31 31 33 35 Try This: Example 2 Continued

26
Pre-Algebra 4-4 Variability Additional Example 3: Comparing Data Sets Using Box-and-Whisker Plots These box-and-whisker plots compare the ages of the first ten U.S. presidents with the ages of the last ten presidents (through George W. Bush) when they took office. Note: 57 is the first quartile and the median.
 when they took office. Note: 57 is the first quartile and the median..")
27
Pre-Algebra 4-4 Variability Additional Example 3 Continued A. Compare the medians and ranges. The median for the first ten presidents is slightly greater. The range for the last ten presidents is greater. Note: 57 is the first quartile and the median.

28
Pre-Algebra 4-4 Variability Additional Example 3 Continued B. Compare the differences between the third quartile and first quartile for each. The difference between the third quartile and first quartile is the length of the box, which is greater for the last ten presidents. Note: 57 is the first quartile and the median.

29
Pre-Algebra 4-4 Variability Try This: Example 3 Final 1234T Oakland 3061221 Tampa Bay 31714 48 These box-and- whisker plots compare the scores per quarter at Super Bowl XXXVII. The data in the T column is left out because it is a total of all the quarters. Oakland 0 3 6 9 12 15 18 Tampa Bay 0 3 6 9 12 15 18

30
Pre-Algebra 4-4 Variability A. Compare the medians and ranges. Try This: Example 3 Continued The median for Tampa Bay is significantly greater, however the range for Tampa Bay is slightly greater. Oakland 0 3 6 9 12 15 18 Tampa Bay 0 3 6 9 12 15 18

31
Pre-Algebra 4-4 Variability B. Compare the differences between the third quartile and first quartile for each. Try This: Example 3 Continued The difference between the third quartile and first quartile is the length of the box, which is slightly greater for Oakland. Oakland 0 3 6 9 12 15 18 Tampa Bay 0 3 6 9 12 15 18

32
Pre-Algebra 4-4 Variability Lesson Quiz: Part 1 Find the range and the first and third quartile for each data set. 1. 48, 52, 68, 32, 53, 47, 51 2. 3, 18, 11, 2, 7, 5, 9, 6, 13, 1, 17, 8, 0 range = 18; Q1 = 2.5; Q3 = 12 range = 36; Q1 = 47; Q3 = 53

33
Pre-Algebra 4-4 Variability Lesson Quiz: Part 2 Use the following data for problems 3 and 4. 91, 87, 98, 93, 89, 78, 94 3. Make a box-and-whisker plot 4. What is the mean? 90 78 87 91 94 98

Similar presentations


 Lower Extreme Lower Quartile Median Upper Quartile Upper Extreme Back.>")


