Download presentation
Presentation is loading. Please wait.

1
Graphing Fitness Scores

3
Name:______________________________________ GRADING RUBRIC Use of Bar OR Line Graph5 Individual Fitness scores are clearly displayed10 KV Averages and Fitnessgram Standards displayed15 Evidence of two (2) related graphics5 Title, Axis labels and values listed above each point 15 Total 50
 related graphics5 Title, Axis labels and values listed above each point 15 Total 50")
4
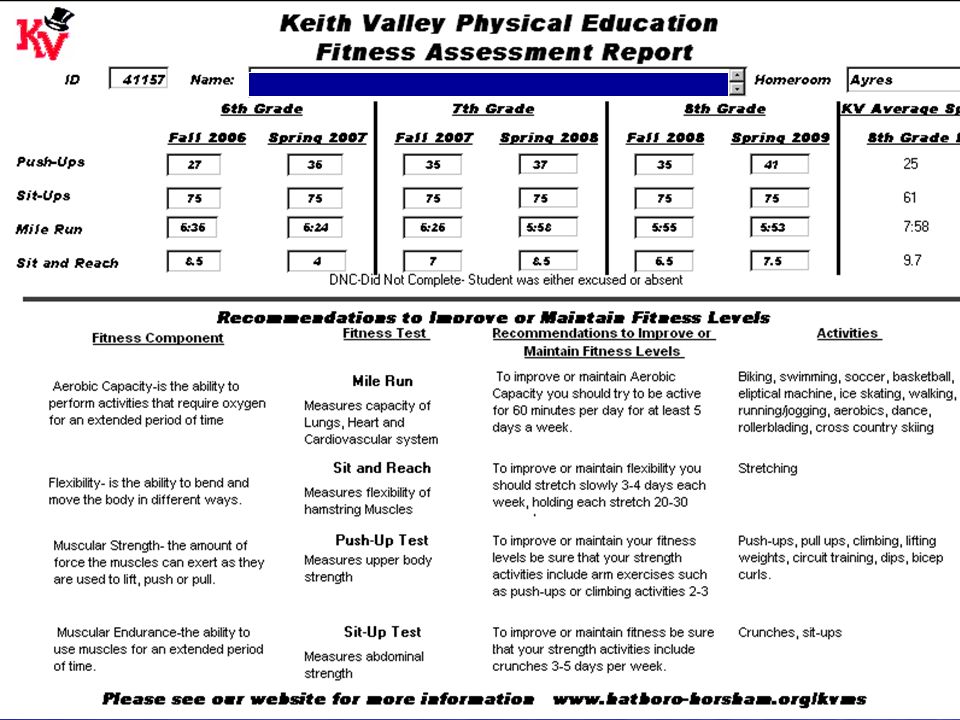
Excel Spreadsheet Fitness Assessment TestsMe KV Average Fitnessgram Low Fitnessgram High Push-ups3016.5820 Sit-ups52471536 Sit and Reach108.988 Mile7.39.17118 Enter mile times with a decimal point to work properly with graph Create a spreadsheet like the one above. Fitness Assessments down the side. Student scores, school average, Fitnessgram high and low scores across the top.

5
Creating Graph 1.Select (highlight) all cells with text/numbers 2.Click on Graph Wizard 3. Follow steps

6
Chart Wizard Step 1 Select chart type – column works best Select chart type – column works best Press next Press next

7
Chart Wizard Step 2 Select series in columns Select series in columns Chart should look like the example shown. Chart should look like the example shown.

8
Step 3 Fill in chart title, X and Y axis. Fill in chart title, X and Y axis. Select Data Labels Tab Select Data Labels Tab –Check the Value box This will add a score value above each bar graph This will add a score value above each bar graph Click Next Click Next Chart Wizard

9
Step 4 Select place chart as a new sheet Select place chart as a new sheet Click finish Click finish Chart Wizard

10
Adding Clipart Click Insert -> pictures-> clip art Clip art box appears (on right) Enter text in Search for box Find picture/ clipart and click and drag to chart (picture may need to be resized.)
 Enter text in Search for box Find picture/ clipart and click and drag to chart (picture may need to be resized.)")
11
Finished Chart with Pictures Insert 2 fitness related clipart Insert 2 fitness related clipart Print chart using color printer Use chart to answer Recommendation / Analysis Questions

Similar presentations

. Is a spreadsheet application designed to take advantage of the windows graphical interface MICROSOFT EXCEL.>")


>")


