Download presentation
Presentation is loading. Please wait.

1
WORLD GEOGRAPHY December 12, 2014

2
Today - Final class Finish Unit 10 (Human Environment)
")
3
Human Impact on the Environment Altering ecosystems - All humans (over time) altering environments - Impact greater with growth in population Environmental stress - Cutting forests, emitting pollutants, spilling oil - Burying toxic waste, dumping garbage in oceans
 altering environments - Impact greater with growth in population Environmental stress - Cutting forests, emitting pollutants, spilling oil - Burying toxic waste, dumping garbage in oceans")
4
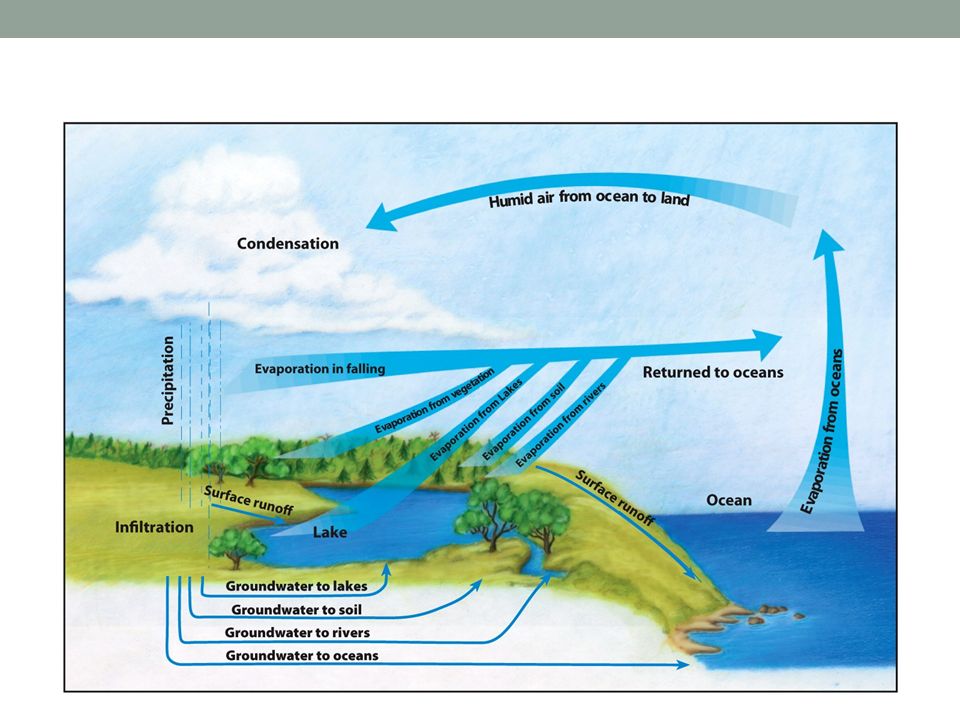
Water A renewable resource (replenished as used) Water shortages: Depletion of water in aquifers (porous, water-holding rocks) at a rapid rate Causes of shortages - Growing population - Large population concentrations near small supplies - Agricultural and industrial use
 Water shortages: Depletion of water in aquifers (porous, water-holding rocks) at a rapid rate Causes of shortages - Growing population - Large population concentrations near small supplies - Agricultural and industrial use")
5
Atmosphere A thin layer of air lying directly above the lands and oceans Natural impacts (volcanic eruptions) Human impacts - Global warming - Acid rain
 Human impacts - Global warming - Acid rain")
6
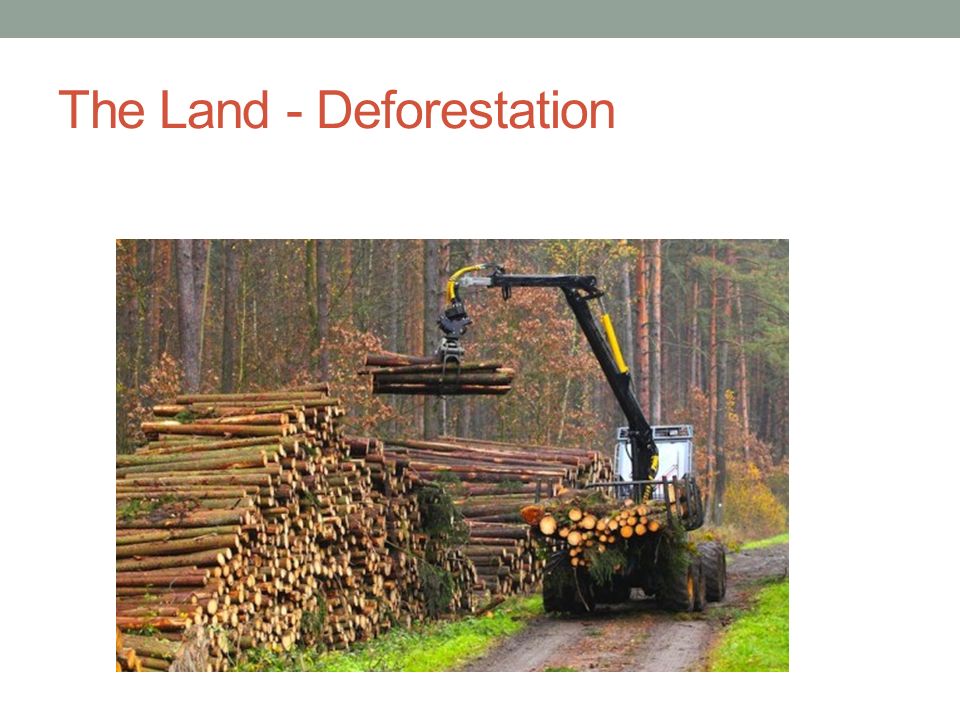
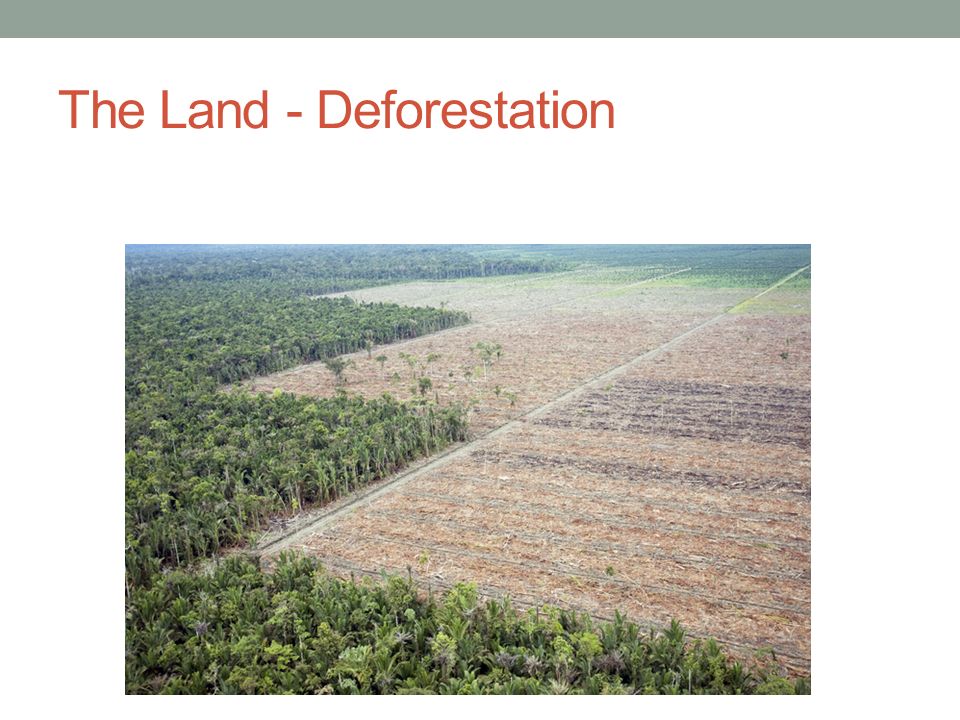
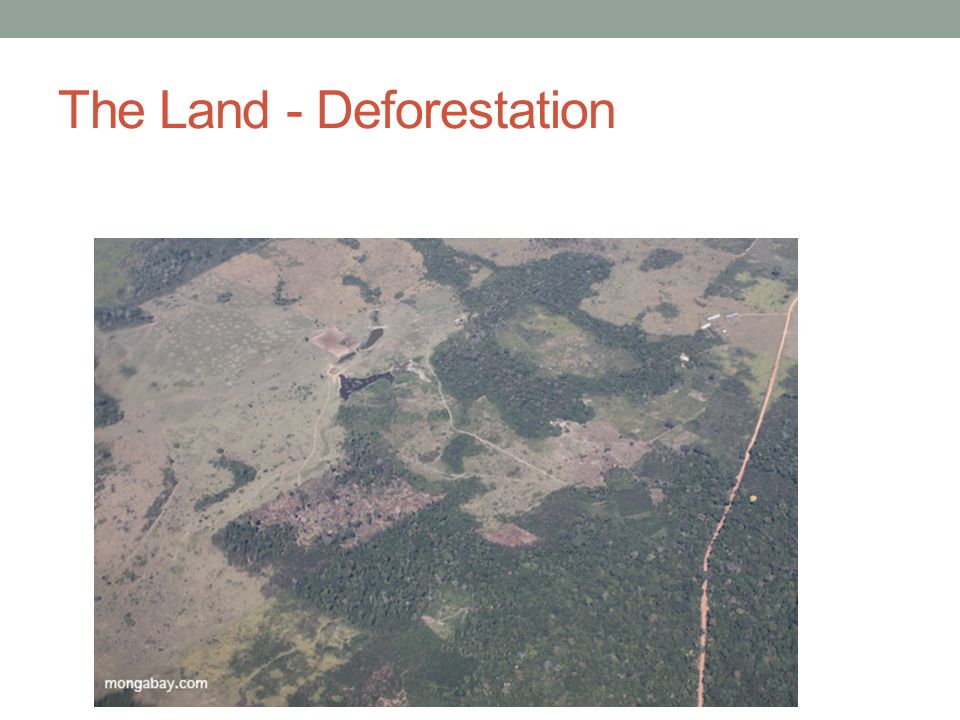
The Land Deforestation : - Effect on oxygen cycle - Biodiversity and habitats - Pollution

7
The Land - Deforestation

11
The Land Soil erosion: - Soil not having enough time to rebound - Farmers not efficiently/properly using soil (increased demand) - Livestock destroying vegetation
 - Livestock destroying vegetation")
12
The Land – Soil Erosion

13
Approx. 9600 km 2 of cropland lost to soil erosion each year

14
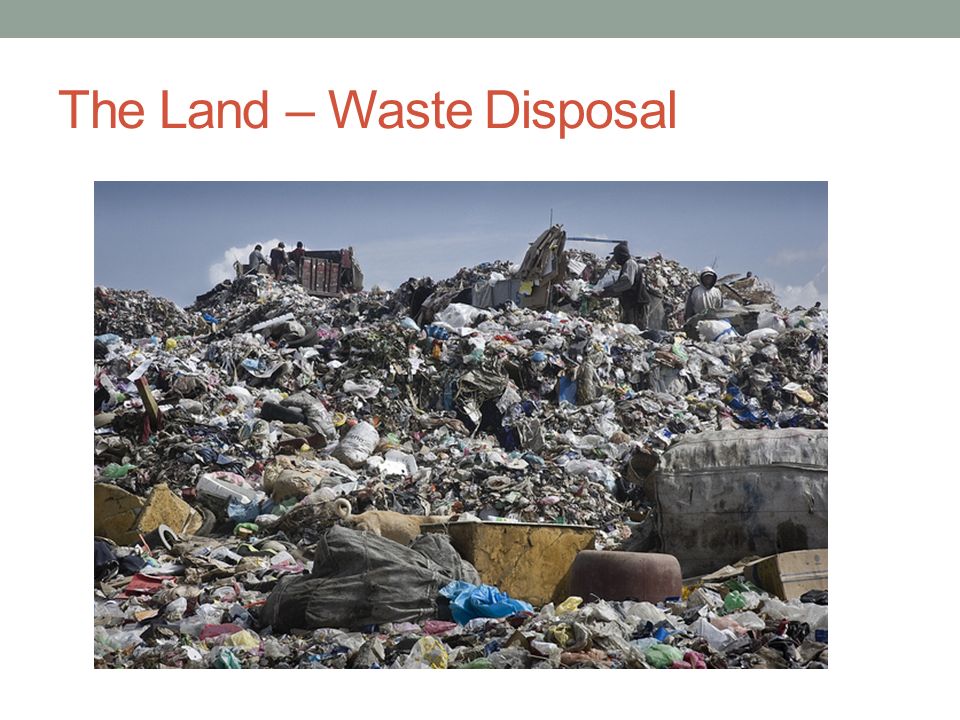
The Land Waste disposal: - Solid waste filling sanitary landfills - Problem of disposal and confinement of toxic and radioactive wastes

15
The Land – Waste Disposal

17
Sanitary landfill

18
The Land – Waste Disposal Sanitary landfill

19
The Land – Waste Disposal Nuclear waste disposal

20
The Land – Waste Disposal Top 5 waste-producing countries: 1. The U.S. – 254 million tons 2. Russia – 200 million tons 3. Japan – 52 million tons 4. Germany – 49 million tons 5. The U.K. – 35 million tons

21
The Land – Waste Disposal

22
Biodiversity Loss of biodiversity because species are threatened or quite concentrated Species with a small range most impacted - fish affected by acid rain - arctic animals (e.g. polar bears) affected by melting of polar ice caps
 affected by melting of polar ice caps.")
23
Biodiversity

24
Major Factors Contributing to Environ. Change - Population - Patterns of consumption - Technology - Transportation

25
Major Factors Contributing to Environ. Change Population World population, 1927: approx. 2 billion Current world population: approx. 7 billion - Clearly an increased strain on the environment: - increased use of resources - increase in waste

26
Major Factors Contributing to Environ. Change Population Impact depends on scale and location. - Core countries consume approx. 60% of the world’s raw industrial resources (though they represent only 22% of the population). - More waste is generated in the global core, as well.
. - More waste is generated in the global core, as well..")
27
Major Factors Contributing to Environ. Change Population Patterns of consumption: - Consumption by people in the periphery more likely to have an effect on local or regional scale. - Consumption by people in the core more wide-reaching, global consequences e.g. Demand for bananas, and meat.

28
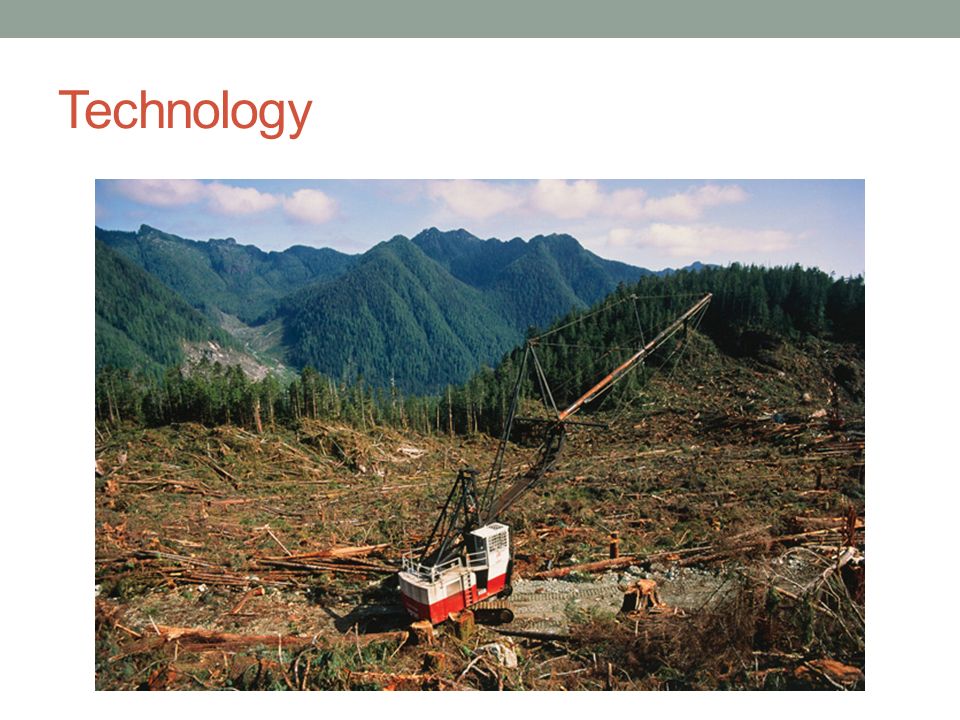
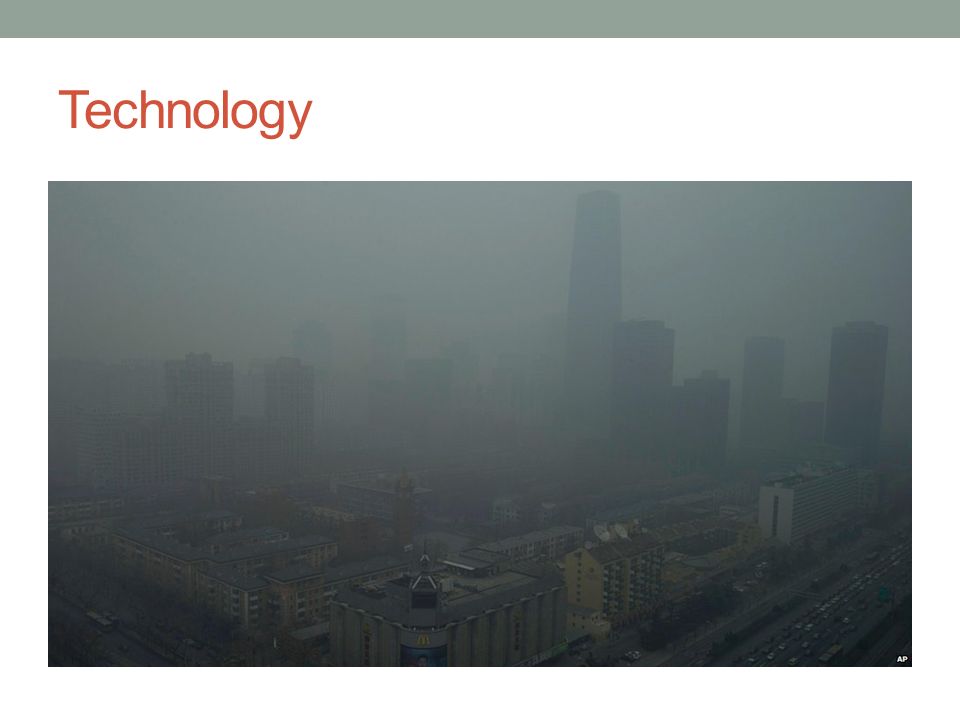
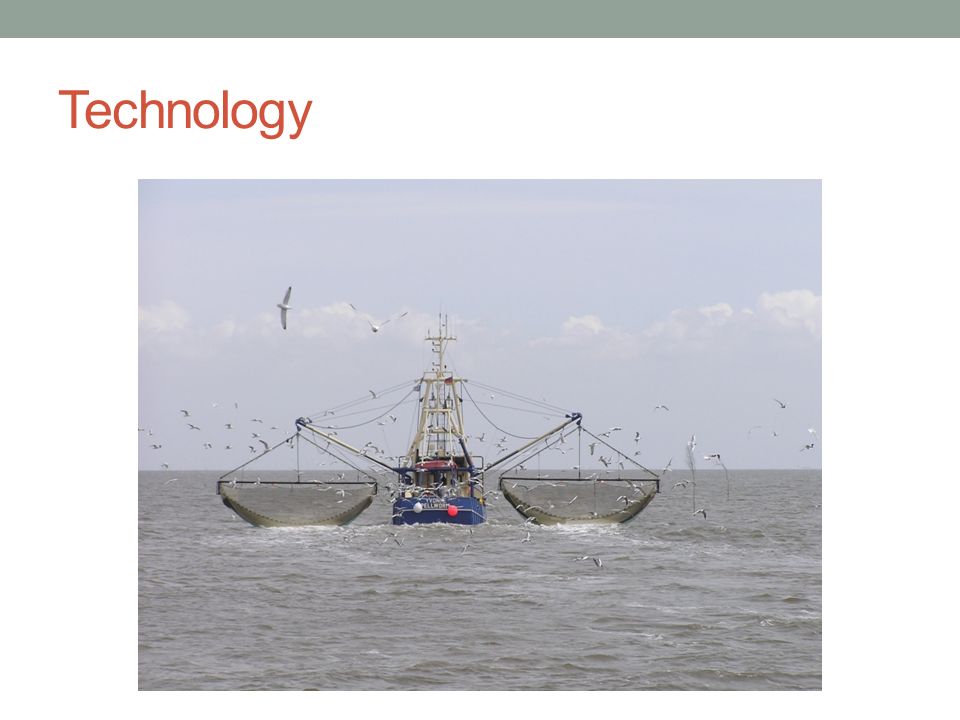
Major Factors Contributing to Environ. Change Technology Has allowed for increased global demand, production and distribution of goods. - This has led to increased resource mining and consumption. - Technology has allowed humans to make greater impact on the environment.

29
Technology

33
Major Factors Contributing to Environ. Change Transportation Innovation in transport = increased demand for and consumption of resources

34
Transportation

35
Humans can access places they previously could not and affect these places. e.g. Antarctica

36
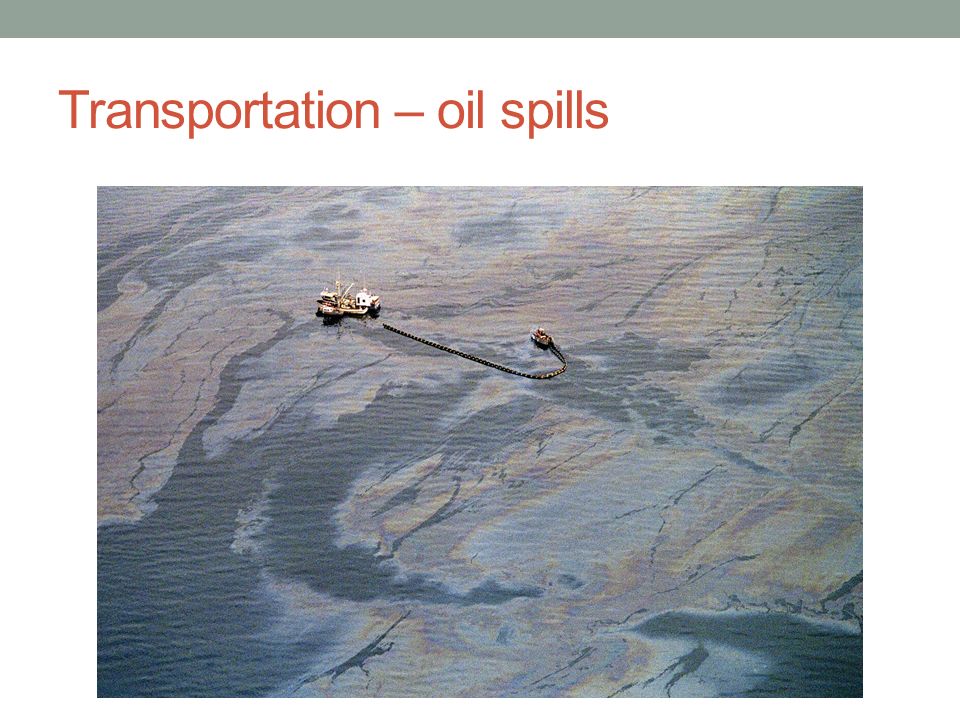
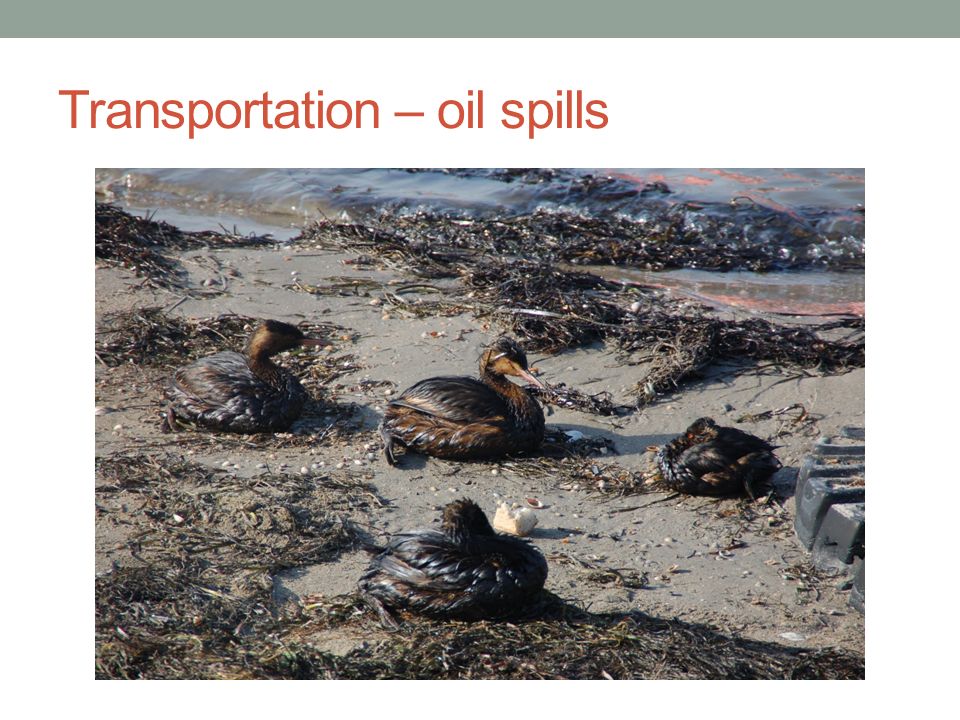
Transportation Shipping resources risk of ocean pollution

37
Transportation – oil spills

40
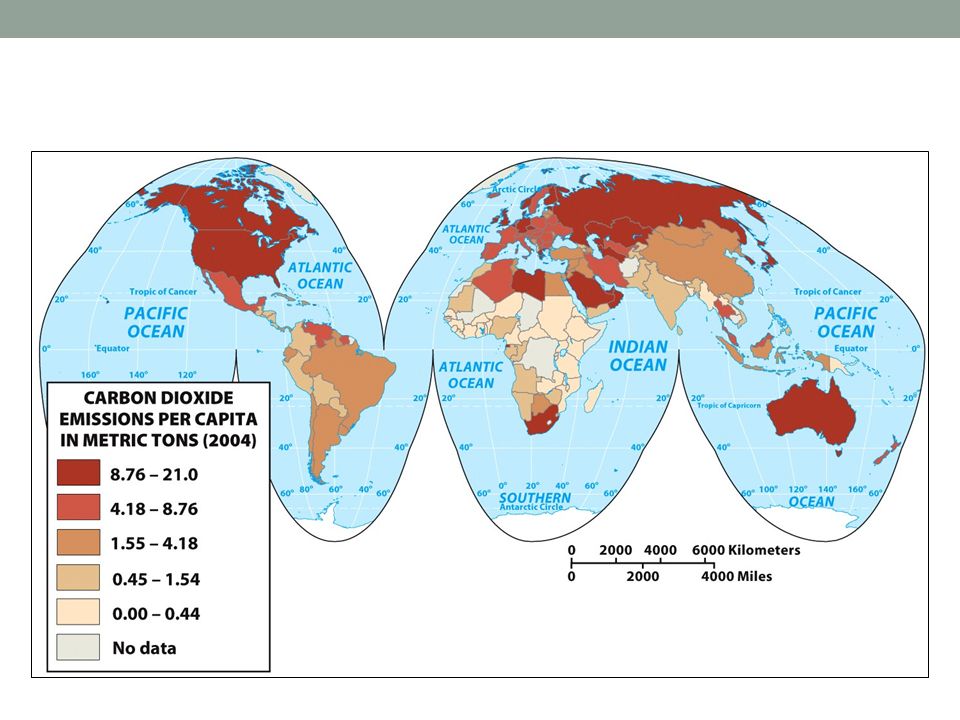
Major Factors Contributing to Environ. Change Transportation: Energy demands (oil) - Use of oil results in CO 2 emissions (often cited as main factor behind climate change)
 - Use of oil results in CO 2 emissions (often cited as main factor behind climate change).")
41
Energy Demands Sources of CO 2 pollution

42
Energy Demands Percentage of CO 2 pollution by country

43
Energy Demands Transportation: Energy demands (oil) - Fossil fuels (e.g. oil) are in finite supply. - Production and consumption of oil has increased heavily over the past 40-50 years. - Need for alternative energy sources becoming more important.
 are in finite supply. - Production and consumption of oil has increased heavily over the past years. - Need for alternative energy sources becoming more important..")
44
Alternative Energy

45
Wind farm: e.g. London Array (100 km 2 )
")
46
Alternative Energy Alta Wind Energy Center (California): - Provides power to 270,000 homes. - Offsets: 2.6 billion kg of CO 2 12.7 million kg of SO 2

47
Human Response to Environmental Change First, 2 questions: 1. Is climate change actually happening? - Evidence is strongly in support of climate change occurring “99% of scientists agree with this”. - Over the past 50 years, the earth’s temperature has increased 0.7 degrees Celsius - Changes in weather (e.g. more intense rains) - Sea levels have risen
 - Sea levels have risen.")
49
Human Response to Environmental Change First, 2 questions: 2. Is human activity causing climate change? - The warming over the past 50 years cannot be explained by natural factors alone. - Greenhouse gases from human activity (e.g. CO 2 ) major factor in climate change.
 major factor in climate change..")
50
Human Response to Environmental Change

51
One issue influencing human response to environmental change: Environmental problems not confined to states - Laws that affect change passed by state - Air pollution drifting across borders - Desertification crosses borders - Water supplies not always contained within borders - Forests grow across borders

52
States vs. Environmental Issues Major forest regions of Africa not along state boundaries World Bank’s planning regions drawn along state boundaries

53
States vs. Environmental Issues International organizations (e.g. Global Environment Facility – GEF) and NGOs attempt to address various environmental issues: - Environmental policies - Funding - Conservation projects - Education campaigns
 and NGOs attempt to address various environmental issues: - Environmental policies - Funding - Conservation projects - Education campaigns.")
54
Human Response to Environmental Change Three significant areas addressed by global conventions Biological diversity Convention on Biological Diversity (1993) Protection of the ozone layer Vienna Convention for the Protection of the Ozone Layer (1985) Montreal Protocol (1987) Global climate change Kyoto Protocol (1997) Copenhagen Agreement (2009)
 Protection of the ozone layer Vienna Convention for the Protection of the Ozone Layer (1985) Montreal Protocol (1987) Global climate change Kyoto Protocol (1997) Copenhagen Agreement (2009)")
56
Results of Kyoto Protocol Overall, developed (core) countries showed a decrease in emissions. However, due to increasing industrialization and development in periphery and semi-periphery (esp. China) has led to increased emissions. - Global emissions still high (and have not significantly slowed down).
 has led to increased emissions. - Global emissions still high (and have not significantly slowed down)..")
57
Next Class Final Exam!

58
Final exam Covers only material from after the mid-term exam - Development - Political Geography - Urban Geography - Industry and Services (Economic Geography) - Human Environment
 - Human Environment")
59
Final exam Will begin at 3:00 pm. (doors close). Arrive at least five minutes early
. Arrive at least five minutes early")
Similar presentations


 affect the physical and chemical cycles and.>")


>")