Download presentation
Presentation is loading. Please wait.

1
What are they and how do they work?
Chapter 3 Ecosystems: What are they and how do they work?

2
Objective(s): SWBAT summarize each level of organization from atom to the biosphere. SWBAT summarize the components of an ecosystem. SWBAT describe how energy flows through ecosystems. SWBAT summarize Earth’s life support systems and the three interconnected factors that sustain life. SWBAT compare and contrast Photosynthesis and Respiration, including providing the balanced chemical equation.

3
Objective(s): SWBAT diagram and discuss food chains and food webs.
SWBAT explain how Carbon, Nitrogen, and Phosphorus cycle within ecosystems. SWBAT describe what happens when Nitrogen and Phosphorus are in excess in ecosystems. SWBAT summarize the intermediate disturbance hypothesis.

4
3-1 What is Ecology? Concept 3-1: Ecology is the study of how organisms interact with one another and with their physical environment of matter and energy.

5
Review

6
Review

7
Chapter 3: Ecosystem

8
Chapter 3: Ecosystems Ecosystem: a particular location on Earth distinguished by its particular mix of interacting biotic and abiotic components.

9
Chapter 3: Ecosystems

10
Chapter 3: Ecosystems

11
Chapter 3: Ecosystems Biotic Components: living components of an ecosystem. (bacteria, fungus, plants, animals) Abiotic Components: nonliving components of an ecosystem; determines which organisms can live there. (sunlight, temperature, precipitation, pH, soil, nutrient availability)
")
12
Chapter 3: Ecosystems Components of an ecosystem are highly dependent on climate.

13
Chapter 3: Ecosystem Ecology
Some ecosystems, such as a caves and lakes have very distinctive boundaries. However, in most ecosystems it is difficult to determine where one ecosystems stops and the next begins.

14
Chapter 3: Ecosystem Ecology

15
3-2 What Keeps Us and Other Organisms Alive?
Concept 3-2: Life is sustained by the flow of energy from the sun through the biosphere, the cycling of nutrients within the biosphere, and gravity.

16
Earth’s Life-Support System

17
Earth’s Life-Support System

18
Earth’s Life-Support System

19
Earth’s Life-Support System

20
Biomes Terrestrial regions inhabited by certain types of life, especially vegetation.

21
Average annual precipitation 100–125 cm (40–50 in.)
below 25 cm (0–10 in.) Denver Baltimore San Francisco St. Louis Coastal mountain ranges Sierra Nevada Great American Desert Rocky Mountains Great Plains Mississippi River Valley Appalachian Mountains Figure 3.7 Major biomes found along the 39th parallel across the United States. The differences reflect changes in climate, mainly differences in average annual precipitation and temperature. Coastal chaparral and scrub Coniferous forest Desert Coniferous forest Prairie grassland Deciduous forest Fig. 3-7, p. 55
 Denver. Baltimore. San Francisco. St. Louis. Coastal mountain. ranges. Sierra Nevada. Great American. Desert. Rocky. Mountains. Great. Plains. Mississippi. River Valley. Appalachian. Mountains. Figure 3.7. Major biomes found along the 39th parallel across the United States. The differences reflect changes in climate, mainly differences in average annual precipitation and temperature. Coastal chaparral. and scrub. Coniferous forest. Desert. Coniferous forest. Prairie grassland. Deciduous forest. Fig. 3-7, p. 55.")
22
Three Factors Sustain Life on Earth
One-way flow of high-quality energy: 1st and 2nd Law of Thermodynamics governs this. Cycling of matter and nutrients: fixed supply of nutrients needs to constantly be recycled. Gravity: allows planet to hold onto to atmosphere

24
3-3 What are the major components of an Ecosystem?
Concept 3-3A: Ecosystems contain living (biotic) and nonliving (abiotic) components. Concept 3-3B: Some organisms produce the nutrients they need, others get their nutrients by consuming other organisms, and some recycle nutrients back to producers by decomposing the wastes and remains of organisms.
 and nonliving (abiotic) components. Concept 3-3B: Some organisms produce the nutrients they need, others get their nutrients by consuming other organisms, and some recycle nutrients back to producers by decomposing the wastes and remains of organisms. v=v6ubvEJ3KGM.")
25
3-3 What are the Major Components of an Ecosystem?
Biosphere and its ecosystems include: biotic (living) and abiotic (nonliving) factors. Each population in an ecosystem has a range of tolerance (range of physical and chemical conditions that must be maintained for a population to stay alive, grow, develop and function normally.
 and abiotic (nonliving) factors. Each population in an ecosystem has a range of tolerance (range of physical and chemical conditions that must be maintained for a population to stay alive, grow, develop and function normally.")
26
Abundance of organisms
Lower limit of tolerance Higher limit of tolerance No organisms Few organisms Few organisms No organisms Abundance of organisms Population size Figure 3.10 Range of tolerance for a population of organisms, such as fish, to an abiotic environmental factor—in this case, temperature. These restrictions keep particular species from taking over an ecosystem by keeping their population size in check. Question: Which scientific principle of sustainability (see back cover) is related to the range of tolerance concept? Zone of intolerance Zone of physiological stress Optimum range Zone of physiological stress Zone of intolerance Low Temperature High Fig. 3-10, p. 58
 is related to the range of tolerance concept Zone of. intolerance. Zone of. physiological. stress. Optimum range. Zone of. physiological. stress. Zone of. intolerance. Low. Temperature. High. Fig. 3-10, p. 58.")
27
3-3 Major Components of Ecosystems
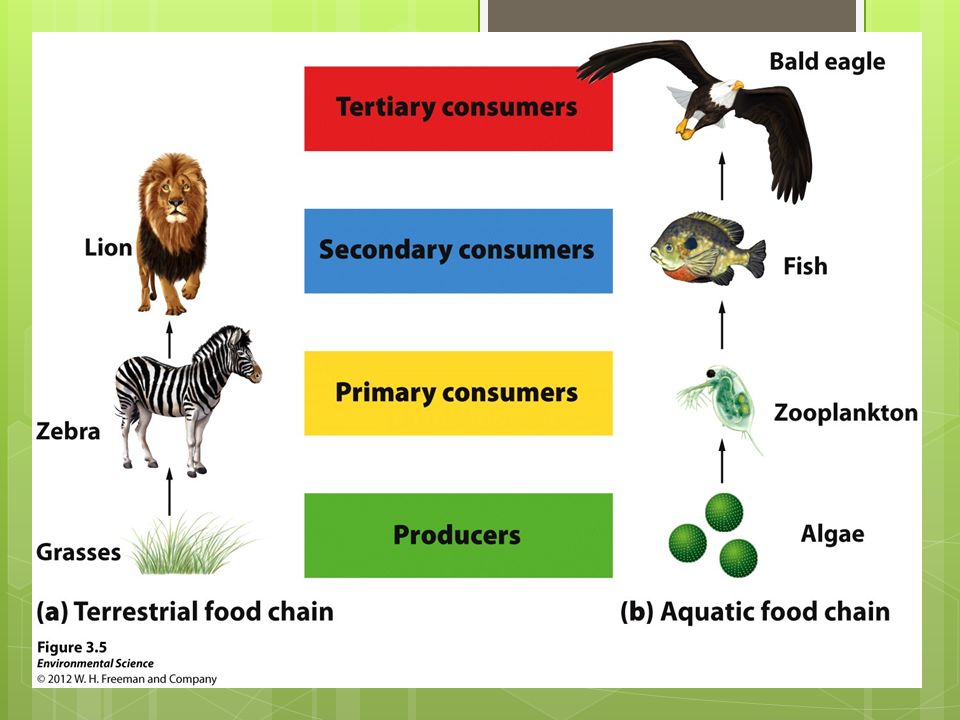
Trophic Levels – Levels in the feeding structure of organisms. Higher trophic levels consume organisms from lower levels.

28
Energy Flow through Ecosystems
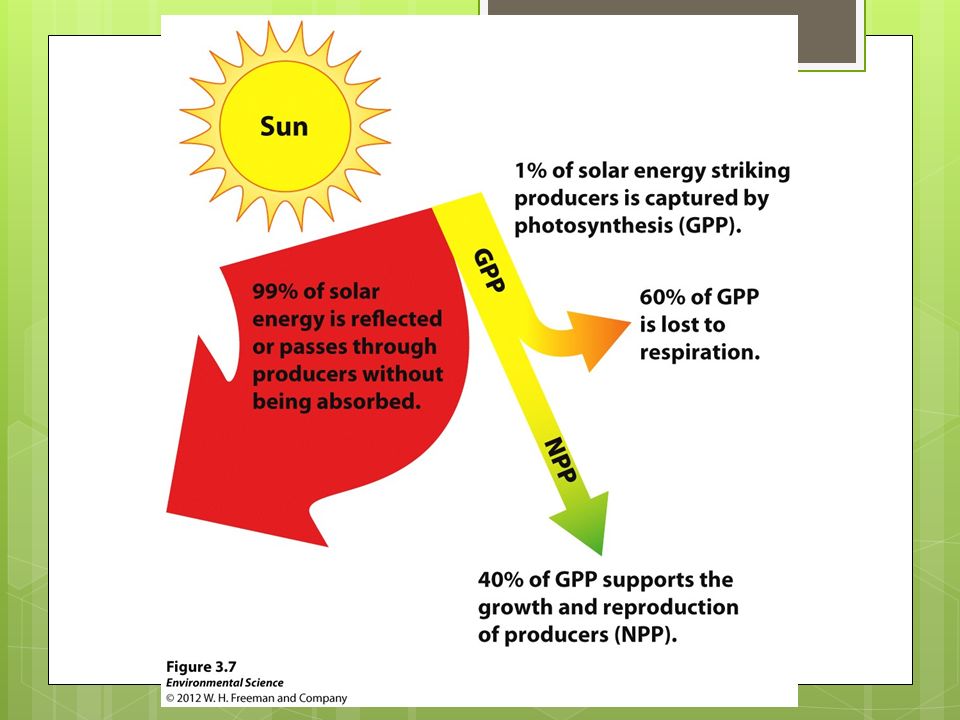
Producers (Autotrophs) – Plants, algae and other organisms that use the sun’s energy to produce usable forms of energy. Photosynthesis – process by which autotrophs, like algae and plants, trap energy from the sunlight with chlorophyll and use this energy to convert carbon dioxide and water into simple sugars (glucose). The waste product of this process is oxygen.
 – Plants, algae and other organisms that use the sun’s energy to produce usable forms of energy. Photosynthesis – process by which autotrophs, like algae and plants, trap energy from the sunlight with chlorophyll and use this energy to convert carbon dioxide and water into simple sugars (glucose). The waste product of this process is oxygen.")
29
Energy Flow through Ecosystems

30
In photosynthesis, autotrophs use solar energy, water and carbon dioxide to produce glucose and the waste product, oxygen. Respiration is the opposite of photosynthesis; cells convert glucose and oxygen into energy, carbon dioxide and water.

31
Energy Flow through Ecosystems
Consumers (Heterotrophs) – incapable of producing their own food and must obtain their energy by consuming other organisms. Primary Consumers – heterotrophs (herbivores) that consume producers. Carnivores – heterotrophs that obtain energy by eating other consumers. Secondary Consumers – Carnivores/Omnivores that eat primary consumers. Tertiary Consumers – Carnivores/Omnivores that eat secondary consumers.
 – incapable of producing their own food and must obtain their energy by consuming other organisms. Primary Consumers – heterotrophs (herbivores) that consume producers. Carnivores – heterotrophs that obtain energy by eating other consumers. Secondary Consumers – Carnivores/Omnivores that eat primary consumers. Tertiary Consumers – Carnivores/Omnivores that eat secondary consumers.")
33
Energy Flow through Ecosystems
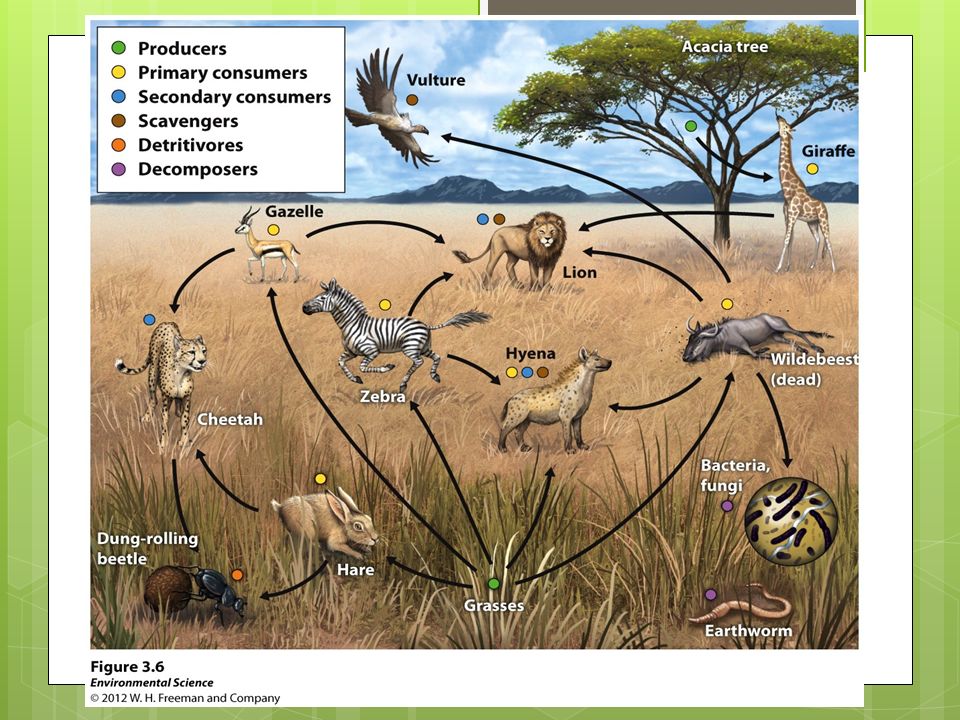
Scavengers – Carnivores that consume dead animals. (ex. Vultures) Detritivores – organisms that specialize in breaking down dead tissues and waste products in smaller particles. (ex. Dung beetles) Decomposers – organisms that complete the breakdown process by recycling the nutrients from dead tissues and wastes back into ecosystems. (ex. Fungus and bacteria)
 Detritivores – organisms that specialize in breaking down dead tissues and waste products in smaller particles. (ex. Dung beetles) Decomposers – organisms that complete the breakdown process by recycling the nutrients from dead tissues and wastes back into ecosystems. (ex. Fungus and bacteria)")
34
decomposers into plant nutrients in soil
Detritus feeders Decomposers Carpenter ant galleries Termite and carpenter ant work Bark beetle engraving Dry rot fungus Long-horned beetle holes Wood reduced to powder Figure 3.11 Various detritivores and decomposers (mostly fungi and bacteria) can “feed on” or digest parts of a log and eventually convert its complex organic chemicals into simpler inorganic nutrients that can be taken up by producers. Mushroom Time progression Powder broken down by decomposers into plant nutrients in soil Fig. 3-11, p. 60
 can feed on or digest parts of a log and eventually convert its complex organic chemicals into simpler inorganic nutrients that can be taken up by producers. Mushroom. Time progression. Powder broken down by. decomposers into plant. nutrients in soil. Fig. 3-11, p. 60.")
35
Solar energy Abiotic chemicals (carbon dioxide, oxygen, nitrogen,
minerals) Heat Heat Heat Decomposers (bacteria, fungi) Producers (plants) Figure 3.12 Natural capital: the main structural components of an ecosystem (energy, chemicals, and organisms). Nutrient cycling and the flow of energy—first from the sun, then through organisms, and finally into the environment as low-quality heat—link these components. See an animation based on this figure at CengageNOW. Consumers (herbivores, carnivores) Heat Heat Fig. 3-12, p. 60
 Heat. Heat. Heat. Decomposers. (bacteria, fungi) Producers. (plants) Figure Natural capital: the main structural components of an ecosystem (energy, chemicals, and organisms). Nutrient cycling and the flow of energy—first from the sun, then through organisms, and finally into the environment as low-quality heat—link these components. See an animation based on this figure at CengageNOW. Consumers. (herbivores, carnivores) Heat. Heat. Fig. 3-12, p. 60.")
36
3-4 What Happens to Energy in an Ecosystem?
Concept 3-4A: Energy flows through ecosystems in food chains and food webs. Concept 3-4B: As energy flows through ecosystems in food chains and food webs, the amount of chemical energy available to organisms at each succeeding feeding level decreases.

37
What happens to Energy in an Ecosystem?
Food Chain – the sequence of consumption from producers through all levels of consumers. Food Web - A complex model of how energy and matter move between trophic levels.

39
Energy Flows from Ecosystems
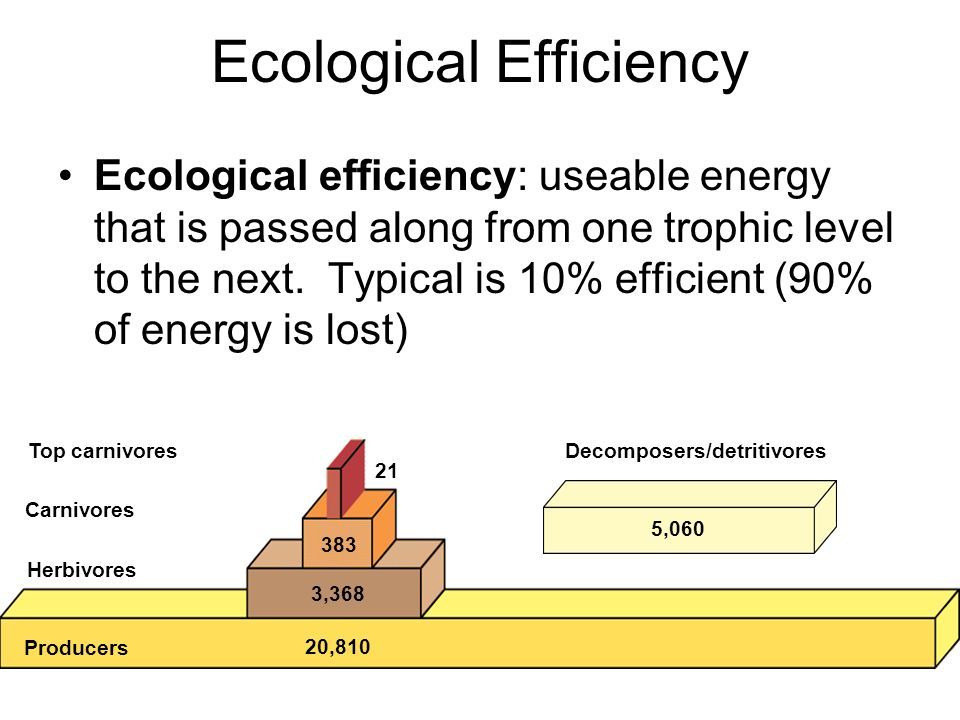
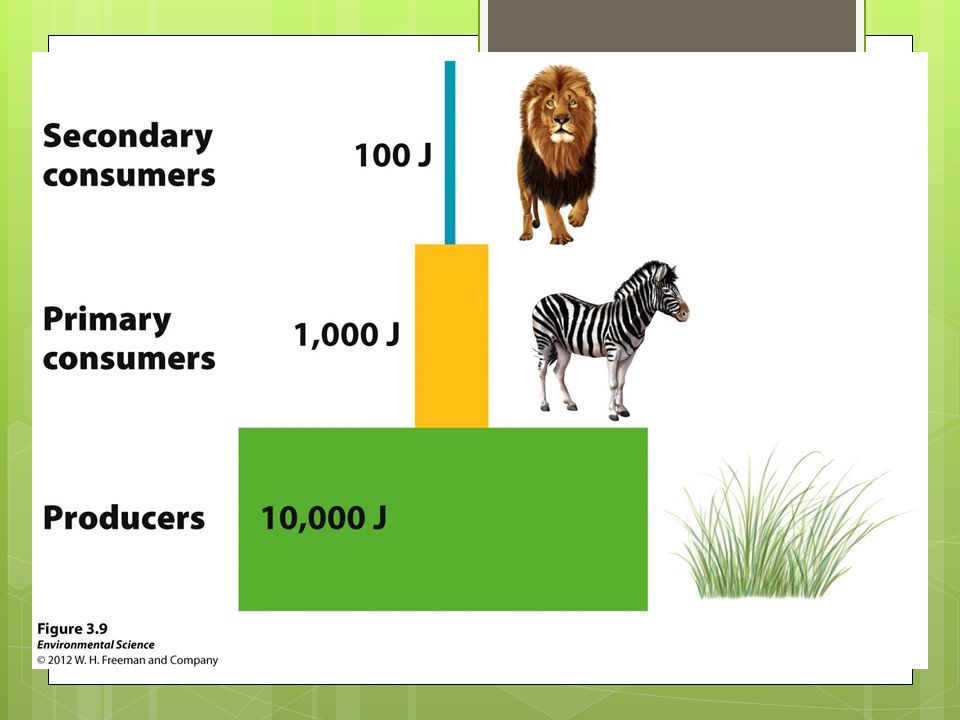
Most energy and biomass is found at the producer level and energy and biomass decrease as we move up the pyramid. Flow of energy between trophic levels helps to determine population sizes of various species within each trophic level. What are the implications of this on the human diet?

40
Energy Flows from Ecosystems
Not all energy contained in a particular trophic level is in a usable form. Some parts of plants are not digestible by all consumers and are excreted. Of the food that is digestible, some fraction of the energy obtained is used to power the consumer’s day-to-day activities (moving, eating, etc) and some is lost as heat. Ecological Efficiency – the proportion of consumed energy that can be passed from one trophic level to another. Trophic Pyramid – represents the distribution of biomass among trophic levels.
 and some is lost as heat. Ecological Efficiency – the proportion of consumed energy that can be passed from one trophic level to another. Trophic Pyramid – represents the distribution of biomass among trophic levels.")
42
Usable energy available
at each trophic level (in kilocalories) Heat Tertiary consumers (human) 10 Heat Secondary consumers (perch) 100 Heat Decomposers Heat Primary consumers (zooplankton) 1,000 Figure 3.15 Generalized pyramid of energy flow showing the decrease in usable chemical energy available at each succeeding trophic level in a food chain or web. In nature, ecological efficiency varies from 2% to 40%, with 10% efficiency being common. This model assumes a 10% ecological efficiency (90% loss of usable energy to the environment, in the form of low-quality heat) with each transfer from one trophic level to another. Question: Why is a vegetarian diet more energy efficient than a meat-based diet? Heat 10,000 Producers (phytoplankton) Fig. 3-15, p. 63
 Heat. Tertiary. consumers. (human) 10. Heat. Secondary. consumers. (perch) 100. Heat. Decomposers. Heat. Primary. consumers. (zooplankton) 1,000. Figure Generalized pyramid of energy flow showing the decrease in usable chemical energy available at each succeeding trophic level in a food chain or web. In nature, ecological efficiency varies from 2% to 40%, with 10% efficiency being common. This model assumes a 10% ecological efficiency (90% loss of usable energy to the environment, in the form of low-quality heat) with each transfer from one trophic level to another. Question: Why is a vegetarian diet more energy efficient than a meat-based diet Heat. 10,000. Producers. (phytoplankton) Fig. 3-15, p. 63.")
44
Energy Flows from Ecosystems
Biomass – the energy in an ecosystem can be measured in biomass which is the total mass of all living matter in a specific area. NPP establishes the rate at which biomass is produced over a given amount of time. Standing Crop – the amount of biomass present in an ecosystem at a particular time; measure the amount of energy in a system at a given time.

45
Energy Flows from Ecosystem
Gross Primary Productivity (GPP) – the measure of the total amount of solar energy that the producers in an ecosystem capture via photosynthesis over a given amount of time. (does not subtract the energy lost when producers respire) Net Primary Productivity (NPP) – the energy captured by producers minus the energy that producers respire. Allows us to compare the productivity of different ecosystems. NPP = GPP – respiration by producers How to derive the GPP of an ecosystem per day within a given area: CO2 taken up during photosynthesis = CO2 taken up in sunlight + CO2 produced in the dark The GPP unit is kilograms of Carbon taken up per square meter per day (kg C/m2/day)
 – the measure of the total amount of solar energy that the producers in an ecosystem capture via photosynthesis over a given amount of time. (does not subtract the energy lost when producers respire) Net Primary Productivity (NPP) – the energy captured by producers minus the energy that producers respire. Allows us to compare the productivity of different ecosystems. NPP = GPP – respiration by producers. How to derive the GPP of an ecosystem per day within a given area: CO2 taken up during photosynthesis = CO2 taken up in sunlight + CO2 produced in the dark. The GPP unit is kilograms of Carbon taken up per square meter per day (kg C/m2/day)")
46
Terrestrial Ecosystems
Swamps and marshes Tropical rain forest Temperate forest Northern coniferous forest Savanna Agricultural land Woodland and shrubland Temperate grassland Tundra (arctic and alpine) Desert scrub Extreme desert Aquatic Ecosystems Estuaries Figure 3.16 Estimated annual average net primary productivity in major life zones and ecosystems, expressed as kilocalories of energy produced per square meter per year (kcal/m2/yr). Question: What are nature’s three most productive and three least productive systems? (Data from R. H. Whittaker, Communities and Ecosystems, 2nd ed., New York: Macmillan, 1975) Lakes and streams Continental shelf Open ocean 800 1,600 2,400 3,200 4,000 4,800 5,600 6,400 7,200 8,000 8,800 9,600 Average net primary productivity (kcal/m2/yr) Fig. 3-16, p. 64
 Desert scrub. Extreme desert. Aquatic Ecosystems. Estuaries. Figure Estimated annual average net primary productivity in major life zones and ecosystems, expressed as kilocalories of energy produced per square meter per year (kcal/m2/yr). Question: What are nature’s three most productive and three least productive systems (Data from R. H. Whittaker, Communities and Ecosystems, 2nd ed., New York: Macmillan, 1975) Lakes and streams. Continental shelf. Open ocean ,600. 2,400. 3,200. 4,000. 4,800. 5,600. 6,400. 7,200. 8,000. 8,800. 9,600. Average net primary productivity (kcal/m2/yr) Fig. 3-16, p. 64.")
47
3-5 What happens to Matter in an Ecosystem?
Concept 3-5: Matter, in the form of nutrients, cycles within and among ecosystems and the biosphere, and human activities are altering these cycles.

48
Matter Cycles through the Biosphere
Biosphere – the region of our planet where life resides. Matter does not enter or leave the biosphere; Earth is a closed system with respect to matter. Biogeochemical Cycles – the movement of matter within and between ecosystems involving biological, geological and chemical processes. Pools – components that contain matter (air, water, organisms) Flows – Processes that move matter between pools.
 Flows – Processes that move matter between pools. v=2D7hZpIYlCA.")
49
The Hydrologic Cycle

50
The Carbon Cycle Carbon is the most important element in living organisms and comprises about 20% of their total body weight

51
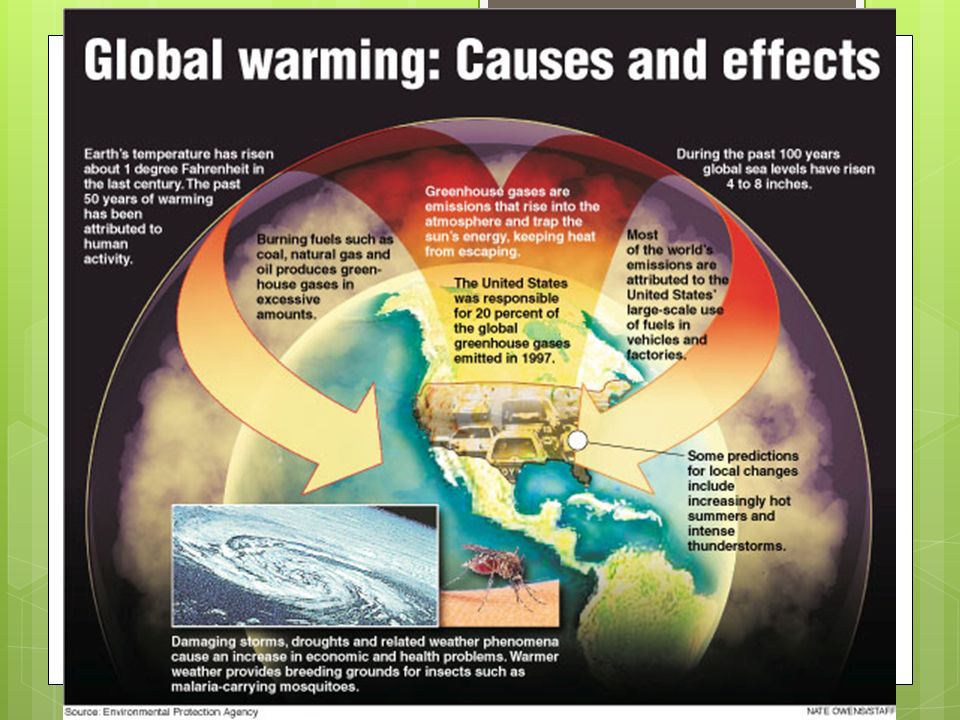
What Human Activities Alter the Carbon Cycle?
Industrial Revolution Combustion of Fossil Fuels Tree harvesting

53
Matter Cycles through the Biosphere
Macronutrients – the six key elements that organisms need in relatively large amounts. They are: Nitrogen Phosphorus Potassium Calcium Magnesium Sulfur Limiting Nutrient – a nutrient required for the growth of an organism but available in a lower quantity than other nutrients. (nitrogen)
")
54
Nitrogen is used to form amino acids and nucleic acids
The Nitrogen Cycle Nitrogen is used to form amino acids and nucleic acids

55
Nitrogen Cycle: Major Steps

56
Matter Cycles through the Biosphere
Leaching: Nitrate is readily transported through the soil with water because negatively charged nitrate ions do not bind easily to soil particles, most of which are negatively charged. Excess Nitrogen: is a limiting factor in most terrestrial ecosystems. Increases atmospheric nitrogen May alter the distribution or abundance of species in the disturbed ecosystem

57
The Phosphorus Cycle

58
Matter Cycles through the Biosphere
Excess Phosphorus: is a limiting nutrient in many aquatic systems. Increases growth of producers May cause algal blooms Two major sources of phosphorus in waterways: Fertilizer-containing runoff from agriculture Fertilizer-containing runoff from residential areas Household detergents (previously)
")
59
Matter Cycles through the Biosphere
Calcium, Magnesium, and Potassium are macronutrients derived primarily from rocks and decomposed vegetation. All three dissolve as cations in water. Not present in gaseous phase. Mg2+ and Ca2+ are strongly attracted to soil particles. K + is weakly attracted to soil particles so it is more susceptible to leaching.

60
Matter Cycles through the Biosphere
Sulfur Cycle: gaseous cycle Much of earth’s sulfur is stored underground in rocks and minerals Hydrogen sulfide is released from active volcanoes and by the breakdown of organic matter in bogs, tidal flats and swamps Sulfur dioxide also comes from volcanoes Sulfur cycles globally through living organisms, aquatic systems and the atmosphere

62
Ecosystems respond to disturbance
Disturbance: An event caused by physical, chemical or biological agents that results in changes in the population size or community composition. Natural: hurricanes, tornados, tsunamis, storms, volcanic eruptions, earthquakes Anthropogenic: human settlements, agriculture, air pollution, deforestation, removal of mountaintops (mining) May occur over short time periods and long time scales
 May occur over short time periods and long time scales.")
63
Ecosystem respond to disturbance
Watershed: All of the land in a given landscape that drains into a particular stream, river, or wetland. Hubbard Rock Ecosystem Researchers investigated the effects of clear cutting and subsequent suppression of plant re-growth. What was their experimental set-up and their findings?

64
Ecosystems respond to disturbance
Resistance: a measure of how much a disturbance can affect the flows of energy and matter. High resistance – when a disturbance influences populations and communities, but has no net effect on the flow of energy and matter Resilience: the rate at which an ecosystem returns to its original state after a disturbance; often depends on specific interactions of the biochemical cycles and the hydrologic cycle. Restoration Ecology: a new scientific discipline that is interested in restoring damaged ecosystems.

65
Ecosystems respond to disturbance
Intermediate Disturbance Hypothesis: states that ecosystems experiencing intermediate levels of disturbance are more diverse than those with high or low disturbance levels. When disturbances are rare there is intense competition among species When disturbances are frequent population growth rates must be high enough to prevent species extinction

67
Ecosystems provide valuable service
Instrumental Value: a species has worth as an instrument or tool. Ex. = lumber, pharmaceuticals Five categories: provisions, regulating services, support systems, resilience and cultural services. Intrinsic Value: a species has worth independent any of benefit it may provide to humans. Involves moral value of animal’s life; can not be quantified. Ecosystem Services: the benefits that human obtain from natural ecosystems.

68
Ecosystems provide valuable service
Provisions: goods that can be used directly by humans. Ex. = lumber, food crops, medicinal plants Regulating Services: help to regulate environmental conditions. Ex. = carbon removal Support Systems: support services that would be costly for humans to generate. Ex. = pollination, water filtration Resilience: depends on species diversity. Culture Services: cultural or aesthetic benefits to humans.

Similar presentations


>")
 and between organisms and their environment (abiotic factors).>")


