Download presentation
Presentation is loading. Please wait.

1
Chapter 3 Ecosystem Ecology

2
REVERSING THE DEFORESTATION OF HAITI
75% < $2.00/day % forest <2% forest What does deforestation do to ecosystem services?

4
REVERSING THE DEFORESTATION OF HAITI
Mango Trees!!! $70 - $150 of mangos/year! How does this address the deforestation problem?

5
Ecosystem Ecology Examines Interactions Between the Living and Non-Living World
Ecosystem- A particular location on Earth distinguished by its particular mix of interacting biotic and abiotic components.

6
Ecosystem Boundaries Biotic and abiotic components provide boundaries that distinguish one ecosystem from another. Some ecosystems, such as a caves and lakes have very distinctive boundaries. However, in most ecosystems it is difficult to determine where one ecosystems stops and the next begins.

8
Ecosystem boundaries might be defined by a particular species of interest or topographic features.

11
Ecosystem Processes Even though it is helpful to distinguish between two different ecosystems, ecosystems interact with other ecosystems by exchanging matter and energy.

12
Checkpoint… What is an ecosystem and what are its components?

13
Checkpoint… How would you know when you left one ecosystem and entered another?

14
Checkpoint… How are ecosystem boundaries different than natural ones?

15
Energy Flows through Ecosystems

16
Photosynthesis and Respiration
Producers (autotrophs) are able to use the suns energy to produce usable energy through the process called photosynthesis.
 are able to use the suns energy to produce usable energy through the process called photosynthesis.")
18
Let’s demonstrate… Volunteers please….

19
Photosynthesis and Respiration
Cellular respiration is the process by which other organisms gain energy from eating the tissues of producers.

20
Trophic Levels, Food Chains, and Food Webs
Consumers (heterotrophs)- obtain energy by consuming other organisms. Primary Consumers (herbivores)- consume producers. Secondary Consumers (carnivores)- obtain their energy by eating primary consumers. Tertiary Consumers (carnivores)- eat secondary consumers.
- obtain energy by consuming other organisms. Primary Consumers (herbivores)- consume producers. Secondary Consumers (carnivores)- obtain their energy by eating primary consumers. Tertiary Consumers (carnivores)- eat secondary consumers.")
22
Food Chain- The sequence of consumption from producers through tertiary consumers.
Food Web- A more realistic type of food chain that takes into account the complexity of nature.

24
Ecosystem Productivity
Gross primary productivity (GPP)- The total amount of solar energy that the producers in an ecosystem capture via photosynthesis over a given amount of time. Net primary productivity (NPP)- The energy captured (GPP) minus the energy respired by producers.
- The total amount of solar energy that the producers in an ecosystem capture via photosynthesis over a given amount of time. Net primary productivity (NPP)- The energy captured (GPP) minus the energy respired by producers.")
25
GPP = amount you get paid
NPP = amount after taxes

26
CO2 taken up during photosynthesis =
CO2 taken up in sunlight + CO2 produced in the dark With this information can determine the GPP of an ecosystem/day. Units: kg C/m2/day (Kilograms of C taken up per m2 per day).
.")
28
Converting sunlight into chemical energy is not efficient.
NPP ranges from 25-50% of GPP Or 0.25% of solar energy striking the plant. Of the 1% of sun’s energy that is captured by a producer only 40% is used. Let’s do the math!

29
A forest in North America has a GPP of 2.5 kg C/m2/year.
It loses 1.5 kg C/m2/year to respiration NPP= = 1 kg C/m2/year (1.8 lbs C/m2/year) This means: plants living in 1 m2 of forest will add 1kg of C to their tissues each year by growing/reproduction. NPP= 40% of GPP ALLOWS US TO COMPARE PRODUCTIVITY AND CHANGE IN AN ECOSYSTEM!
 This means: plants living in 1 m2 of forest will add 1kg of C to their tissues each year by growing/reproduction. NPP= 40% of GPP. ALLOWS US TO COMPARE PRODUCTIVITY AND CHANGE IN AN ECOSYSTEM!")
31
Energy Transfer Efficiency and Trophic Pyramids
Biomass- The energy in an ecosystem is measured in terms of biomass. Standing crop- The amount of biomass/energy present in an ecosystem at a particular time. (note different than productivity or rate of energy) Ecological efficiency- The proportion of consumed energy that can be passed from one trophic level to another. Trophic pyramid- The representation of the distribution of biomass among trophic levels.
 Ecological efficiency- The proportion of consumed energy that can be passed from one trophic level to another. Trophic pyramid- The representation of the distribution of biomass among trophic levels.")
32
Standing Crop Slow growing forest:
Low productivity – low amounts of biomass added each year Standing Crop – biomass is high

33
Standing Crop Algae – high productivity due to high growth rates
--- standing crop is l ow due to primary consumers.

34
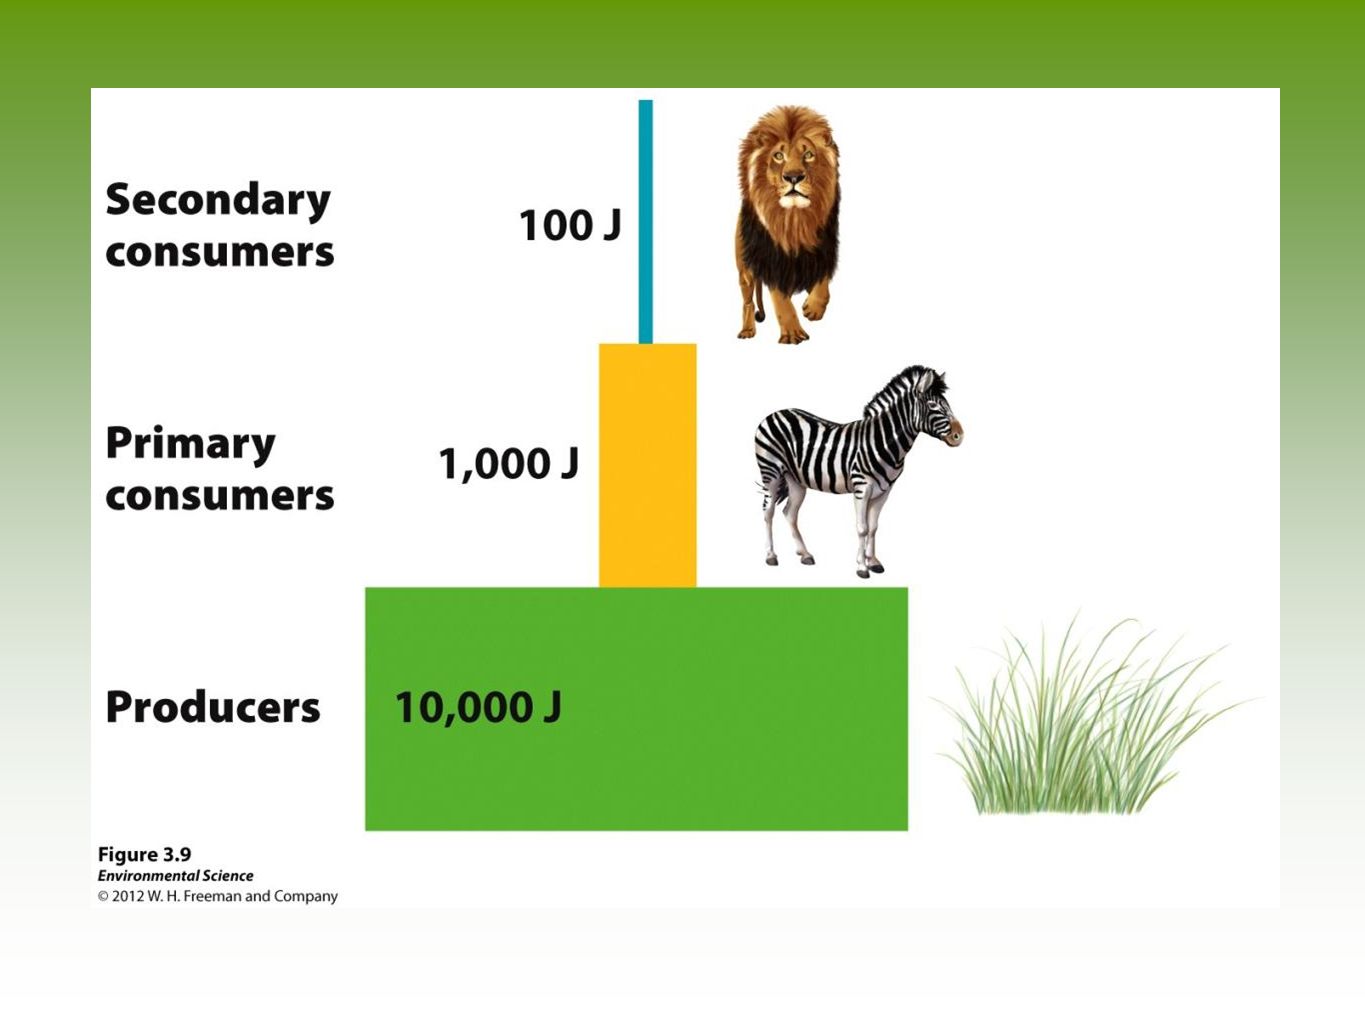
Ecological Efficiency
10% rule Only about 10% of the available biomass at each trophic level can be converted into energy at the next level. REPRESENTED BY THE TROPHIC PYRAMID

36
Suppose all humans decided to become vegetarians….
1 acre of cropland = 1,000 kg soybeans 10x more food available if eaten raw reather than feeding to beef to eat meat. 1kg of soybeans = 2.5x calories as beef 1 acre would produce 25x more caloires. MORE LAND REQUIRED TO BE SECONDARY CONSUMER!

37
Checkpoint… Why is photosynthesis an important process?

38
Checkpoint… What determines the productivity of an ecosystem?

39
Checkpoint… How efficiently is energy transferred between trophic levels in an ecosystem?

40
STOP HERE Make a list of what you ate today for lunch and where it came from (animals, plants etc.) Make a trophic pyramid and place all organisms in each level. At which level did you get most of your energy?

41
Matter cycles through the biosphere
Biosphere- The combination of all ecosystems on Earth. Biogeochemical cycles- The movement of matter within and between ecosystems involving biological, geologic and chemical processes. IWhat type of system is this?

42
The Hydrologic Cycle The movement of water through the biosphere.

44
The Hydrologic Cycle Transpiration- The process where plants release water from their leaves into the atmosphere. Evapotranspiration- The combined amount of evaporation and transpiration. (often used to measure water through an ecosystem) Runoff- When water moves across the land surface into streams and rivers, eventually reaching the ocean.
 Runoff- When water moves across the land surface into streams and rivers, eventually reaching the ocean.")
45
Human Activities and Hydrologic Cycle
Havesting Trees Paving Roads Diverting Water

46
The Carbon Cycle

47
Carbon Cycle Photosynthesis (plants) Respiration (animals)
Exchange (atmosphere and ocean) Sedimentation and burial Extraction (recent phenomenon) Combustion (fossil fuels/timber) Faster processes involve living organisms.
 Sedimentation and burial. Extraction (recent phenomenon) Combustion (fossil fuels/timber) Faster processes involve living organisms.")
48
Carbon Cycle Producers – water Consumers – food
Decomposers – dead organisms During Decomposition elements become available to producers again.

49
The Nitrogen Cycle

50
Nitrogen Cycle Step 1 Only a few organisms can conver Nigrogen into ammonia. By NITROGEN FIXATION Cyanobacteria, bacteria in legume roots Enzymes break nitrogen bond and add hydrogen to form ammonia and ammonium in the soil. Bacteria excrete ammonium into plant roots and plant gives bacteria sugars. LIGHTENING/COMBUSTION – Nitrogen to nitrate

51
Step 2 - Assimilation Nitrogen assimilated into tissues

52
Step 3 - Ammonification Decomposers use nitrogen wastes and dead bodies as food and excrete ammonium

53
Step 4 - Nitrification Bacteria convert ammonium into nitrite and then nitrate (minor importance but can be used by producers)
")
54
Step 5 - Denitrification
Nitrate is transported through soil (leaching) Bacteria in waterloggged soil convert nitrate into nitrous oxide and nitrogen gas and put back into the atmosphere.
 Bacteria in waterloggged soil convert nitrate into nitrous oxide and nitrogen gas and put back into the atmosphere.")
55
The Phosphorus Cycle

56
Ecosystems respond to disturbance
Disturbance- An event caused by physical, chemical or biological agents that results in changes in population size or community composition.

58
Watershed Studies Watershed- All of the land in a given landscape that drains into a particular stream, river, lake or wetland.

60
Resistance versus Resilience
Resistance- A measure of how much a disturbance can affect its flows of energy and matter. Resilience- The rate at which an ecosystem returns to its original state after a disturbance. Restoration ecology- A new scientific discipline that is interested in restoring damaged ecosystems.

61
The Intermediate Disturbance Hypothesis
The intermediate disturbance hypothesis- states that ecosystems experiencing intermediate levels of disturbance are more diverse than those with high or low disturbance levels.

63
Ecosystems Provide Valuable Services
Instrumental vs Intrinsic

64
Instrumental Values of Ecosystems
Provisions- Goods that humans can use directly. Regulating services- The service provided by natural systems that helps regulate environmental conditions. Support systems- The support services that natural ecosystems provide such as pollination, natural filters and pest control. Resilience- Resilience of an ecosystem ensures that it will continue to provide benefits to humans. This greatly depends on species diversity. Cultural services- Ecosystems provide cultural or aesthetic benefits to many people.

Similar presentations