Download presentation
Presentation is loading. Please wait.

1
NATIONAL TRIBAL FORUM ON AIR QUALITY 2013 Establishment of a PM 2.5 Monitoring Network on the Colville Reservation

2
Confederated Tribes of the Colville Reservation 1.4 Million Acres 12 Bands 7,587 residents 3.5 people per square mile Major employers - Tribal, County, State and Federal governments Lands in both fee (20%) and trust (80%) status
 and trust (80%) status")
3
The Paper Chase

4
MY BOSS COUNCIL MEMBERSHIP EPA MY REPLACEMENT Write for Your Audiance

5
Establish the Need to Monitor Technical Guidance for the Development of Tribal Air Monitoring Programs, EPA-456/B-07- 002, August, 2007 Identifying goals and objectives Costs for operations Funding sources Monitoring Implementation Data acquisition, management and reporting Data analysis and interpretation

6
ASSESSMENTS NEED TO INCLUDE 1. BACKGROUND 2. AIRSHED DESCRIPTION 3. AIR POLLUTION SOURCE 4. DATA SUMMARY, WHAT IS KNOW 5. DEGRADATION OF VISIBILITY 6. RECOMMENDATIONS Guidance for Conducting Tribal Air Quality Assessments, Region 10

7
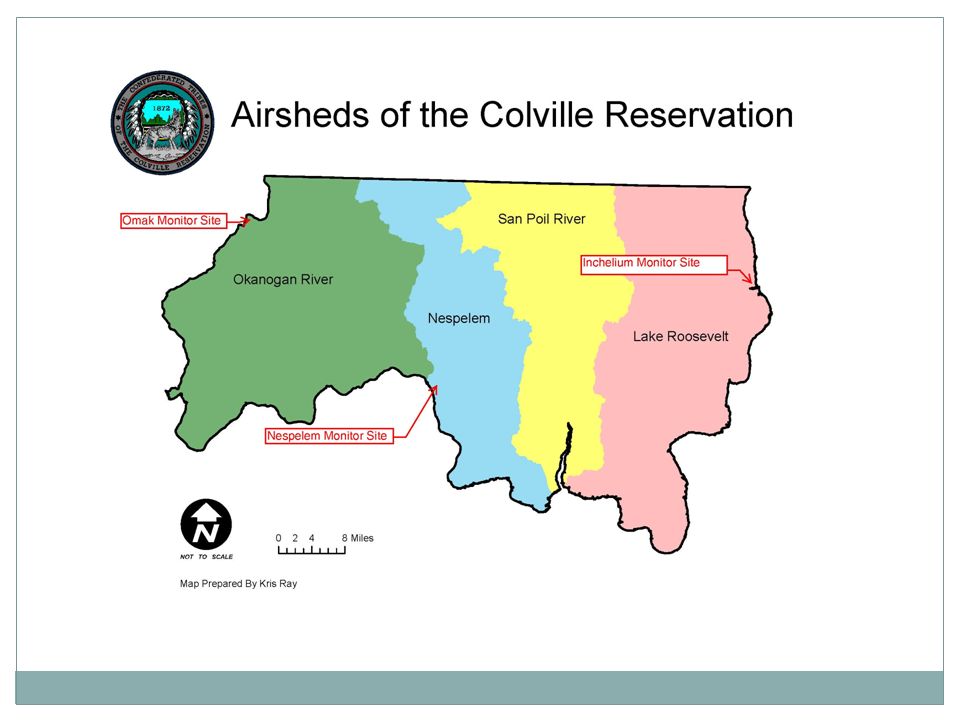
Goals and Objectives Determine if air quality affects the health of the communities by comparing with the National Ambient Air Quality Standards (NAAQS) for particulate matter 2.5 microns To serve as baseline data so that changes in air quality can be tracked To provide pollution levels when calling burn bans on the Reservation
 for particulate matter 2.5 microns To serve as baseline data so that changes in air quality can be tracked To provide pollution levels when calling burn bans on the Reservation")
8
Unlock EPA Funds Convince the EPA Costs of a Monitoring Network Conference calls Document preparation Know the subject better than EPA

9
Community Assessments Air Quality Assessment Inchelium Monitor Feasibility and Evaluation September 28, 2009 And Air Quality Assessment Nespelem Monitor Feasibility and Evaluation December 29, 2010

10
Criteria for Choosing a Monitor Permanent Continuous monitor PM 2.5 Cost FRM or FEM Data Logger Automatic Span Checks Filter Change Time Measurement Range Resolution Precision Frequency of Site Visits Enclosure Type

11
Comparison of Air Quality Monitor Models, Confederated Tribes of the Colville Reservation Characteristics Met One Instruments Inc. BAM 1020 Thermo Scientific FH 62 C14 Series Thermo Scientific Monitor, Model 5014i Beta Thermo Scientific SHARP Monitor, Model 5030 Thermo Scientific TEOM 1405 American Ecotech Aurora 1000 Integrating Nephelometer American Ecotech Aurora 2000 PM Correlation Nephelometer American Ecotech Aurora 3000 3 Wavelength Nephelometer American Ecotech Aurora 4000 Polar Nephelometer Radiance Research Nephelometer Type of MonitorBAM Duel - BAM & Nephelometer TEOMNephelometer Nephelometer with interface to BAM possible Nephelometer FEMYes YESYesNo FRMNo Measures Non-Volatile PM 2.5Yes Measures Volatile PM 2.5Yes ?Yes Continuous ReadingsNoYes Permanent installationYes YESYes Data loggerYes YESYes Embedded FTP Server Yes Outdoor enclosure neededYes YESYes Humidity RegulationYesOptionYESYes Frequency of site visits30 daysLong termYearlyLong term Automatic span checksHourly Option Yes Option WDOE Filter Change Time60 DaysLong time Air Pump TypeVacuum Data Averaging Times1 & 24 Hour Measurement Range 0 – 1.000 mg/m3 (0 - 1000 μg/m3) 0 to 5,000 μg/m3 or 0 to 10,000 μg/m3 0 to 1.0, 2.0, 3.0, 5.0, 10.0mg/m 3 ; 0 to 100, 1000, 2000, 3000, 5000, 10,000µg/m 3 0 to 1,000 μg/m3 and 0 to 10,000 μg/m3 0 to 1 g/m30 - 10,000 Mm-1 0 to > 1 km-1 Resolution0.1 μg/m3 ± 1 μg/m3 (instantaneous) 0.1 μg/m3 <0.5 μg/m3 @ 2 (1-hour time resolution) 0.1 µg/m3 Precision ± 2 μg/m3 (24- hour) ±2.0µg/m 3 80µg/m 3 (24-hour average +/- 2 μg/m3 80μg/m3 ±2.0 µg/m3 at 1 hour and ±1.0 µg/m3 at 24 hours Accuracy for Mass Measurement Exceeds US-EPA Class III PM2.5 FEM standards for additive and multiplicative bias ±5% using NIST- traceable mass foil set +/- 5% (compared to 24 hour FRM) ±0.75% Weight54 lbs.50 lbs.40 lbs.50 lbs.75 lbs.25 lbs.26.5 lbs.25 lbs. 6 lbs.
 0 to 5,000 μg/m3 or 0 to 10,000 μg/m3 0 to 1.0, 2.0, 3.0, 5.0, 10.0mg/m 3 ; 0 to 100, 1000, 2000, 3000, 5000, 10,000µg/m 3 0 to 1,000 μg/m3 and 0 to 10,000 μg/m3 0 to 1 g/m ,000 Mm-1 0 to > 1 km-1 Resolution0.1 μg/m3 ± 1 μg/m3 (instantaneous) 0.1 μg/m3 <0.5 2 (1-hour time resolution) 0.1 µg/m3 Precision ± 2 μg/m3 (24- hour) ±2.0µg/m 3 80µg/m 3 (24-hour average +/- 2 μg/m3 80μg/m3 ±2.0 µg/m3 at 1 hour and ±1.0 µg/m3 at 24 hours Accuracy for Mass Measurement Exceeds US-EPA Class III PM2.5 FEM standards for additive and multiplicative bias ±5% using NIST- traceable mass foil set +/- 5% (compared to 24 hour FRM) ±0.75% Weight54 lbs.50 lbs.40 lbs.50 lbs.75 lbs.25 lbs.26.5 lbs.25 lbs. 6 lbs..")
12
What was need after EPA Approved Funding Quality Assurance Project Plan (QAPP) Approved May 2012 Standard Operating Procedures (SOPs) BAM 1020 Meteorological Sensors
 Approved May 2012 Standard Operating Procedures (SOPs) BAM 1020 Meteorological Sensors")
13
The Network Now Omak – Radiance Research Nephelometer Cooperative with Washington State Department of Ecology Use their QAPP and SOPs Began operation in 2010 Nespelem – Met One BAM 1020 Purchased in 2005 Began operation in 2009 Permanent setup in 2012 Inchelium – Met One BAM 1020 Purchased in 2011 Permanent setup in 2012 E-BAM – Met One Purchased in 2012 Selected locations

14
Site Construction Permission for site Electricity to site Fence construction Build platform Install cabinet Install monitor Trial operation

16
What do the Monitors Pickup Wildfire Smoke Saw Mill Wood Stove Smoke Asphalt Batch Plant Dump Fires

17
HOW THE DATA IS USED OmakNespelem Inchelium AQIHours% % % Good 31960%27653%43996% Moderate 11121%13626%174% Unhealthy for Sensitive Groups 9518%6613% Unhealthy 31%234% Very Unhealthy 163% Hazardous 41% Total Hours 528 521 456

18
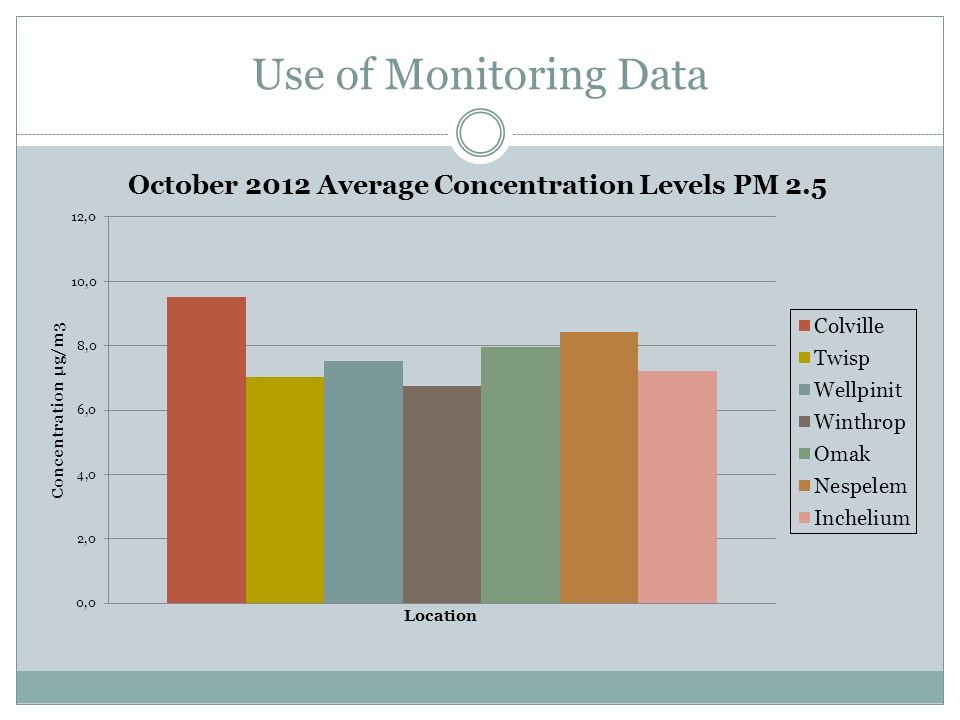
Use of Monitoring Data

23
Questions Contact: Kris Ray Air Quality Program Manager Confederated Tribes of the Colville Reservation 509-634-2418 kris.ray@colvilletribes.com

Similar presentations


 Center 541-223-1402>")


 Demonstration Puget Sound Clean Air Agency Mike Gilroy, Erik Saganic Puget Sound Clean Air.>")


 Non-Attainment Areas – Visibility Protection.>")


>")

