Download presentation
Presentation is loading. Please wait.

1
BANK OF UTAH OFFICER’S MEETING UTAH’S ECONOMIC FORECAST JAMES WOOD BUREAU OF ECONOMIC AND BUSINESS RESEARCH DAVID ECCLES SCHOOL OF BUSINESS UNIVERSITY OF UTAH February 7, 2006

2
CHANGE IN UTAH’S ECONOMIC INDICATORS Category200420052006 Nonag. Employment (% chg.)2.8%3.5%3.3% Unemp. Rate5.2%4.7%4.5% Total Wages (% chg.)6.4%7.8%6.8% Population (% chg.)1.6%3.2%2.9% Average Annual Pay (% chg.)3.5%3.8%3.4% Net Migration (000)18.440.637.0 New Auto/Truck Sales (000)101.4107.6105.5 Residential Units (000)24.328.026.0 Residential Valuation (million)$3,552.6$4,600.0$4,620.0 NonRes. Valuation (million)$1,089.9$1,200.0$1,400.0 Taxable Retail Sales (billion)$20.4$22.0$23.5
2.8%3.5%3.3% Unemp. Rate5.2%4.7%4.5% Total Wages (% chg.)6.4%7.8%6.8% Population (% chg.)1.6%3.2%2.9% Average Annual Pay (% chg.)3.5%3.8%3.4% Net Migration (000) New Auto/Truck Sales (000) Residential Units (000) Residential Valuation (million)$3,552.6$4,600.0$4,620.0 NonRes. Valuation (million)$1,089.9$1,200.0$1,400.0 Taxable Retail Sales (billion)$20.4$22.0$23.5.")
3
END-OF-YEAR MOMENTUM November and December employment two highest months of the year – 41,000 and 44,000. Net in-migration all time record of 41,000. Previous high 30,000 in 1994. Population increase record 78,000. Third quarter taxable sales rose 13.8%, fastest in 12 yrs. Biggest fourth qtr. ever in homebuilding – 7,000 units. Passenger traffic at airport up 23% in third qtr. – 6 mil. Third qtr. vehicle sales up 21% to 29,800. Highest qtr. ever. Hotel occupancy rises to 73.1% Expectations: homebuilders, estimators, ABC, sheet metal contractors, mechanical contractors, concrete ass’n.

4
UTAH AVERAGE ANNUAL PAY AS PERCENT OF U.S. AVERAGE (Source: U.S. Bureau of Labor Statistics)
")
5
TOP SECTORS IN EMPLOYMENT GROWTH (Average Wage - $30,612) (Source: Utah Department of Workforce Services) SectorNew Jobs in 2005 Total JobsAvg. Wage 2003 Construction10,00085,100$30,528 Prof & Bus.8,600150,700$34,668 Health5,000132,600$28,224 Retail3,000144,500$22,440 Leisure2,600106,200$12,576

6
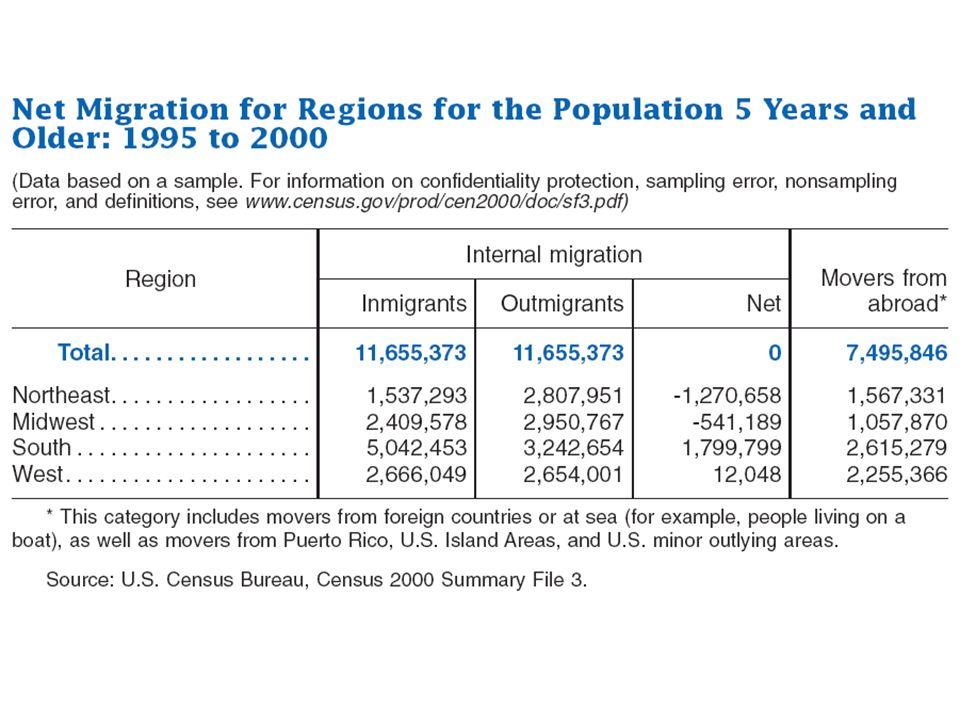
NET MIGRATION AND NEW RESIDENTIAL UNITS IN UTAH

9
Utah = 9.0% U.S. = 12.5%

10
RESIDENTIAL BUILDING PERMITS IN UTAH (Bureau of Economic and Business Research, University of Utah) Cycle 1 Cycle 2 Cycle 3 Cycle 4
 Cycle 1 Cycle 2 Cycle 3 Cycle 4")
11
Change in Sales Price of Existing Homes in Utah, Metro. Area and Salt Lake County Data Source 1980199020002005Average Annual Growth Rate for Period 1980- 1990 1990- 2000 2000- 2005 1980- 2005 Office of Federal Housing Oversight (Statewide Index) 100.0117.5236.9286.51.6%7.3%3.9%4.3% National Assoc. of Realtors (Salt Lake MSA) $65,800$69,400$141,500$181,4000.9%7.4%3.7%5.1% Wasatch Front Reg. MLS (Salt Lake County) $67,949$83,951$176,479$224,4702.1%7.7%4.9%
 %7.3%3.9%4.3% National Assoc. of Realtors (Salt Lake MSA) $65,800$69,400$141,500$181,4000.9%7.4%3.7%5.1% Wasatch Front Reg. MLS (Salt Lake County) $67,949$83,951$176,479$224,4702.1%7.7%4.9%.")
12
Median Sales Price of Existing Homes (Source: National Association of Realtors)
")
Similar presentations

 from the previous quarter, seasonally adjusted and trend-adjusted, annual.>")


 forbid the unauthorized reproduction of this report by any means, including.>")


 forbid the unauthorized reproduction of this report by any means, including facsimile.>")


