Download presentation
Presentation is loading. Please wait.

1
Pollution Control Strategies – A Chemists Perspective National centre for catalysis Research Indian Institute of Technology Madras Chennai 600 036 April 2009 National centre for catalysis Research Indian Institute of Technology Madras Chennai 600 036 April 2009

2
Why this topic?

3
Environmental pollution has many facets, and the resultant health risks include diseases in almost all organ systems.

4
Each pollutant has its own health risk profile, which makes summarizing all relevant information into a single unit is difficult. That is why we have decided to make a series of presentations on this topic. You will be listening to a number of presentations on various aspects of this topic. Nevertheless, public health practitioners and decision makers in developing countries need to be aware of the potential health risks caused by air and water pollution and to know where to find the more detailed information required to handle a specific situation

5
Estimates indicate that the proportion of the global burden of disease associated with environmental pollution hazards ranges from 23 percent (WHO 1997) to 30 percent (Smith, Corvalan, and Kjellstrom 1999). These estimates include infectious diseases related to drinking water, sanitation, and food hygiene; respiratory diseases related to severe indoor air pollution from biomass burning; and vectorborne diseases with a major environmental component, such as malaria. These three types of diseases each contribute approximately 6 percent to the updated estimate of the global burden of disease (WHO 2002). As the World Health Organization (WHO) points out, outdoor air pollution contributes as much as 0.6 to 1.4 percent of the burden of disease in developing regions, and other pollution, such as lead in water, air, and soil, may contribute 0.9 percent (WHO 2002). These numbers may look small, but the contribution from most risk factors other than the “top 10” is within the 0.5 to 1.0 percent range (WHO 2002).
. As the World Health Organization (WHO) points out, outdoor air pollution contributes as much as 0.6 to 1.4 percent of the burden of disease in developing regions, and other pollution, such as lead in water, air, and soil, may contribute 0.9 percent (WHO 2002). These numbers may look small, but the contribution from most risk factors other than the top 10 is within the 0.5 to 1.0 percent range (WHO 2002)..")
6
Air Pollution Air pollutants are usually classified into suspended particulate matter (PM) (dusts, fumes, mists, and smokes); gaseous pollutants (gases and vapors); and odors. Suspended PM can be categorized according to total suspended particles: the finer fraction, PM10, which can reach the alveoli, and the most hazardous, PM2.5 (median aerodynamic diameters of less than 10.0 microns and 2.5 microns, respectively). Much of the PM2.5 consists of secondary pollutants created by the condensation of gaseous pollutants—for example, sulfur dioxide (SO2) and nitrogen dioxide (NO2). Types of suspended PM include diesel exhaust particles; coal fly ash; wood smoke; mineral dusts, such as coal, asbestos, limestone, and cement; metal dusts and fumes; acid mists (for example,sulfuric acid); and pesticide mists. Gaseous pollutants include sulfur compounds such as SO2 and sulfur trioxide; carbon monoxide; nitrogen compounds such as nitric oxide, NO2, and ammonia; organic compounds such as hydrocarbons; volatile organic compounds; polycyclic aromatic hydrocarbons and halogen derivatives such as aldehydes; and odorous substances. Volatile organic compounds are released from burning fuel (gasoline, oil, coal, wood, Charcoal, natural gas and so on. solvents; paints; glues; and other products commonly used at work or at home. Volatile organic compounds include such chemicals as benzene, toluene, methylene chloride, and methyl chloroform. Emissions of nitrogen oxides and hydrocarbons react with sunlight to eventually form another secondary pollutant, ozone, at ground level. Ozone at this level creates health concerns, unlike ozone in the upper atmosphere, which occurs naturally and protects life by filtering out ultraviolet radiation from the sun.
. Much of the PM2.5 consists of secondary pollutants created by the condensation of gaseous pollutants—for example, sulfur dioxide (SO2) and nitrogen dioxide (NO2). Types of suspended PM include diesel exhaust particles; coal fly ash; wood smoke; mineral dusts, such as coal, asbestos, limestone, and cement; metal dusts and fumes; acid mists (for example,sulfuric acid); and pesticide mists. Gaseous pollutants include sulfur compounds such as SO2 and sulfur trioxide; carbon monoxide; nitrogen compounds such as nitric oxide, NO2, and ammonia; organic compounds such as hydrocarbons; volatile organic compounds; polycyclic aromatic hydrocarbons and halogen derivatives such as aldehydes; and odorous substances. Volatile organic compounds are released from burning fuel (gasoline, oil, coal, wood, Charcoal, natural gas and so on. solvents; paints; glues; and other products commonly used at work or at home. Volatile organic compounds include such chemicals as benzene, toluene, methylene chloride, and methyl chloroform. Emissions of nitrogen oxides and hydrocarbons react with sunlight to eventually form another secondary pollutant, ozone, at ground level. Ozone at this level creates health concerns, unlike ozone in the upper atmosphere, which occurs naturally and protects life by filtering out ultraviolet radiation from the sun..")
7
Facilities that May Emit: Air Toxics Rule 224-230 New and modified sources Rule 231 Cancer risk assessment screening methodology Rule 232 Methodology for determining initial threshold screening level Carbon Monoxide Rule 930 Ferrous cupola operations Collected Air Contaminants Rule 370 Collected air contaminants Fugitive Dust Rule 371-372 Fugitive dust control programs Act 451 Sections 5524 and 5525 General Air Contaminants and Water Vapor Rule 901 Air contaminants and water vapor, when prohibited Major Sources of Contaminants Rule 220 Major offsets sources and modifications in nonattainment areas Particulate Matter - Part 3. Emission Limitations and Prohibitions Rule 301 Standards for density of emission Rule 310 Open burning Rule 330 Electrostatic precipitator control system Rule 331 Emission of particulate matter Control and Pollution Prevention Strategies 2004 Page 4 Cement Manufacturing Rule 331 Emission of particulate matter

8
Sulfur-Bearing Compounds - Part 4. Emission Limitations and Prohibitions Rule 401 Power Plants Rule 402 Fuel-burning sources other than power plants Rule 403 Oil and natural gas facilities Rule 404 Sulfuric acid plants Volatile Organic Compounds - Part 6. Existing Sources and Part 7. New Sources Rule 601 Definition of existing source Rule 602 General provisions for existing sources of volatile organic compounds Rule 701 Definition of new source Rule 702 General provisions for new sources of volatile organic compounds Facilities of These General Industry Types: Asphalt Manufacture and Usage Rule 331 Emission of particulate matter Rule 618 Use of cutback paving asphalt 1 Updated and adapted from: Guidebook to Michigan’s Air Quality Installation and Operating Permit Applications, Project ACCESS, The University of Michigan - Flint, 1989.

9
Dry Cleaning Rule 619 Perchlorethylene emissions Fertilizer Plants Rule 331 Emission of particulate matter Oil or Natural Gas Producing, Processing, or Transporting Facilities Rule 403 Emissions; operation Rule 629 Natural gas processing emissions Petroleum Refineries Rule 615 Vacuum-producing systems Rule 616 Process unit turnarounds Rule 617 Organic compound-water separators Rule 622 Emissions of volatile organic compounds Rule 1103 Continuous Emission Monitoring Pharmaceutical Production Rule 625 Emissions of volatile organic compounds from existing equipment

10
Power Plants Rule 331 Emission of particulate matter Rule 401 Emission of sulfur dioxide Rule 1101 Continuous Emission Monitoring for fossil fuel-fired steam generators Steel Manufacturing Rule 331 Emission of particulate matter Rule 349 Coke oven compliance date Rule 350 Emissions from larry-car charging Rule 351 Charging hole emissions Rule 352 Pushing operation fugitive emissions Rule 353 Standpipe assembly emissions during coke cycle Rule 354 Standpipe assembly emissions during decarbonization Rule 355 Coke oven gas collect main emissions Rule 356 Coke oven door emission: doors 5 meters or shorter Rule 357 Coke oven door emissions; doors taller than 5 meters Rule 358 Roof monitor visible emissions from blast furnaces and electric arc furnaces Rule 359 Visible emissions from scarfer operation stacks Rule 360 Visible emissions from coke oven push stacks Rule 361 Visible emissions from blast furnace casthouse operations Rule 362 Visible emissions from electric arc furnace operations Rule 363 Visible emissions from argon-oxygen decarbonization operations Rule 364 Visible emissions from basic oxygen furnaces Rule 365 Visible emissions from hot metal transfer operations Rule 366 Visible emissions from hot metal desulphurization operations Sulfuric Acid Plants Rule 404 Emission of sulfuric acid mist Control and Pollution Prevention Strategies 2004 Page 5 Rule 1102 Continuous Emission Monitoring

11
Facilities with These Types of Equipment or Processes: Chemical and Mineral Kilns Rule 331 Emission of particulate matter Coating Lines (Existing coating lines) Rule 610 Emission rates for automobile, light-duty truck, and other coatings Rule 620 Emissions from coating of flat wood paneling Rule 621 Emissions from coating of metallic surfaces Rule 632 Emissions from plastic parts coating lines for automobiles, trucks and business machines Rule 1041 Recordkeeping requirements Coke Ovens Rule 349 Coke oven compliance date Rule 350 Emissions from larry-car charging Rule 351 Charging hole emissions Rule 352 Pushing operation fugitive emissions Rule 353 Standpipe assembly emissions during coke cycle Rule 354 Standpipe assembly emissions during decarbonization Rule 355 Coke oven gas collect main emissions Rule 356 Coke oven door emission; doors 5 meters or shorter Rule 357 Coke oven door emissions; doors taller than 5 meters Rule 360 Visible emissions from coke oven push stacks
 Rule 610 Emission rates for automobile, light-duty truck, and other coatings Rule 620 Emissions from coating of flat wood paneling Rule 621 Emissions from coating of metallic surfaces Rule 632 Emissions from plastic parts coating lines for automobiles, trucks and business machines Rule 1041 Recordkeeping requirements Coke Ovens Rule 349 Coke oven compliance date Rule 350 Emissions from larry-car charging Rule 351 Charging hole emissions Rule 352 Pushing operation fugitive emissions Rule 353 Standpipe assembly emissions during coke cycle Rule 354 Standpipe assembly emissions during decarbonization Rule 355 Coke oven gas collect main emissions Rule 356 Coke oven door emission; doors 5 meters or shorter Rule 357 Coke oven door emissions; doors taller than 5 meters Rule 360 Visible emissions from coke oven push stacks")
12
Cold Cleaners Rule 611 Operation of existing cold cleaners Rule 613 Operation of existing conveyorized cold cleaners Rule 707 Operation of new cold cleaners Rule 709 Operation of new conveyorized cold cleaners Exhaust Systems serving material handling equipment Rule 331 Emission of particulate matter Foundry Operations Rule 331 Emission of particulate matter Rule 930 Emissions of carbon monoxide Fuel Burning Operations Rule 331 Emission of particulate matter Rule 402 Emission of sulfur dioxide Rule 1101 Continuous emission monitoring for fossil fuel-fired steam generators Control and Pollution Prevention Strategies 2004 Page 6 Graphic Art Lines Rule 624 Emissions of volatile organic compounds Rule 1040 Method for determining emissions Rule 1041 Recordkeeping requirements Incinerator Operations Rule 331 Emission of particulate matter Iron Ore Pelletizing Rule 331 Emission of particulate matter

13
Loading Delivery Vessels with Gasoline and Other Organic Compounds Rule 606-607 Loading gasoline into existing stationary vessels Rule 608 Loading gasoline into existing delivery vessels Rule 609 Loading organic compounds into existing delivery vessels Rule 627 Delivery vessels; vapor collection systems Rule 703-704 Loading gasoline into new stationary vessels Rule 705 Loading gasoline into new delivery vessels Rule 706 Loading organic compounds into new delivery vessels Oxygen Furnace Operations Rule 364 Visible emissions from basic oxygen furnace operations Paint Manufacturing Rule 630 Emission of volatile organic compounds Resin and Polystyrene Manufacturing Rule 631 Emission of volatile organic compounds Sintering Operations Rule 367 Visible emissions from sintering operations Storage of Organic Compounds Rule 604-605 Storage of organic compounds Rule 623 Storage of petroleum liquids Rule 627 Delivery vessels; vapor collection system Synthetic Organic Chemicals Rule 628 Emission of volatile organic compounds Vapor Degreasers Rule 612 Operation of existing open top vapor degreasers Rule 651 Standards for degreasers Rule 614 Operation of existing conveyorized vapor degreasers Rule 708 Operation of new open top vapor degreasers Rule 710 Operation of new conveyorized vapor degreasers Control and Pollution Prevention Strategies 2004 Page 7 Some of the rules of one state or one region is shown in these slides

14
Disease control measures for people working or living around a smelter may be quite different from those for people living near a tannery or a brewery. For detailed information about industry-specific pollution control methods one has to go to the detailed information on each industry and relevant information. We have attempted to summarize the information in the following table.

15
Table Selected Industrial Sectors and Their Contribution to Air and Water Pollution and to Workplace Hazards Industrial sectorAirWaterWork Place Base metal and iron ore miningPMToxic metal sludgeSilica Cement manufacturingPMSludgeSilica Coalmining and productionPM, coal dustSludge Coal dust,Silica Copper smeltingArsenic Arsenic, cadmium Electricity generationPM, SO 2 Hot waterSO 2 FoundriesPMSolventsSilica, solvents Iron and steel smeltingPMSludgeCarbon monoxide, nickel Lead and zinc smeltingPM, SO 2, lead, cadmium, Arsenic Lead, cadmium, arsenicPM, SO 2, lead cadmium, arsenic Meat processing and renderingOdorHigh biological oxygen demandInfections Oil and gas developmentSO 2, carcinogensOilHydrocarbons Pesticide manufacturingPesticides and toxic Intermediates Pesticides and toxic intermediates Petrochemicals manufacturingSO 2 OilHydrocarbons Petroleum refiningSO 2 Sludge, hydrocarbonsHydrocarbons Phosphate fertilizer plantsPMNutrients Pulp and paper millsOdorHigh biological oxygen demand, mercuryChlorine Tanning and leather finishingOdorChromium, acidsChromium acids Textile manufacturingToxic dyes a. In all the cases, the workplaces are subject to risk of injury, noise, dust, and excessively hot or cold temperatures, Source: World Bank 1999

16
Sources of Outdoor Air Pollution. Outdoor air pollution is caused mainly by the combustion of petroleum products or coal by motor vehicles, industry, and power stations. In some countries, the combustion of wood or agricultural waste is another major source. Pollution can also originate from industrial processes that involve dust formation (for example, from cement factories and metal smelters) or gas releases (for instance, from chemicals production). Indoor sources also contribute to outdoor air pollution, and in heavily populated areas, the contribution from indoor sources can create extremely high levels of outdoor air pollution. Motor vehicles emit PM, nitric oxide and NO2 (together referred to as NOx), carbon monoxide, organic compounds, and lead. Lead is a gasoline additive that has been phased out in industrial countries, but some developing countries still use leaded gasoline. Mandating the use of lead-free gasoline is an important intervention in relation to health. The concept of three way catalyst – the principle and adoptation. Depends on various parameters like lean or rich, petrol or diesel and many other operating conditions.
 or gas releases (for instance, from chemicals production). Indoor sources also contribute to outdoor air pollution, and in heavily populated areas, the contribution from indoor sources can create extremely high levels of outdoor air pollution. Motor vehicles emit PM, nitric oxide and NO2 (together referred to as NOx), carbon monoxide, organic compounds, and lead. Lead is a gasoline additive that has been phased out in industrial countries, but some developing countries still use leaded gasoline. Mandating the use of lead-free gasoline is an important intervention in relation to health. The concept of three way catalyst – the principle and adoptation. Depends on various parameters like lean or rich, petrol or diesel and many other operating conditions..")
17
Catastrophic emissions of organic chemicals, as occurred in Bhopal, India, in 1984, can also have major health consequences (McGranahan and Murray 2003; WHO 1999). Another type of air pollution that can have disastrous consequences is radioactive pollution from a malfunctioning nuclear power station, as occurred in Chernobyl in 1986 (WHO 1996). Radioactive isotopes emitted from the burning reactor spread over large areas of what are now the countries of Belarus, the Russian Federation, and Ukraine, causing thousands of cases of thyroid cancer in children and threatening to cause many cancer cases in later decades.
. Radioactive isotopes emitted from the burning reactor spread over large areas of what are now the countries of Belarus, the Russian Federation, and Ukraine, causing thousands of cases of thyroid cancer in children and threatening to cause many cancer cases in later decades..")
18
Exposure to Air Pollutants. The extent of the health effects of air pollution depends on actual exposure. Total daily exposure is determined by people’s time and activity patterns, and it combines indoor and outdoor exposures. Young children and elderly people may travel less during the day than working adults, and their exposure may therefore be closely correlated with air pollution levels in their homes. Children are particularly vulnerable to environmental toxicants because of their possibly greater relative exposure and the effects on their growth and physiological development. Meteorological factors, such as wind speed and direction, are usually the strongest determinants of variations in air pollution, along with topography and temperature inversions. Therefore, weather reports can be a guide to likely air pollution levels on a specific day.

19
Workplace air is another important source of air pollution exposure. Resource extraction and processing industries, which are common in developing countries, emit Air and Water Pollution: Burden and Strategies for Control dust or hazardous fumes at the worksite. Such industries include coalmining, mineral mining, quarrying, and cement production. Developed countries have shifted much of their hazardous production to developing countries (LaDou 1992). This shift creates jobs in the developing countries, but at the price of exposure to air pollution resulting from outdated technology. In addition, specific hazardous compounds, such as asbestos, have been banned in developed countries (Kazan- Allen 2004), but their use may still be common in developing countries. Impacts on Health. Epidemiological analysis is needed to quantify the health impact in an exposed population. The major pollutants emitted by combustion have all been associated with increased respiratory and cardiovascular morbidity and mortality (Brunekreef and Holgate 2002). The most famous disease outbreak of this type occurred in London in 1952 (U.K. Ministry of Health 1954), when 4,000 people died prematurely in a single week because of severe air pollution, followed by another 8,000 deaths during the next few months (Bell and Davis 2001). In the 1970s and 1980s, new statistical methods and improved computer technology allowed investigators to study mortality increases at much lower concentrations of pollutants. A key question is the extent to which life has been shortened. Early loss of life in elderly people, who would have died soon regardless of the air pollution, has been labeled mortality displacement, because it contributes little to the overall burden of disease (McMichael and others 1998).
. This shift creates jobs in the developing countries, but at the price of exposure to air pollution resulting from outdated technology. In addition, specific hazardous compounds, such as asbestos, have been banned in developed countries (Kazan- Allen 2004), but their use may still be common in developing countries. Impacts on Health. Epidemiological analysis is needed to quantify the health impact in an exposed population. The major pollutants emitted by combustion have all been associated with increased respiratory and cardiovascular morbidity and mortality (Brunekreef and Holgate 2002). The most famous disease outbreak of this type occurred in London in 1952 (U.K. Ministry of Health 1954), when 4,000 people died prematurely in a single week because of severe air pollution, followed by another 8,000 deaths during the next few months (Bell and Davis 2001). In the 1970s and 1980s, new statistical methods and improved computer technology allowed investigators to study mortality increases at much lower concentrations of pollutants. A key question is the extent to which life has been shortened. Early loss of life in elderly people, who would have died soon regardless of the air pollution, has been labeled mortality displacement, because it contributes little to the overall burden of disease (McMichael and others 1998)..")
20
Long-term studies have documented the increased cardiovascular and respiratory mortality associated with exposure to PM (Dockery and others 1993; Pope and others 1995). The Bhopal Catastrophe The Bhopal plant, owned by the Union Carbide Corporation, produced methyl isocyanate, an intermediate in the production of the insecticide carbaryl. On December 2, 1984, a 150,000-gallon storage tank containing methyl isocyanate apparently became contaminated with water, initiating a violent reaction and the release of a cloud of toxic gas to which 200,000 people living near the plant were exposed. Low wind speed and the high vapor pressure of methyl isocyanate exacerbated the severity of toxic exposure, resulting in the immediate death of at least 6,000 people. The dominating nonlethal effects of this emission were severe irritation of the eyes, lungs, and skin. Effects on the nervous system and reproductive organs were also reported. The reaction of methyl isocyanate with water had a corrosive effect on the respiratory tract, which resulted in extensive necrosis, bleeding, and edema. Treatment was impeded by the unknown and disputed composition of the gas cloud and a lack of knowledge about its health effects and about antidotes. Source: Dhara and Dhara 2002.

21
A 16-year follow-up of a cohort of 500,000 Americans living in different cities found that the associations were strongest with PM2.5 and also established an association with lung cancer mortality (Pope and others 2002). Another approach is ecological studies of small areas based on census data, air pollution information, and health events data (Scoggins and others 2004), with adjustments for potential confounding factors, including socioeconomic status. Such studies indicate that the mortality increase for every 10 micrograms per cubic meter (g per m3) of PM2.5 ranges from 4 to 8 percent for cities in developed countries where average annual PM2.5 levels are 10 to 30 g/m3. Many urban areas of developing countries have similar or greater levels of air pollution. The major urban air pollutants can also give rise to significant respiratory morbidity (WHO 2000). For instance, Romieu and others (1996) report an exacerbation of asthma among children in Mexico City, and Xu and Wang (1993) note an increased risk of respiratory symptoms in middle-aged nonsmokers in Beijing. In relation to the very young, Wang and others (1997) find that PM exposure, SO2 exposure, or both increased the risk of low birthweight in Beijing, and Pereira and others (1998) find that air pollution increased intrauterine mortality in São Paulo. Other effects of ambient air pollution are postneonatal mortality and mortality caused by acute respiratory infections, as well as effects on children’s lung function, cardiovascular and respiratory hospital admissions in the elderly, and markers for functional damage of the heart muscle (WHO 2000). Asthma is another disease that researchers have linked to urban air pollution (McConnell and others 2002; Rios and others 2004).
, with adjustments for potential confounding factors, including socioeconomic status. Such studies indicate that the mortality increase for every 10 micrograms per cubic meter (g per m3) of PM2.5 ranges from 4 to 8 percent for cities in developed countries where average annual PM2.5 levels are 10 to 30 g/m3. Many urban areas of developing countries have similar or greater levels of air pollution. The major urban air pollutants can also give rise to significant respiratory morbidity (WHO 2000). For instance, Romieu and others (1996) report an exacerbation of asthma among children in Mexico City, and Xu and Wang (1993) note an increased risk of respiratory symptoms in middle-aged nonsmokers in Beijing. In relation to the very young, Wang and others (1997) find that PM exposure, SO2 exposure, or both increased the risk of low birthweight in Beijing, and Pereira and others (1998) find that air pollution increased intrauterine mortality in São Paulo. Other effects of ambient air pollution are postneonatal mortality and mortality caused by acute respiratory infections, as well as effects on children’s lung function, cardiovascular and respiratory hospital admissions in the elderly, and markers for functional damage of the heart muscle (WHO 2000). Asthma is another disease that researchers have linked to urban air pollution (McConnell and others 2002; Rios and others 2004)..")
22
Ozone exposure as a trigger of asthma attacks is of particular concern. The mechanism behind an air pollution and asthma link is not fully known, but early childhood NO2 exposure may be important (see, for example, Ponsonby and others 2000). Leaded gasoline creates high lead exposure conditions in urban areas, with a risk for lead poisoning, primarily in young children. The main concern is effects on the brain from low level exposure leading to behavioral aberrations and reduced or delayed development of intellectual or motoric ability (WHO 1995). Lead exposure has been implicated in hypertension in adults, and this effect may be the most important for the lead burden of disease at a population level (WHO 2002). Other pollutants of concern are the carcinogenic volatile organic compounds, which may be related to an increase in lung cancer, as reported by two recent epidemiological studies (Nyberg and others 2000; Pope and others 2002). Urban air pollution and lead exposure are two of the environmental hazards that WHO (2002) assessed as part of its burden-of-disease calculations for the World Health Report 2002. The report estimates that pollution by urban PM causes as much as 5 percent of the global cases of lung cancer, 2 percent of deaths from cardiovascular and respiratory conditions, and 1 percent of respiratory infections, adding up to 7.9 million disability-adjusted life years based on mortality only. This burden of disease occurs primarily in developing countries, with China and India contributing the most to the global burden Eastern Europe also has major air pollution problems, and in some countries, air pollution accounts for 0.6 to 1.4 percent of the total disability-adjusted life years from mortality. The global burden of disease caused by lead exposure includes subtle changes in learning ability and behavior and other signs of central nervous system damage (Fewthrell, Kaufmann, and Preuss 2003). WHO (2002) concludes that 0.4 percent of deaths and 0.9 percent (12.9 million) of all disability-adjusted life years may be due to lead exposure
. Leaded gasoline creates high lead exposure conditions in urban areas, with a risk for lead poisoning, primarily in young children. The main concern is effects on the brain from low level exposure leading to behavioral aberrations and reduced or delayed development of intellectual or motoric ability (WHO 1995). Lead exposure has been implicated in hypertension in adults, and this effect may be the most important for the lead burden of disease at a population level (WHO 2002). Other pollutants of concern are the carcinogenic volatile organic compounds, which may be related to an increase in lung cancer, as reported by two recent epidemiological studies (Nyberg and others 2000; Pope and others 2002). Urban air pollution and lead exposure are two of the environmental hazards that WHO (2002) assessed as part of its burden-of-disease calculations for the World Health Report The report estimates that pollution by urban PM causes as much as 5 percent of the global cases of lung cancer, 2 percent of deaths from cardiovascular and respiratory conditions, and 1 percent of respiratory infections, adding up to 7.9 million disability-adjusted life years based on mortality only. This burden of disease occurs primarily in developing countries, with China and India contributing the most to the global burden Eastern Europe also has major air pollution problems, and in some countries, air pollution accounts for 0.6 to 1.4 percent of the total disability-adjusted life years from mortality. The global burden of disease caused by lead exposure includes subtle changes in learning ability and behavior and other signs of central nervous system damage (Fewthrell, Kaufmann, and Preuss 2003). WHO (2002) concludes that 0.4 percent of deaths and 0.9 percent (12.9 million) of all disability-adjusted life years may be due to lead exposure.")
23
Water Pollution Chemical pollution of surface water can create health risks, because such waterways are often used directly as drinking water sources or connected with shallow wells used for drinking water. In addition, waterways have important roles for washing and cleaning, for fishing and fish farming, and for recreation. Another major source of drinking water is groundwater, which often has low concentrations of pathogens because the water is filtered during its transit through underground layers of sand, clay, or rocks. However, toxic chemicals such as arsenic and fluoride can be dissolved from the soil or rock layers into groundwater. Direct contamination can also occur from badly designed hazardous waste sites or from industrial sites. In the United States in the 1980s, the government set in motion the Superfund Program, a major investigation and cleanup program to deal with such sites (U.S. Environmental Protection Agency 2000). Coastal pollution of seawater may give rise to health hazards because of local contamination of fish or shellfish—for instance, the mercury contamination of fish in the infamous Minamata disease outbreak in Japan in 1956 (WHO 1976). Seawater pollution with persistent chemicals, such as polychlorinated biphenyls (PCBs) and dioxins, can also be a significant health hazard even at extremely low concentrations (Yassi and others 2001.
. Coastal pollution of seawater may give rise to health hazards because of local contamination of fish or shellfish—for instance, the mercury contamination of fish in the infamous Minamata disease outbreak in Japan in 1956 (WHO 1976). Seawater pollution with persistent chemicals, such as polychlorinated biphenyls (PCBs) and dioxins, can also be a significant health hazard even at extremely low concentrations (Yassi and others")
24
Sources of Chemical Water Pollution. Chemicals can enter waterways from a point source or a nonpoint source. Point source pollution is due to discharges from a single source, such as an industrial site. Nonpoint-source pollution involves many small sources that combine to cause significant pollution. For instance, the movement of rain or irrigation water over land picks up pollutants such as fertilizers, herbicides, and insecticides and carries them into rivers, lakes, reservoirs, coastal waters, or groundwater. Another nonpoint source is stormwater that collects on roads and eventually reaches rivers or lakes. 1 shows examples of point-source industrial chemical pollution. Paper and pulp mills consume large volumes of water and discharge liquid and solid waste products into the environment. The liquid waste is usually high in biological oxygen demand, suspended solids, and chlorinated organic compounds such as dioxins (World Bank 1999). The storage and transport of the resulting solid waste (wastewater treatment sludge, lime sludge, and ash) may also contaminate surface waters. Sugar mills are associated with effluent characterized by biological oxygen demand and suspended solids, and the effluent is high in ammonium content. In addition, the sugarcane rinse liquid may contain pesticide residues. Leather tanneries produce a significant amount of solid waste, including hide, hair, and sludge. The wastewater contains chromium, acids, sulfides, and chlorides. Textile and dye industries emit a liquid effluent that contains toxic residues from the cleaning of equipment. Waste from petrochemical manufacturing plants contains suspended solids, oils and grease, phenols, and benzene. Solid waste generated by petrochemical processes contains spent caustic and other hazardous chemicals implicated in cancer.
. The storage and transport of the resulting solid waste (wastewater treatment sludge, lime sludge, and ash) may also contaminate surface waters. Sugar mills are associated with effluent characterized by biological oxygen demand and suspended solids, and the effluent is high in ammonium content. In addition, the sugarcane rinse liquid may contain pesticide residues. Leather tanneries produce a significant amount of solid waste, including hide, hair, and sludge. The wastewater contains chromium, acids, sulfides, and chlorides. Textile and dye industries emit a liquid effluent that contains toxic residues from the cleaning of equipment. Waste from petrochemical manufacturing plants contains suspended solids, oils and grease, phenols, and benzene. Solid waste generated by petrochemical processes contains spent caustic and other hazardous chemicals implicated in cancer..")
25
Another major source of industrial water pollution is mining. The grinding of ores and the subsequent processing with water lead to discharges of fine silt with toxic metals into waterways unless proper precautions are taken, such as the use of sedimentation ponds. Lead and zinc ores usually contain the much more toxic cadmium as a minor component. If the cadmium is not retrieved, major water pollution can occur. Mining was the source of most of the widespread cadmium poisoning (Itai-Itai disease) in Japan in 1940–50 (Kjellstrom 1986). Other metals, such as copper, nickel, and chromium, are essential micronutrients, but in high levels these metals can be harmful to health. Wastewater from mines or stainless steel production can be a source of exposure to these metals. The presence of copper in water can also be due to corrosion of drinking water pipes. Soft water or low pH makes corrosion more likely. High levels of copper may make water appear bluish green and give it a metallic taste. Flushing the first water out of the tap can minimize exposure to copper. The use of lead pipes and plumbing fixtures may result in high levels of lead in piped water. Mercury can enter waterways from mining and industrial premises. Incineration of medical waste containing broken medical equipment is a source of environmental contamination with mercury. Metallic mercury is also easily transported through the atmosphere because of its highly volatile nature. Sulfate-reducing bacteria and certain other micro-organisms in lake, river, or coastal underwater sediments can methylate mercury, increasing its toxicity. Methylmercury accumulates and concentrates in the food chain and can lead to serious neurological disease or more subtle functional damage to the nervous system (Murata and others 2004).
 in Japan in 1940–50 (Kjellstrom 1986). Other metals, such as copper, nickel, and chromium, are essential micronutrients, but in high levels these metals can be harmful to health. Wastewater from mines or stainless steel production can be a source of exposure to these metals. The presence of copper in water can also be due to corrosion of drinking water pipes. Soft water or low pH makes corrosion more likely. High levels of copper may make water appear bluish green and give it a metallic taste. Flushing the first water out of the tap can minimize exposure to copper. The use of lead pipes and plumbing fixtures may result in high levels of lead in piped water. Mercury can enter waterways from mining and industrial premises. Incineration of medical waste containing broken medical equipment is a source of environmental contamination with mercury. Metallic mercury is also easily transported through the atmosphere because of its highly volatile nature. Sulfate-reducing bacteria and certain other micro-organisms in lake, river, or coastal underwater sediments can methylate mercury, increasing its toxicity. Methylmercury accumulates and concentrates in the food chain and can lead to serious neurological disease or more subtle functional damage to the nervous system (Murata and others 2004)..")
26
Runoff from farmland, in addition to carrying soil and sediments that contribute to increased turbidity, also carries nutrients such as nitrogen and phosphates, which are often added in the form of animal manure or fertilizers. These chemicals cause eutrophication (excessive nutrient levels in water), which increases the growth of algae and plants in waterways, leading to an increase in cyanobacteria (blue-green algae). The toxics released during their decay are harmful to humans. The use of nitrogen fertilizers can be a problem in areas where agriculture is becoming increasingly intensified. These fertilizers increase the concentration of nitrates in groundwater, leading to high nitrate levels in underground drinking water sources, which can cause methemoglobinemia, the life threatening “blue baby” syndrome, in very young children, which is a significant problem in parts of rural Eastern Europe (Yassi and others 2001). Some pesticides are applied directly on soil to kill pests in the soil or on the ground. This practice can create seepage to groundwater or runoff to surface waters. Some pesticides are applied to plants by spraying from a distance—even from airplanes. This practice can create spray drift when the wind carries the materials to nearby waterways. Efforts to reduce the use of the most toxic and long-lasting pesticides in industrial countries have largely been successful, but the rules for their use in developing countries may be more permissive, and the rules of application may not be known or enforced. Hence, health risks from pesticide water pollution are higher in such countries (WHO 1990).
, which increases the growth of algae and plants in waterways, leading to an increase in cyanobacteria (blue-green algae). The toxics released during their decay are harmful to humans. The use of nitrogen fertilizers can be a problem in areas where agriculture is becoming increasingly intensified. These fertilizers increase the concentration of nitrates in groundwater, leading to high nitrate levels in underground drinking water sources, which can cause methemoglobinemia, the life threatening blue baby syndrome, in very young children, which is a significant problem in parts of rural Eastern Europe (Yassi and others 2001). Some pesticides are applied directly on soil to kill pests in the soil or on the ground. This practice can create seepage to groundwater or runoff to surface waters. Some pesticides are applied to plants by spraying from a distance—even from airplanes. This practice can create spray drift when the wind carries the materials to nearby waterways. Efforts to reduce the use of the most toxic and long-lasting pesticides in industrial countries have largely been successful, but the rules for their use in developing countries may be more permissive, and the rules of application may not be known or enforced. Hence, health risks from pesticide water pollution are higher in such countries (WHO 1990)..")
27
Naturally occurring toxic chemicals can also contaminate groundwater, such as the high metal concentrations in underground water sources in mining areas. The most extensive problem of this type is the arsenic contamination of groundwater in Argentina, Bangladesh (box 43.2), Chile, China, India, Mexico, Nepal, Taiwan (China), and parts of Eastern Europe and the United States (WHO 2001). Fluoride is another substance that may occur naturally at high concentrations in parts of China, India, Sri Lanka, Africa, and the eastern Mediterranean. Although fluoride helps prevent dental decay, exposure to levels greater than 1.5 milligrams per liter in drinking water can cause pitting of tooth enamel and deposits in bones. Exposure to levels greater than 10 milligrams per liter can cause crippling skeletal fluorosis (Smith 2003).
, Chile, China, India, Mexico, Nepal, Taiwan (China), and parts of Eastern Europe and the United States (WHO 2001). Fluoride is another substance that may occur naturally at high concentrations in parts of China, India, Sri Lanka, Africa, and the eastern Mediterranean. Although fluoride helps prevent dental decay, exposure to levels greater than 1.5 milligrams per liter in drinking water can cause pitting of tooth enamel and deposits in bones. Exposure to levels greater than 10 milligrams per liter can cause crippling skeletal fluorosis (Smith 2003)..")
28
Water disinfection using chemicals is another source of chemical contamination of water. Chlorination is currently the most widely practiced and most cost-effective method of disinfecting large community water supplies. This success in disinfecting water supplies has contributed significantly to public health by reducing the transmission of waterborne disease. However, chlorine reacts with naturally occurring organic matter in water to form potentially toxic chemical compounds, known collectively as disinfection by-products (International Agency for Research on Cancer 2004). Exposure to Chemical Water Pollution. Drinking contaminated water is the most direct route of exposure to pollutants in water. The actual exposure via drinking water depends on the amount of water consumed, usually 2 to 3 liters per day for an adult, with higher amounts for people living in hot areas or people engaged in heavy physical work. Use of contaminated water in food preparation can result in contaminated food, because high cooking temperatures do not affect the toxicity of most chemical contaminants.
. Exposure to Chemical Water Pollution. Drinking contaminated water is the most direct route of exposure to pollutants in water. The actual exposure via drinking water depends on the amount of water consumed, usually 2 to 3 liters per day for an adult, with higher amounts for people living in hot areas or people engaged in heavy physical work. Use of contaminated water in food preparation can result in contaminated food, because high cooking temperatures do not affect the toxicity of most chemical contaminants..")
29
Framework for Environmental Health Interventions Population growth Economic development Technology Economic policy Social policy Clean technologies Pressure Production Consumption Waste release Hazard management State Natural hazards Resource availability Pollution levels Environmental improvement Exposure External exposure Absorbed dose Target organ dose Education Awareness raising Effect Well-being Morbidity Mortality Treatment Driving forceAction

31
Evidence shows that a number of chemicals that may be released into the air or water can cause adverse health effects. The associated burden of disease can be substantial, and investment in research on health effects and interventions in specific populations and exposure situations is important for the developmentof control strategies. Pollution control is therefore an important component of disease control, and health professionals and authorities need to develop partnerships with other sectors to identify and implement priority interventions. Developing countries face major water quantity and quality challenges, compounded by the effects of rapid industrialization. Concerted actions are needed to safely manage the use of toxic chemicals and to develop monitoring and regulatory guidelines. Recycling and the use of biodegradable products must be encouraged. Technologies to reduce air pollution at the source are well established and should be used in all new industrial development. Retrofitting of existing industries and power plants is also worthwhile. The growing number of private motor vehicles in developing countries brings certain benefits, but alternative means of transportation, particularly in rapidly growing urban areas, need to be considered at an early stage, as the negative health and economic impacts of high concentrations of motor vehicles are well established. The principles and practices of sustainable development, coupled with local research, will help contain or eliminate health risks resulting from chemical pollution. International collaboration involving both governmental and nongovernmental organizations can guide this highly interdisciplinary and inter-sectoral area of disease control. RESEARCH AND DEVELOPMENT AGENDA

32
Step 1: Identify All Control Technologies. All available control options must be identified for each emission unit and for logical combinations of emission units for each pollutant subject to PSD. Potential control combinations of emission units for each pollutant subject to PSD. Potential control options include lower emitting processes, raw materials, or work practices (e.g., thermal oxidizer, low-VOC coatings, low-sulfur coal, etc.); add-on controls (e.g., thermal oxidizer, electrostatic precipitator, baghouse, etc.); or a combination of control measures. Sources of information for developing a list of control measures include the USEPA RACT/BACT/LAER Clearinghouse (http://www.epa.gov/ttn/catc/), state air pollution control agencies, control technology vendors, and air pollution control literature
; add-on controls (e.g., thermal oxidizer, electrostatic precipitator, baghouse, etc.); or a combination of control measures. Sources of information for developing a list of control measures include the USEPA RACT/BACT/LAER Clearinghouse ( state air pollution control agencies, control technology vendors, and air pollution control literature.")
33
Step 2: Eliminate Technically Infeasible Options In Step 2 the applicant determines the technical feasibility of each control option identified in Step 1. A control option is considered feasible if it has been installed and successfully operated at an emission source similar to the proposed source would prevent applying the technology. Physical, chemical, or engineering data must be presented to proved that a particular control option can not be applied to a proposed facility

34
Step 3: Rank Remaining Control Options. Step 3 involves ranking the remaining control options in descending order, starting with the most effective option. Control performance levels should be ranked based on common units (e.g., percent control efficiency, or emissions per unit of product produced) to allow comparison of all options on the list. The ranking table should also include expected emission rate, and expected emission reduction for each option (in tons per year). The ranking table should include each emission unit and each pollutant subject to PSD review.
 to allow comparison of all options on the list. The ranking table should also include expected emission rate, and expected emission reduction for each option (in tons per year). The ranking table should include each emission unit and each pollutant subject to PSD review..")
35
Step 4: Evaluate the Most Effective Controls. In this step, each control option is evaluated in terms of energy, environmental, and economic impacts. Both positive and negative impacts should be quantified and evaluated. The review proceeds in a “top-down” manner starting with the most effective option in the ranking table and concluding when the applicant is unable to eliminate the remaining highest ranked option by demonstrating that the option is impractical due to adverse energy, environmental, or economic impacts Energy impacts Environmental impacts Economic impacts Average Cost = Control Cost/ (Uncontrolled Emissions - Controlled Emissions) Incremental Cost = (Cost of Option 1 - Cost of Option 2)/(Option 1 Reduction) - (Option 2 Reduction
 Incremental Cost = (Cost of Option 1 - Cost of Option 2)/(Option 1 Reduction) - (Option 2 Reduction.")
36
Step 5: Select BACT The conclusion of the ”top-down” analysis is the BACT that is the most stringent control option identified and not eliminated based on technical feasibility or energy, environmental, or economic impacts. The selected BACT option is then incorporated into a proposed permit that includes enforceable emission limits and other restrictions to insure that the control technology will operate properly in compliance with all applicable regulations. BACT requires an emission limit for each emission unit and pollutant subject to PSD review. Permit issuance also requires a public comment period per the PSD regulations. The BACT emission limits must be met at all times, must specify appropriate averaging time periods, and include proper compliance procedures and recordkeeping for the averaging periods. The BACT definition also allows operating procedures or practices to be set in place of an emission limit if it can be shown that an emission limit is not appropriate. Also, in situations where a BACT limit cannot be met at all times, such as during startup, a separate BACT limit can be set to cover such special cases. For a more in-depth review of PSD BACT analysis, please consult the “PSD Workbook, Chapter 8: Best Available Control Technology,” which is now available on the AQD Website at www.deq.state.mi.us/aps; and the “New Source Review Workshop Manual,” USEPA, Office of Air Quality Planning and Standards, Draft, October 1990, which is available at www.epa.gov/ttn/nsr/techinfo.html,

37
RULE 702 (VOC) BACT The general requirements of a Rule 702 (V)C) BACT analysis are: 1. The analysis must be emission unit specific. 2. The entire range of demonstrated options, including alternatives that may be transferable or innovative, must be evaluated. 3. The level of detail in the control options analysis should vary with the relative magnitude of the emissions reduction achievable. The permitting agency should not develop the VOC BACT analysis for the applicant. 4. Emission limits should be expressed in pounds per hour, pounds per day, or tons per year, or combinations thereof as needed to properly limit the process in line with all applicable regulations. Limits should also be included in terms of process unit variables, such as material processed, product manufactured, or material VOC content, as needed to satisfy the applicable regulations (e.g., lbs. VOC/106 Btu, lbs. VOC/gal. minus water, as applied). 5. Emission limits and work practice standards must be enforceable. Permit conditions should specify appropriate stack testing, continuous emission monitoring, continuous process monitors, recordkeeping, etc.
. 5. Emission limits and work practice standards must be enforceable. Permit conditions should specify appropriate stack testing, continuous emission monitoring, continuous process monitors, recordkeeping, etc..")
38
Step 1. Emission Unit Applicability Determine all potential VOC emission units including fugitive units (e.g., each stack, relief valves, pumps, tanks, conveyors, valves, etc.). Step 2. Potentially Sensitive Concerns Identify any potentially sensitive concerns involving energy usage, economic costs, and environmental issues. All potentially sensitive air quality concerns (including the control of all non-criteria pollutants) should be included in the review. Step 3. Selection of Alternative Control Strategies 1. Determine the base case of emissions which is the control strategy that, in the absence of VOC BACT decision making, would normally have been emitted from the source.. 2. Identify all alternative control strategies affording greater control, including: Transferable and innovative control technologies. Processes that inherently produce less pollution. Various configurations of the same technology which achieve different control efficiencies (e.g., thermal oxidizer operated at 1400° F vs. 1600° F). All of the following sources of information would generally need to be investigated to ensure that all possible control strategies are identified: Literature Industrial surveys RACT/BACT/LAER Clearinghouse (www.epa.gov/ttn/catc/) USEPA/State/Local air pollution control agency surveyswww.epa.gov/ttn/catc/ Step 4. Feasibility of Alternatives Determine if the most efficient alternative is not feasible because of energy usage, economic or environmental impacts, or other costs. If necessary, continue evaluating technical feasibility of the less efficient technologies. VOC BACT is the most efficient alternative which is not demonstrated to be infeasible. Step 5. Emission Limits The MDEQ will establish emission limits with a reasonable margin of safety (e.g., 95% confidence level of available test data); establish averaging time, if necessary; and establish stack testing, continuous emission monitoring, recordkeeping, and reporting requirements. Specific procedures for the VOC BACT analysis
. Step 2. Potentially Sensitive Concerns Identify any potentially sensitive concerns involving energy usage, economic costs, and environmental issues. All potentially sensitive air quality concerns (including the control of all non-criteria pollutants) should be included in the review. Step 3. Selection of Alternative Control Strategies 1. Determine the base case of emissions which is the control strategy that, in the absence of VOC BACT decision making, would normally have been emitted from the source.. 2. Identify all alternative control strategies affording greater control, including: Transferable and innovative control technologies. Processes that inherently produce less pollution. Various configurations of the same technology which achieve different control efficiencies (e.g., thermal oxidizer operated at 1400° F vs. 1600° F). All of the following sources of information would generally need to be investigated to ensure that all possible control strategies are identified: Literature Industrial surveys RACT/BACT/LAER Clearinghouse ( USEPA/State/Local air pollution control agency surveyswww.epa.gov/ttn/catc/ Step 4. Feasibility of Alternatives Determine if the most efficient alternative is not feasible because of energy usage, economic or environmental impacts, or other costs. If necessary, continue evaluating technical feasibility of the less efficient technologies. VOC BACT is the most efficient alternative which is not demonstrated to be infeasible. Step 5. Emission Limits The MDEQ will establish emission limits with a reasonable margin of safety (e.g., 95% confidence level of available test data); establish averaging time, if necessary; and establish stack testing, continuous emission monitoring, recordkeeping, and reporting requirements. Specific procedures for the VOC BACT analysis.")
39
Pollution Prevention Strategies Pollution prevention [vs. control] offers important economic benefits and at the same time allows continued protection of the environment. While most pollution control strategies cost money, pollution prevention has saved many firms thousands of dollars in treatment and disposal costs. More importantly, pollution prevention should be viewed as a means to increase company productivity. By reducing the amount of raw materials that are wasted and disposed of; manufacturing processes become more efficient, resulting in cost savings to the company. A company with an effective, ongoing pollution prevention plan may well be able to underbid its rivals and have a significant competitive edge. Pollution prevention should be the first consideration in planning for processes that emit air contaminants. Undertaking pollution prevention practices may reduce air emissions enough to allow a business or industry to avoid classification as a major air emission source. If so, some important 1990 Clean Air Act Amendments will not be applicable to that company

40
What is Pollution Prevention? The simplest but strictest definition of pollution prevention is the elimination or prevention of wastes (air emissions, water discharges, or solid/hazardous waste) at the source. In other words, pollution prevention is eliminating wastes before they are generated. Pollution prevention approaches can be applied to all pollution generating activity: hazardous and nonhazardous, regulated and unregulated. Often, conserving resources, such as water or energy use, are considered to be important pollution prevention practices. Pollution prevention does not include practices that create new risks of concern.
 at the source. In other words, pollution prevention is eliminating wastes before they are generated. Pollution prevention approaches can be applied to all pollution generating activity: hazardous and nonhazardous, regulated and unregulated. Often, conserving resources, such as water or energy use, are considered to be important pollution prevention practices. Pollution prevention does not include practices that create new risks of concern..")
41
Pollution Prevention Act In 1990, the United States Congress established federal policy on pollution prevention by passing the Pollution Prevention Act. The Act states: 1. that pollution should be prevented or reduced at the source whenever feasible (i.e., source reduction), 2. that pollution that cannot be prevented should be recycled in an environmentally safe manner whenever feasible, 3. that pollution that cannot be prevented or recycled should be treated in an environmentally safe manner whenever feasible, and 4. that disposal or other release into the environment should be employed only as last resort and should be conducted in an environmentally safe manner.
, 2. that pollution that cannot be prevented should be recycled in an environmentally safe manner whenever feasible, 3. that pollution that cannot be prevented or recycled should be treated in an environmentally safe manner whenever feasible, and 4. that disposal or other release into the environment should be employed only as last resort and should be conducted in an environmentally safe manner..")
42
The Pollution Prevention Act defines pollution prevention as source reduction. Recycling, energy recovery, treatment and disposal are not considered pollution prevention under the Act.

43
SOURCE REDUCTION Product Changes Designing and producing a product that has less environmental impact Changing the composition of a product so that less hazardous chemicals are used in, and result from, production Using recycled materials in the product Reusing the generated scrap and excess raw materials back in the process Minimizing product filler and packaging Producing goods and packaging reusable by the consumer Producing more durable products

44
SOURCE REDUCTION Input Material Changes Material substitution Using a less hazardous or toxic solvent for cleaning or as coating Purchasing raw materials that are free of trace quantities of hazardous or toxic impurities

45
Equipment and Process Modifications Changing the production process or flow of materials through the process. Replacing or modifying the process equipment, piping or layout. Using automation. Changing process operating conditions such as flow rates, temperatures, pressures and residence times. Implementing new technologies

46
SOURCE REDUCTION Good Operating Practices Instituting management and personnel programs such as employee training or employee incentive programs that encourage employees to reduce waste. Performing good material handling and inventory control practices that reduce loss of materials due to mishandling, expired shelf life, or improper storage. Preventing loss of materials from equipment leaks and spills. Segregating hazardous waste from non-hazardous waste to reduce the volume of hazardous waste disposed. Using standard operating procedures for process operation and maintenance tasks Performing preventative maintenance checks to avoid unexpected problems with equipment. Turning off equipment when not in use. Improving or increasing insulation on heating or cooling lines. Using drip pans and splash guards. Environmentally Sound Reuse and Recycling

47
Status of compliance with National Ambient Air Quality Standards (NAAQS) Sources in Attainment Areas Sources in Nonattainment Areas New or Modified Sources Existing Sources New or Modified Sources Best Available Control Technology Reasonably Available Control Technology Lowest Achievable Emission Rate "BACT" RACT LAER
 Sources in Attainment Areas Sources in Nonattainment Areas New or Modified Sources Existing Sources New or Modified Sources Best Available Control Technology Reasonably Available Control Technology Lowest Achievable Emission Rate BACT RACT LAER")
48
Median Cost Per Life Year Saved, Selected Relatively Low-Cost Interventions (1993 U.S. dollars) Intervention Cost per life year saved Toxin control Control coal-fired power plant emissions through high chimneys and other means 0 Reduce lead in gasoline from 1.1 to 0.1 grams per gallon 0 Ban amitraz pesticide on apples 0 Introduce a chloroform emission standard at selected pulp mills 0 Control SO2 by desulfuring residual fuel oil 0 Initiate sedimentation, filtration, and chlorination of drinking water 4,200 Introduce radon remediation in homes with levels greater than 21.6 picocuries per liter 6,100 Ban asbestos in brake linings 29,000 Set arsenic emission standards at selected copper smelters 36,000 Fatal injury reduction Make motorcycle helmet laws mandatory 0 Install automatic seat belts in cars 0 Require bad drivers to attend driving improvement schools 0 Pass a law requiring smoke detectors in homes 0 Improve standards for concrete construction 0 Ban residential growth in tsunami-prone areas 0 Make seat belt use in cars mandatory 69 Install smoke detectors in airplane lavatories 30,000 Medicine Require all common types of early childhood vaccinations 0 Implement annual stool colon cancer screening for people age 55 and older 0 Introduce detoxification or methadone maintenance for heroin addicts 0 Screen newborns for phenylketonuria 0 Recommend cervical cancer screening every three years for women age 65 and older 0 Introduce universal prenatal care for expectant mothers 0 Vaccinate all citizens against influenza 140 Screen men age 45–54 for hypertension 5,200 Institute annual mammography and breast examinations for women age 40–64 17,000 Perform three-vessel coronary artery bypass surgery for severe angina 23,000
 Intervention Cost per life year saved Toxin control Control coal-fired power plant emissions through high chimneys and other means 0 Reduce lead in gasoline from 1.1 to 0.1 grams per gallon 0 Ban amitraz pesticide on apples 0 Introduce a chloroform emission standard at selected pulp mills 0 Control SO2 by desulfuring residual fuel oil 0 Initiate sedimentation, filtration, and chlorination of drinking water 4,200 Introduce radon remediation in homes with levels greater than 21.6 picocuries per liter 6,100 Ban asbestos in brake linings 29,000 Set arsenic emission standards at selected copper smelters 36,000 Fatal injury reduction Make motorcycle helmet laws mandatory 0 Install automatic seat belts in cars 0 Require bad drivers to attend driving improvement schools 0 Pass a law requiring smoke detectors in homes 0 Improve standards for concrete construction 0 Ban residential growth in tsunami-prone areas 0 Make seat belt use in cars mandatory 69 Install smoke detectors in airplane lavatories 30,000 Medicine Require all common types of early childhood vaccinations 0 Implement annual stool colon cancer screening for people age 55 and older 0 Introduce detoxification or methadone maintenance for heroin addicts 0 Screen newborns for phenylketonuria 0 Recommend cervical cancer screening every three years for women age 65 and older 0 Introduce universal prenatal care for expectant mothers 0 Vaccinate all citizens against influenza 140 Screen men age 45–54 for hypertension 5,200 Institute annual mammography and breast examinations for women age 40–64 17,000 Perform three-vessel coronary artery bypass surgery for severe angina 23,000.")
50
Water is Precious and scarce Resource Only a small fraction (about 3%) is fresh water India is wettest country in the world, but rainfall is highly uneven with time and space (with extremely low in Rajasthan and high in North-East) On an avergae there are only 40 rainy days Out of 4000 BCM rainfall received, about 600 BCM is put to use so far Water resources are over-exploited resulting in major WQ problems
 is fresh water India is wettest country in the world, but rainfall is highly uneven with time and space (with extremely low in Rajasthan and high in North-East) On an avergae there are only 40 rainy days Out of 4000 BCM rainfall received, about 600 BCM is put to use so far Water resources are over-exploited resulting in major WQ problems")
51
Water use in India (Year 2000) SectorWater use in BCM percent Irrigation54185.33 Domestic426.62 Industry81.26 Energy20.32 Other416.47 Total634100.00
 SectorWater use in BCM percent Irrigation Domestic Industry81.26 Energy20.32 Other Total")
52
Water (Prevention and Control of Pollution) Act, 1974 Preamble: Maintaining and restoring of wholesomeness of water – level of WQ Provision for consent Every polluter (industry or municipality) has to obtain consent from SPCBs/PCCs Consent is conditional Standards prescribed for effluents Monitoring the compliance
 Act, 1974 Preamble: Maintaining and restoring of wholesomeness of water – level of WQ Provision for consent Every polluter (industry or municipality) has to obtain consent from SPCBs/PCCs Consent is conditional Standards prescribed for effluents Monitoring the compliance")
53
Major Water Quality Issues Common issues of Surface and Ground water Pathogenic (Bacteriological) Pollution Salinity Toxicity (micro-pollutants and other industrial pollutants) Surface Water Eutrophication Oxygen depletion Ecological health Ground Water Fluoride Nitrate Arsenic Iron Sea water intrusion
 Pollution Salinity Toxicity (micro-pollutants and other industrial pollutants) Surface Water Eutrophication Oxygen depletion Ecological health Ground Water Fluoride Nitrate Arsenic Iron Sea water intrusion")
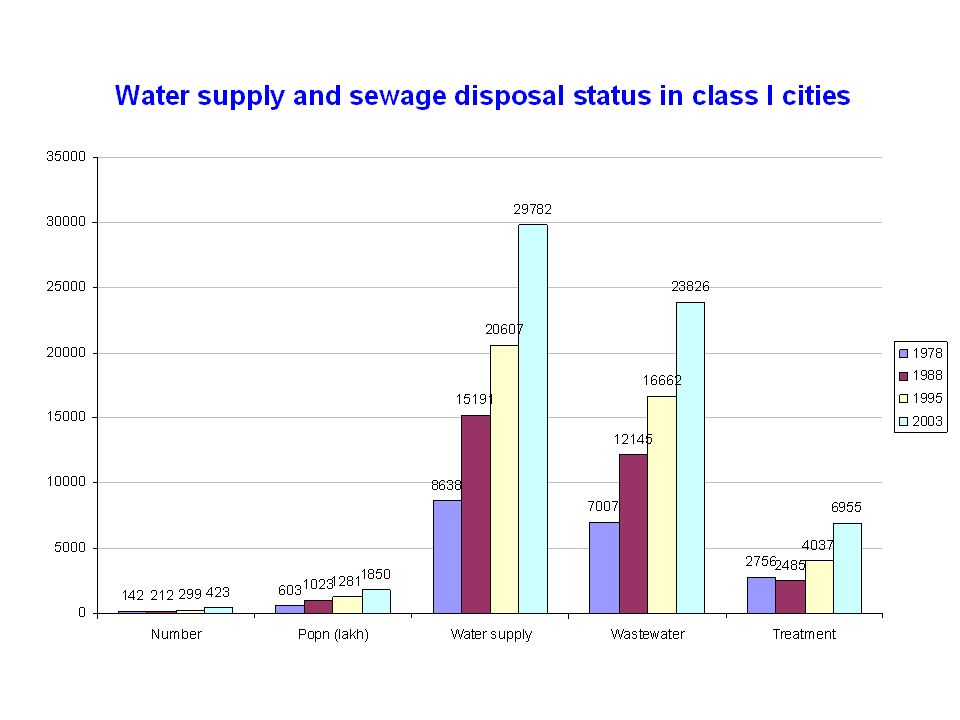
54
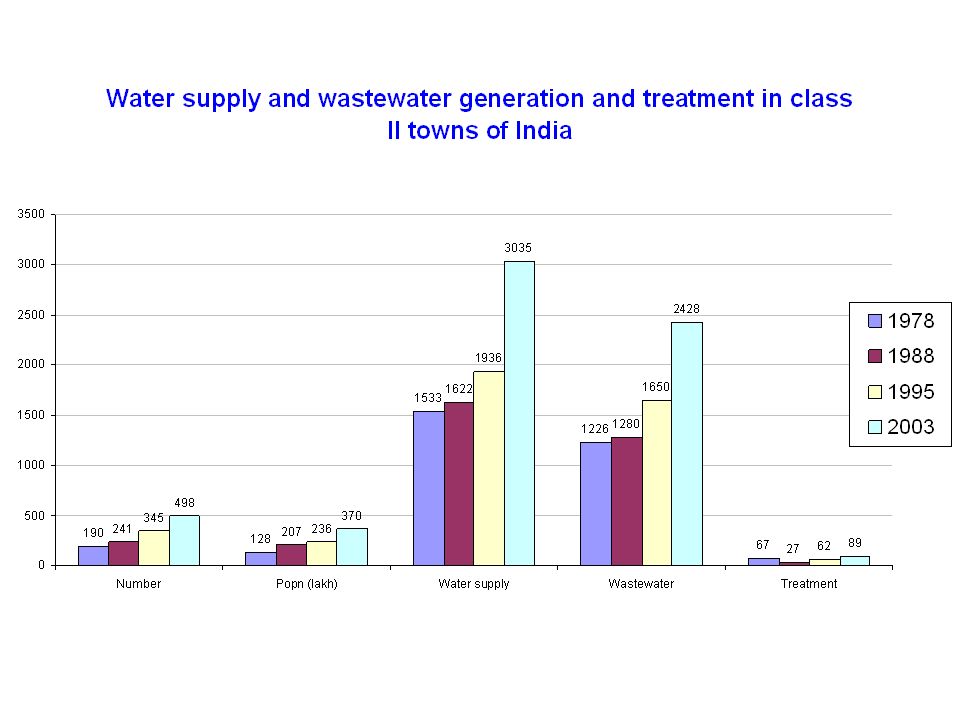
Major Factors Responsible for WQ Degradation Domestic: 423 class I cities and 499 class II towns harboring population of 20 Crore generate about 26254 mld of wastewater of which only 6955 mld is treated. Industrial: About 57,000 polluting industries in India generate about 13,468 mld of wastewater out of which nearly 60% (generated from large & medium industries) is treated. Non-point sources also contribute significant pollution loads mainly in rainy season. Pesticides consumption is about 1,00,000 tonnes/year of which AP, Haryana, Punjab, TN, WB, Gujarat, UP and Maharashtra are principal consumers. Domestic sewage is the major source of pollution in India in surface water which contribute pathogens, the main source of water borne diseases along with depletion of oxygen in water bodies. Sewage alongwith agricultural run-off and industrial effluents also contributes large amount of nutrients in surface water causing eutrophication A large part of the domestic sewage is not even collected. This results in stagnation of sewage within city, a good breeding ground for mosquitoes and contaminate the groundwater, the only source of drinking water in many cities.
 is treated. Non-point sources also contribute significant pollution loads mainly in rainy season. Pesticides consumption is about 1,00,000 tonnes/year of which AP, Haryana, Punjab, TN, WB, Gujarat, UP and Maharashtra are principal consumers. Domestic sewage is the major source of pollution in India in surface water which contribute pathogens, the main source of water borne diseases along with depletion of oxygen in water bodies. Sewage alongwith agricultural run-off and industrial effluents also contributes large amount of nutrients in surface water causing eutrophication A large part of the domestic sewage is not even collected. This results in stagnation of sewage within city, a good breeding ground for mosquitoes and contaminate the groundwater, the only source of drinking water in many cities..")
55
Increase in Urban Population

59
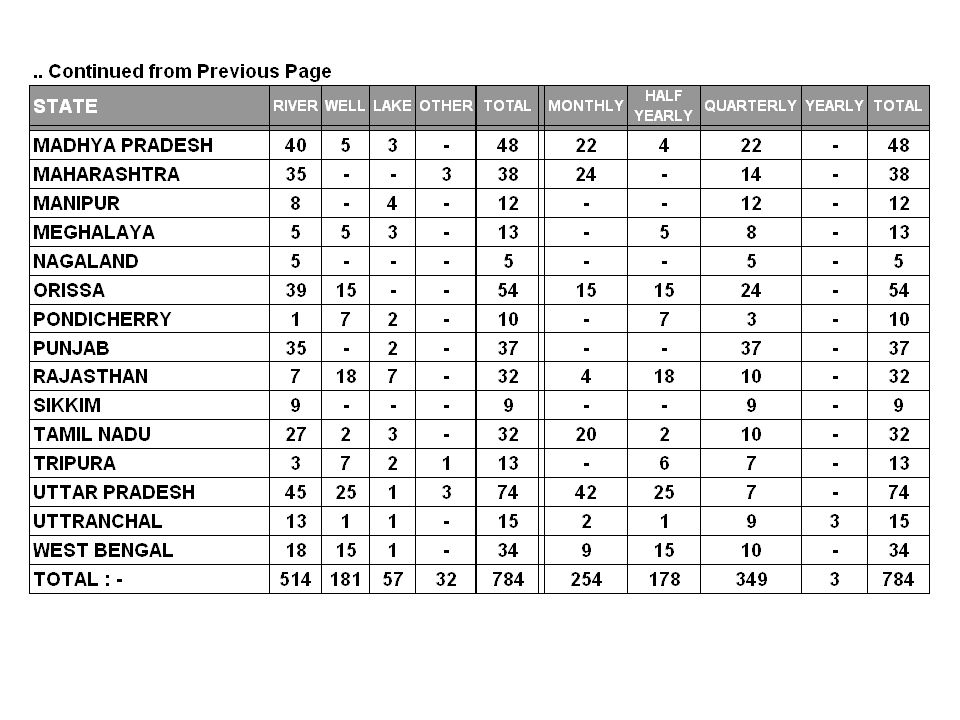
NATIONAL WATER QUALITY MONITORING PROGRAMME Network Comprising of 784 stations. Extended to 26 states & 5 Union Territories Monitoring done or Quarterly/Monthly/Half Yearly. Covers 168 Rivers, 53 Lakes, 5 Tanks, 2 Ponds, 3 Creeks, 3 Canals, 12 Drains and 181 wells.

60
Parameters for National Water Quality Monitoring Core Parameters (9) General Parameters (19) Field Observations (7) Bio-Monitoring Parameters (3) Trace Metals (9) Pesticide (7)
 General Parameters (19) Field Observations (7) Bio-Monitoring Parameters (3) Trace Metals (9) Pesticide (7)")
62
Waterbody-wise & Frequency-wise Distribution of Water Quality Monitoring Stations

64
RIVER BASIN WISE DISTRIBUTION OF WATER QUALITY MONITORING STATIONS Contd. On Next Page

65
Contd. From Pre-Page

66
WATER QUALTIY STATUS & TREND FROM 1994 TO 2003

67
S. No Level of Pollution Pollution Criteria Riverine length, Km. Riverine length percentage 01.Severely polluted BOD more than 6 mg/l 608614 02.Moderately polluted BOD 3-6 mg/l 869119 03.Relatively clean BOD less than 3 mg/l 3024267 WATER QUALITY STATUS Analysis of 10 years data with respect to BOD values as indicator of organic pollution

68
State-wise riverine length (in Km) under different level of pollution
 under different level of pollution")
69
State-wise riverine length (in Km) under different level of pollution (contd.)
 under different level of pollution (contd.)")
70
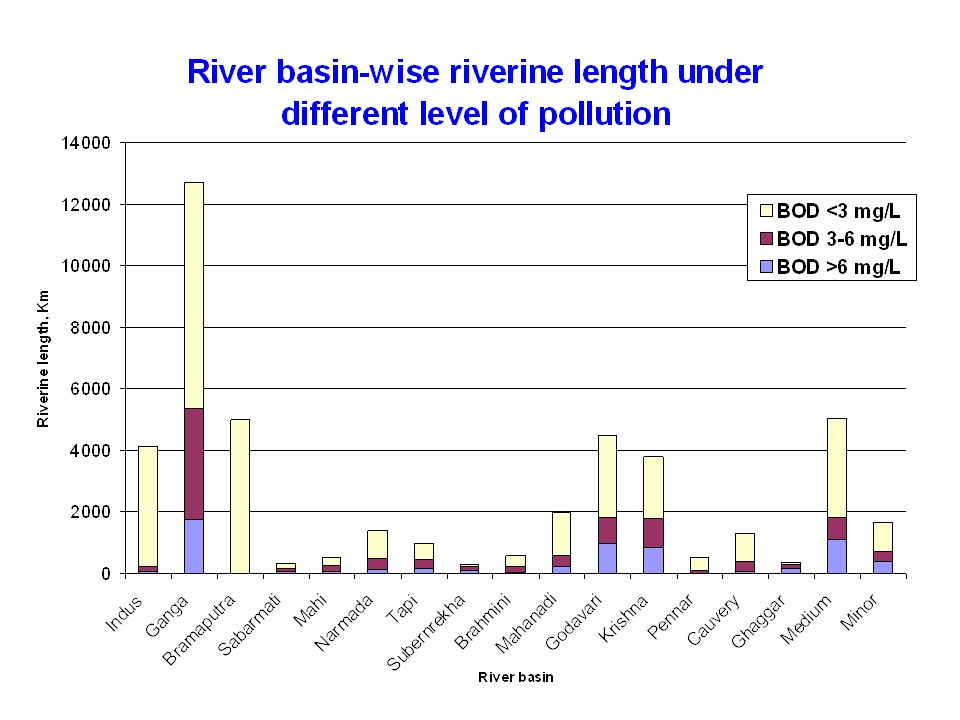
River basin-wise riverine length(in Km.) under different level of pollution
 under different level of pollution")
71
River basin-wise riverine length(in Km.) under different level of pollution (contd..)
 under different level of pollution (contd..)")
74
Identification of Polluted Water Bodies CPCB identified 10 polluted stretches for prioritising pollution control efforts in 1988-89. The Number of Stretches increased to 37 during 1992-93. The list is now revised to include 86 stretches. The concerned State Pollution Control Boards were asked to take adequate measures to restore the desired level.

75
RIVER ACTION PLAN CPCB identified polluted water bodies, which leads to formulation of action plan for restoration of the water body. Based on CPCB’s Recommendations, Ganga Action Plan was launched in 1986 to restore the WQ of the Ganga by interception, diversion and treatment of wastewater from 27 cities/towns located along the river. Based on the experience gained during implementation of the Ganga Action Plan, Govt of India extends river cleaning programme to other rivers and lakes.

76
NATIONAL RIVER ACTION PLAN RiverNo. of TownsRiverNo. of Towns Ganga74Brahmini3 Yamuna21Chambal3 Damodar12Gomti3 Godavari6Krishna2 Cauvery9Sabarmati1 Tungabhadra4Khan1 Satluj4Kshipra1 Subarnrekha3Tapi1 Betwa3Narmada1` Wainganga3Mahanadi1 Grand Total 156

77
WATER POLLUTION CONTROL STRATEGY Urban sources – National River Action Plan Industrial Sources – through consent ( SPCB) Special Drives: 17 categories of industries Industries discharging into rivers and lakes 24 Problem areas action plan Environmental auditing Common effluent treatment plants for cluster of SSI units (124) Promotion of low-waste and no-waste technology
 Special Drives: 17 categories of industries Industries discharging into rivers and lakes 24 Problem areas action plan Environmental auditing Common effluent treatment plants for cluster of SSI units (124) Promotion of low-waste and no-waste technology")
78
Experience from Ganga Action Plan Sewage collection system partial or non- existence Interception and diversion of drains - monsoon runoff Operation and maintenance of STPs Power supply Skilled manpower

79
Experience from industries High organic load - distilleries High TDS - pharmaceuticals, pesticides, rayon, dye and dye intermediates Small scale industries - location (residential areas), inadequate resources, skill etc. Problem with CETPs

80
ASSESSMENT OF GROUND WATER QUALITY IN METRO CITIES The groundwater is the main source of drinking in our country. The groundwater quality is being degraded gradually in large urban centers/critically polluted areas. Although Ministry of Water Resources is monitoring groundwater quality all over the country. The monitoring does not include main water quality issues ( heavy metals, pesticides, coliform, BOD, COD etc. Thus, it is important to monitor the groundwater quality in the country. In the current financial year CPCB included in its monitoring network a large number of groundwater stations (200 stations). Apart from this CPCB is taking help of some research institutes to study the groundwater quality.
. Apart from this CPCB is taking help of some research institutes to study the groundwater quality..")
81
CONCLUSION In order to meet water quality criteria in rivers, dilution water is required besides stringent pollution control. Interlinking of rivers is one of the solution to meet water quality criteria in rivers as more dilution of water would be available in rivers.

82
Water Pollution Pollutants degrade water quality judged from public health or ecological view Substances that in excess are harmful to desirable living organisms Example: hog farms in NC and hurricane Floyd 38 pig lagoons flooded out 30,000 hogs, 2 million chicken and 735,000 turkeys died

83
Selected Pollutants Oxygen demanding waste Bacteria that decay organic matter require oxygen Pathogenic Organisms E.g. Cholera, typhoid, hepatitis, dysentry, Escherichia coli Case history: Walkerton, Canada 7 dead and 1000 infected

84
Selected Pollutants (cont.) Nutrients Phosphorous and nitrogen Cultural eutrophication Oil Tanker spills Case history: Valdez 250,00 barrels spilled in what was once one of the most pristine and dive marine environments
 Nutrients Phosphorous and nitrogen Cultural eutrophication Oil Tanker spills Case history: Valdez 250,00 barrels spilled in what was once one of the most pristine and dive marine environments")
85
Selected Pollutants (cont.) Toxic Substances Hazardous chemicals Synthetic compounds hazardous to people Case study: methyl tertbutyl ether MTBE Heavy Metals E.g. Mercury, lead, zinc, cadmium biomagnification Radioactive waste Thermal pollution

86
water pollution sources Point and nonpoint sources Surface and groundwater Some sources of groundwater pollution Leaky storage tanks Leaking waste disposal sites Accidents Seepage from septic systems Seepage from acid mines Seepage from agricultural activities

87
Groundwater treatment Extraction wells Pump out contaminant and treat Bioremediation Inject nutrients and oxygen to encourage bacteria Permeable Treatment Bed Install a treatment bed/layer through which the contaminant will pass

88
Air Pollution Before the evolution of animals, plants dumped their ‘waste’ oxygen into the atmosphere. Now we dump our waste into the atmosphere. “smog” coined in 1905 Nearly all of the US is subject to air pollution

89
Pollutants Primary Particulate matter Sulfur oxides Carbon monoxide Nitrogen oxides hydrocarbons Secondary Produces when primary pollutants react with normal atmospheric compounds ozone

90
Pollutants Sulphur Dioxide Coal burning S02 -> S04 -> H2SO4 = Acid rain Nitrogen Oxides NO2 -> smog and acid rain Carbon monoxide Extremely toxic Incomplete burning of fuel

91
Pollutants (cont.) Volatile Organic Compounds Hydrocarbons + sunlight -> smog Natural and anthropogenic sources Hydrogen sulfide Natural and industrial toxic
 Volatile Organic Compounds Hydrocarbons + sunlight -> smog Natural and anthropogenic sources Hydrogen sulfide Natural and industrial toxic")
92
Particulate matter Classified based on particle size Desertification, volcanic eruptions, fires, modern farming Case study: Indonesia 1997 Fires rages out of control (49,000 acres) 20 million treated Airliner crashed in Sumatra Air Quality Index = 800 (4 packs a day)
 20 million treated Airliner crashed in Sumatra Air Quality Index = 800 (4 packs a day)")
93
Treatment Settling chambers trap particulates Catalytic converters on autos Cleaner fuel or fuel efficiency? ‘cleaning’ high sulfur coal Scrubbers in stacks -> lime + SO2 New methodologies being researched

Similar presentations


 of the Clean Water Act requires states to develop lists of impaired waters, those that do.>")


 ‘Parivesh Bhavan’, East Arjun Nagar.>")

