Download presentation
Presentation is loading. Please wait.

1
STARTER FIND SOMEONE WHO can answer the questions on your cards get up and move around! Every question must be answered by someone different you are NOT allowed to ask anyone on the same table as you!

2
What are the units of speed when: Distance is measured in metres and time in seconds Distance is measured in kilometres and time in hours Distance is measured in metres and time in minutes

3
Pairs of cameras spot your number plate, start a timer, and then spot your number plate again leaving a zone 800m The speed cameras record that a car takes 350 seconds to move between them. Calculate the average speed of the car. Show your working. Give the unit. 2.28 m/s

4
Distance against time graphs distance time

5
No movement? distance time

6
No movement distance time

7
Constant speed? distance time

8
Constant speed distance time

9
Constant speed distance time The gradient of this graph gives the speed

10
Constant speed distance time How would the graph look different for a faster constant speed?

11
Constant speed distance time fast

12
Constant speed distance time fast How would the graph look different for a slower constant speed?

13
Constant speed distance time fast slow

14
Getting faster? (accelerating) distance time
 distance time")
15
Getting faster distance time

16
Examples distance time

17
A car accelerating from stop and then hitting a wall distance time

18
A car accelerating from stop and then hitting a wall distance time

19
Speed against time graphs speed time

20
No movement? speed time

21
No movement speed time

22
Constant speed? speed time

23
Constant speed speed time

24
Constant speed speed time How would the graph look different for a faster constant speed?

25
Constant speed speed time fast

26
Constant speed speed time fast How would the graph look different for a slower constant speed?

27
Constant speed speed time fast slow

28
Getting faster? (accelerating) speed time
 speed time")
29
Getting faster? (accelerating) speed time Constant acceleration
 speed time Constant acceleration")
30
Getting faster? (accelerating) speed time The area under the graph gives the distance travelled
 speed time The area under the graph gives the distance travelled")
31
Example: speed time

32
A dog falling from a tall building (no air resistance) speed time
 speed time")
33
A dog falling from a tall building (no air resistance) speed time
 speed time")
34
A dog falling from a tall building (no air resistance) speed time Area = height of building
 speed time Area = height of building")
35
Be careful! distance time speed time

36
No movement distance time speed time

37
Constant speed distance time speed time Area = distance travelled

38
Constant acceleration distance time speed time Area = distance travelled

39
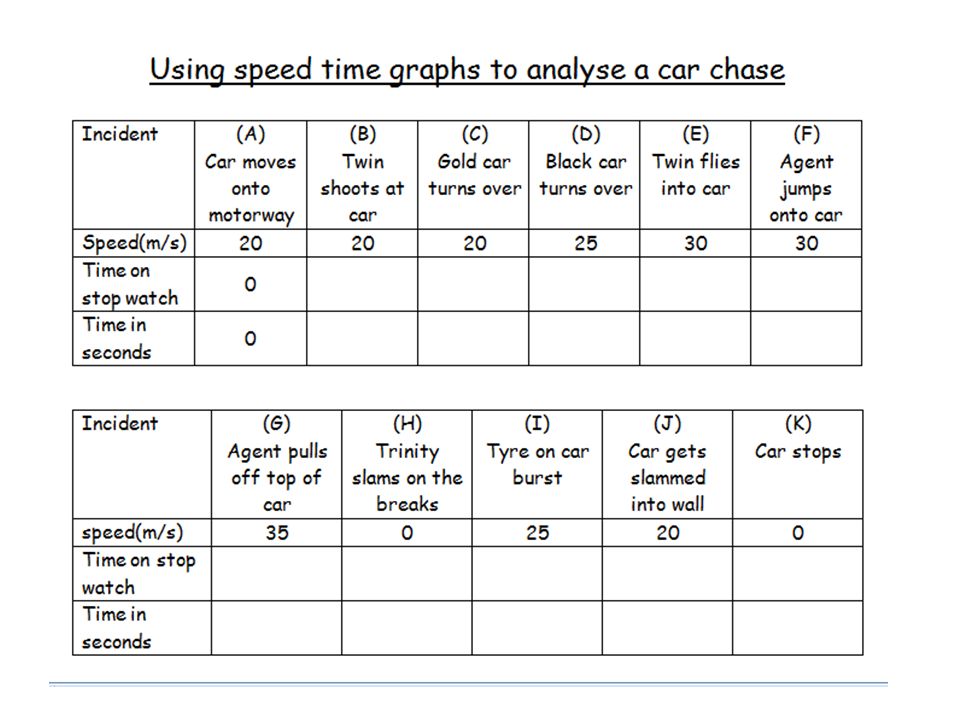
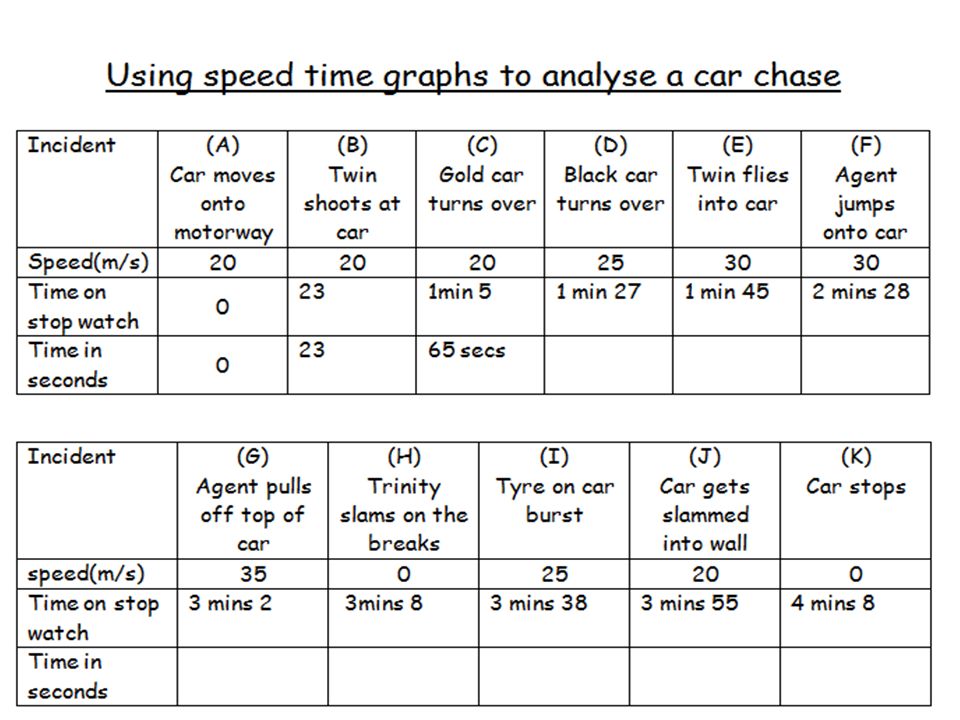
Too easy? I have a challenge for you! Can you watch the following video clip and use a stopwatch to determine how far the car travelled? I will provide you with a stopwatch and a table to fill in!

42
Activity Plot these results on a speed time graph, with time on the bottom axis (the x axis) and speed on the side axis (the y axis). Label the points where there is a change in motion A,B,C,D,E,F,H,I,J and K. Example: point A is at time 0 and speed 0.

Similar presentations


 – describes how far an object has travelled from a starting point. Units for distance are metres (m) or kilometres.>")


 The acceleration.>")