Download presentation
Presentation is loading. Please wait.

1
Demographic Pressure and Institutional Change: Village-Level Response to Rural Population Growth in Burkina Faso Margaret S. McMillan, William A. Masters and Harounan Kazianga NBER African Successes Project Conference, Zanzibar August 3-5, 2011

2
Can local public services and land rights be explained by population size? Study design and preview of results Identification strategy Data and survey methods OLS and 2SLS results Demographic Pressure and Institutional Change Study Design | Identification | Data | Results

3
Burkina Faso has had unusual shocks to rural population – Onchocerciasis control => migration into river valleys; – Cote d’Ivoire (CDI) politics => forced repatriation Spatial variation in shocks across villages could permit identification of demographic effects on public action – Low/rising densities could explain weak/stronger public sector – We have population census data for 1985, ‘96 and 2006 – Use village distance to rivers and CDI to instrument exposure – Use village elders to recall changes in village amenities Causality is still unclear; goal is to describe correlation between population shocks and village amenities Demographic Pressure and Institutional Change Study Design | Identification | Data | Results Study design in one slide
 politics => forced repatriation Spatial variation in shocks across villages could permit identification of demographic effects on public action – Low/rising densities could explain weak/stronger public sector – We have population census data for 1985, ‘96 and 2006 – Use village distance to rivers and CDI to instrument exposure – Use village elders to recall changes in village amenities Causality is still unclear; goal is to describe correlation between population shocks and village amenities Demographic Pressure and Institutional Change Study Design | Identification | Data | Results Study design in one slide")
4
Measuring amenities with time-varying indexes Public services – four distance metrics of proximity to: (1) Public Services and Utilities: office used to register births, savings & loan facility, fixed-line telephone, mobile phone reception; (2) Public Infrastructure: road passable all year, seasonal road, bus stop, primary school, secondary school, health center; (3) Religious Services: any church, mosque or temple; (4) Markets: open-air with storage facilities, livestock, or shop. Property rights – a principal-components index of: (a) Use rights to cropland (undefined, communal, familial, individual) (b) Transactions for cropland (parcels ever sold or rented) (c) Authorities for resolving conflicts (informal, traditional or elected) (d) Commons demarcation and regulation (pasture land, forest) Demographic Pressure and Institutional Change Study Design | Identification | Data | Results
 Use rights to cropland (undefined, communal, familial, individual) (b) Transactions for cropland (parcels ever sold or rented) (c) Authorities for resolving conflicts (informal, traditional or elected) (d) Commons demarcation and regulation (pasture land, forest) Demographic Pressure and Institutional Change Study Design | Identification | Data | Results.")
5
Linking amenities to population shocks Migration adds variance to natural increase in population, and migration is tied to river valleys and the CDI border, Interpretation of causality is limited, as usual. – Migrants could differ from non-migrants, and – Proximity to rivers and CDI could drive both via other channels. Novelty is in the data on rural amenities, and their correlation with population shocks – Here, we pre-committed to study design before data collection so no selection bias in our methods or hypotheses – Future papers can do much more with these data… Demographic Pressure and Institutional Change Study Design | Identification | Data | Results

6
Preview of results We find strong links between amenities and population – Instrumented population effects are much larger than OLS – Elasticities of distance to population are between 0.4 and 1.4 Magnitude of variance and effect sizes are large – The increase in proximity of public services associated with moving from the 1 st to 5 th quintile of predicted village population is larger than the 10 years of time trend from 1996 to 2006 No correlation between population and property rights – Instrumented estimate is larger but not significantly positive – Significant time trend with 2006 values above 1985 and 1996 Demographic Pressure and Institutional Change Study Design | Identification | Data | Results

7
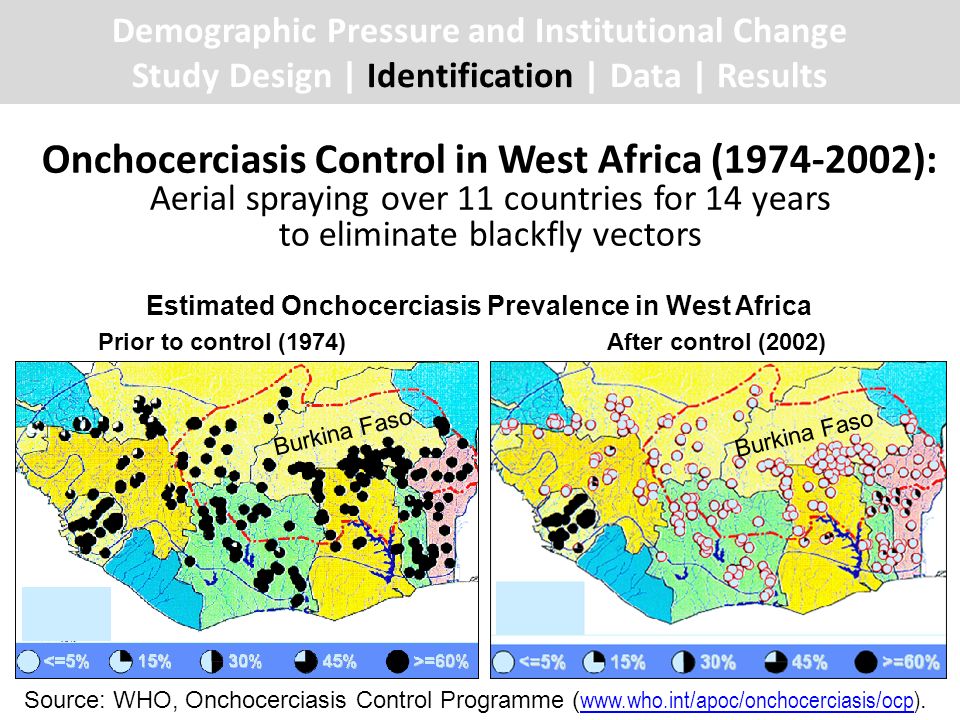
Onchocerciasis Control in West Africa (1974-2002): Aerial spraying over 11 countries for 14 years to eliminate blackfly vectors Demographic Pressure and Institutional Change Study Design | Identification | Data | Results Burkina Faso Estimated Onchocerciasis Prevalence in West Africa Prior to control (1974)After control (2002) Source: WHO, Onchocerciasis Control Programme ( www.who.int/apoc/onchocerciasis/ocp). www.who.int/apoc/onchocerciasis/ocp
8
Repatriation from Cote d’Ivoire (1999-2003): As many as 1 million returnees in total, out of 2.25 m. total Burkinabe in CDI in 1998, contributing to 13 m. total population in Burkina in 2003 Demographic Pressure and Institutional Change Study Design | Identification | Data | Results Foreign population in Cote d’Ivoire census of 1998 Source: IRIN News, “In-depth: Cote d’Ivoire crisis”, November, 2002 ( www.irinnews.org). www.irinnews.org

9
Villages’ distance to rivers and to Cote d’Ivoire Cote d’Ivoire Mali Niger Benin Togo Ghana Demographic Pressure and Institutional Change Study Design | Identification | Data | Results

10
Survey Method Sample is all 747 villages in the national farm survey of the Office of Agricultural Statistics in Burkina Faso Respondents were a focus group of village leaders convened by the enumerator Survey asks respondents to characterize: – the situation now and when it was established; – the previous situation and when it was established; – and the situation before that, and when it was established; – variables are either continuous (distance to services), or categorical (land rights). Responses permit construction of 3-step time series – we use only the situation in 1985, 1996 and the present – some villages failed to report some data, but all n>2,000 Demographic Pressure and Institutional Change Study Design | Identification | Data | Results

11
Questionnaire design: distance to services Demographic Pressure and Institutional Change Study Design | Identification | Data | Results N°QuestionsRéponse Distance (en km)Année d’établissement V.1Distance entre le village et l’administration centrale (pour les registres des naissances) V.1.1 La situation actuelle|____|____|____||____|____|____|____| V.1.2 La situation précédente|____|____|____||____|____|____|____| V.1.3 La situation antécédente|____|____|____||____|____|____|____| V.2Distance entre le village et la route praticable par car ou camion toute l’année V.2.1 La situation actuelle|____|____|____||____|____|____|____| V.2.2 La situation précédente|____|____|____||____|____|____|____| V.2.3 La situation antécédente|____|____|____||____|____|____|____|
Année d’établissement V.1Distance entre le village et l’administration centrale (pour les registres des naissances) V.1.1 La situation actuelle|____|____|____||____|____|____|____| V.1.2 La situation précédente|____|____|____||____|____|____|____| V.1.3 La situation antécédente|____|____|____||____|____|____|____| V.2Distance entre le village et la route praticable par car ou camion toute l’année V.2.1 La situation actuelle|____|____|____||____|____|____|____| V.2.2 La situation précédente|____|____|____||____|____|____|____| V.2.3 La situation antécédente|____|____|____||____|____|____|____|")
12
Questionnaire design: land rights Demographic Pressure and Institutional Change Study Design | Identification | Data | Results N°QuestionsRéponse VIII.1 Type de droit appliquée pour les terres de culture (si la réponse est non, mettre des croix à année de début d’application) Type de droit appliquée (1=Oui ; 0=Non) Année de début d’application VIII.1.1 Propriété individuelle |____||____|____|____|____| VIII.1.2 Propriété collective-familiale |____||____|____|____|____| VIII.1.3 Propriété collective-communautaire |____||____|____|____|____| VIII.2 Location, vente et prêts de terres de culture (si la réponse est non, mettre des croix à année de début d’application) Possibilité de transaction (1=Oui ; 0=Non) Année de début d’application VIII.2.1 Est-ce que la terre peut-être louée ? |____||____|____|____|____| VIII.2.2 Est-ce que la terre peut-être vendue ? |____||____|____|____|____| VIII.2.3 Est-ce que la terre peut-être prêtée ? |____||____|____|____|____|

13
Construction of indexes for distance to services Distance responses were aggregated into four types: – Public Services: any office used to register births, savings & loan facility, fixed-line telephone, and/or mobile phone reception; – Public Infrastructure: any road passable all year, seasonal road, bus stop, primary school, secondary school, health center; – Religious Service: any church, mosque or temple; – Marketplaces: any market with storage, livestock, or shops. Distance indexes constructed in three ways: Proximity of the farthest service in the basket Proximity of the nearest service in the basket Average proximity of all goods in the basket Demographic Pressure and Institutional Change Study Design | Identification | Data | Results

14
Proximity to all sources (km) (Average distance to all services) Proximity to closest source (km) (Distance to closest site in each set) Year Public Services Public Infrast. Religious Services Market- places Public Services Public Infrast. Religious Services Market- places 198526.96814.7986.4768.60318.3493.6283.5514.828 199625.14211.6294.7407.78815.1551.8562.3083.734 201019.7248.1643.0436.1168.6480.5021.1751.948 Mean value of distance indexes for census years All types of public services are being provided increasingly close to surveyed villages Demographic Pressure and Institutional Change Study Design | Identification | Data | Results

15
Construction of indexes for land rights Institutions governing land rights were aggregated using principal components analysis, into a single index whether: – cropland rights are undefined, communal, familial or individual; – transactions for cropland include sales or rentals; – authorities to resolve conflicts are informal, traditional or elected; – pasture and forest is demarcated and restricted via quotas/taxes Index is defined with higher values for greater rule of law Demographic Pressure and Institutional Change Study Design | Identification | Data | Results

16
Principal- components index of land rights 1 Year 1985 -0.096 1996 -0.035 2006 0.140 Demographic Pressure and Institutional Change Study Design | Identification | Data | Results Mean value of land rights index Land rights improved sharply from 1996 to 2006

17
Main regression is: – Where: i is infrastructure or institutional service to the village; P is population of the village; are fixed effects for 45 provinces and 3 years; is error term; j indexes villages (≈16 per province); t indexes time (1985, 1996, 2006) Demographic Pressure and Institutional Change Study Design | Identification | Data | Results Regression specification
; t indexes time (1985, 1996, 2006) Demographic Pressure and Institutional Change Study Design | Identification | Data | Results Regression specification")
18
Demographic Pressure and Institutional Change Study Design | Identification | Data | Results OLS estimates of main regression Proximity of farthest source (km)Proximity to all sources (km) ServicesInfrastr.ReligionMarketsServicesInfrastr.ReligionMarkets (1)(2)(3)(4)(5)(6)(7)(8) Population0.045*0.0030.153***0.182***0.041*0.049**0.145***0.187*** Y=1996-0.0590.174***0.127**-0.0300.0250.193***0.167***0.034 Y=20060.0270.485***0.493***0.0720.255***0.538***0.515***0.222*** Constant-3.29***-3.18***-2.44***-3.20***-2.97***-2.71***-2.14***-3.03*** Observ.2,1322,1612,0402,1362,1322,1612,0402,136 R-squared0.0970.1470.2330.2200.1160.2200.2650.225 Proximity to closest source (km)Land ServicesInfrastr.ReligionMarketsrights (9)(10)(11)(12)(13) Population0.108***0.116***0.125***0.228***-0.001 Y=19960.191***0.305***0.225***0.193***0.063 Y=20061.109***0.611***0.490***0.628***0.230*** Constant-2.69***-1.40***-1.50***-2.64***0.02 Observ.2,1322,1612,0402,1362,170 R-squared0.2300.2340.2320.2350.217
Proximity to all sources (km) ServicesInfrastr.ReligionMarketsServicesInfrastr.ReligionMarkets (1)(2)(3)(4)(5)(6)(7)(8) Population0.045* ***0.182***0.041*0.049**0.145***0.187*** Y= ***0.127** ***0.167***0.034 Y= ***0.493*** ***0.538***0.515***0.222*** Constant-3.29***-3.18***-2.44***-3.20***-2.97***-2.71***-2.14***-3.03*** Observ.2,1322,1612,0402,1362,1322,1612,0402,136 R-squared Proximity to closest source (km)Land ServicesInfrastr.ReligionMarketsrights (9)(10)(11)(12)(13) Population0.108***0.116***0.125***0.228*** Y= ***0.305***0.225***0.193***0.063 Y= ***0.611***0.490***0.628***0.230*** Constant-2.69***-1.40***-1.50***-2.64***0.02 Observ.2,1322,1612,0402,1362,170 R-squared")
19
First stage results for IV estimates Dependent variable: Village population (1)(2)(3) Distance to closest river-0.130***-0.120*** Distance to Cote d’Ivoire-0.276***-0.142 Year==19960.083*0.081*0.083* Year==2006-0.212***-0.213***-0.212*** Constant7.209***8.595***8.101*** Observations2,130 R-squared0.1760.1670.177 F-Stat Inst 15.14 Demographic Pressure and Institutional Change Study Design | Identification | Data | Results
(2)(3) Distance to closest river-0.130***-0.120*** Distance to Cote d’Ivoire-0.276*** Year== *0.081*0.083* Year== ***-0.213***-0.212*** Constant7.209***8.595***8.101*** Observations2,130 R-squared F-Stat Inst Demographic Pressure and Institutional Change Study Design | Identification | Data | Results")
20
2SLS estimates of main regression Proximity of farthest source (km)Proximity to all sources (km) ServicesInfrastr.ReligionMarketsServicesInfrastr.ReligionMarkets (1)(2)(3)(4)(5)(6)(7)(8) Pop. shock0.417**0.658***1.377***0.555**0.558***0.968***1.147***0.707*** Y=1996-0.0910.122**0.045-0.060-0.0190.119**0.098-0.008 Y=20060.1030.623***0.794***0.154*0.360***0.734***0.761***0.339*** Constant -5.82***-7.63***-10.8***-5.73***-6.48***-8.95***-8.99***-6.57*** Observ.2,0932,1212,0002,0962,0932,1212,0002,096 Demographic Pressure and Institutional Change Study Design | Identification | Data | Results Proximity to closest source (km)Land ServicesInfrastr.ReligionMarketsrights (9)(10)(11)(12)(13) Pop. shock1.169***0.471**0.655***1.121***0.367 Y=19960.1040.271***0.181***0.122*0.037 Y=20061.331***0.677***0.620***0.835***0.308*** Constant -9.89***-3.81***-5.12**-8.71***-2.48 Observ.2,0932,1212,0002,0962,130
Land ServicesInfrastr.ReligionMarketsrights (9)(10)(11)(12)(13) Pop. shock1.169***0.471**0.655***1.121***0.367 Y= ***0.181***0.122*0.037 Y= ***0.677***0.620***0.835***0.308*** Constant -9.89***-3.81***-5.12**-8.71***-2.48 Observ.2,0932,1212,0002,0962,130.")
21
Conclusion Demographic Pressure and Institutional Change Study Design | Identification | Data | Results Can local public services and property rights be explained by size of local population? – For public services, a strong correlation with population shocks: – link to shift from 1 st to 5 th quintile of predicted population is larger than the common time trend from 1996 to 2006 – For property rights, spatial variance is less significant: – variance in this dataset is linked only to the national trend Looking forward, we’ve shown that: – Villagers’ recall data can be used to study public sector changes; – Low population density could help explain weak public services; – Burkina Faso is responding to higher density with more services.

Similar presentations


alk m>")


 1.>")


 Van Dessel Wim 1, Poelmans Lien 1, Gyozo Jordan 2, Szilassi Peter 3, Csillag Gabor.>")
