Download presentation
Presentation is loading. Please wait.

1
Predicting land use changes in the Lake Balaton catchment (Hungary) Van Dessel Wim 1, Poelmans Lien 1, Gyozo Jordan 2, Szilassi Peter 3, Csillag Gabor 2, Van Rompaey Anton 1 1 Physical an Regional Geography Research Group, K.U.Leuven, Belgium 2 Geological Institute of Hungary, Hungarian Geological Survey, Hungary 3 Szeged University, Deparment of Geography, Hungary International Workshop: European Union Expansion: Land Use Change and Environmental Effects in Rural Areas
 Van Dessel Wim 1, Poelmans Lien 1, Gyozo Jordan 2, Szilassi Peter 3, Csillag Gabor 2, Van Rompaey Anton 1 1 Physical an Regional Geography Research Group, K.U.Leuven, Belgium 2 Geological Institute of Hungary, Hungarian Geological Survey, Hungary 3 Szeged University, Deparment of Geography, Hungary International Workshop: European Union Expansion: Land Use Change and Environmental Effects in Rural Areas")
2
Introduction Land use changes: caused by socio-economic evolution (often at a macroscale): political decisions, econmic development, changing lifestyle Land users determine the spatial pattern of these land use changes e.g. Due to economic or political pressure a farmer can be forced to take land out or in production Wich parcels will be chosen depends on a lot of criteria (ex. soil parameters); personal experience and motivation of the farmer Evalutation of the quality/characteristics of the parcels Can we model the behaviour of the farmer and simulate the spatial pattern of his decisions?
; personal experience and motivation of the farmer Evalutation of the quality/characteristics of the parcels Can we model the behaviour of the farmer and simulate the spatial pattern of his decisions .")
3
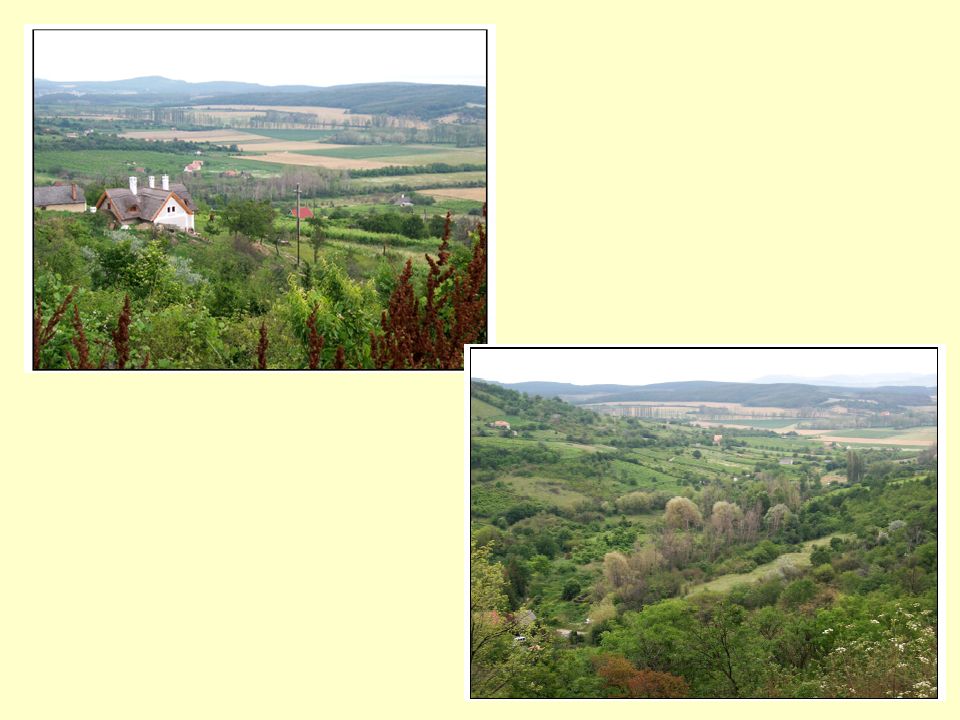
Situation Study Area Pécsely Basin: 24 km²

4
Objectives of the study Which land use changes have recently occured and where? Determine the landscape characteristics influencing the spatial pattern of the land use transitions Can we use information from past changes to predict patterns future land use change? Investigate the impact of recent and future land use changes on soil erosion and sediment yield

5
Method Satellite images (spatial pattern of the changes; resolution 30m) 1992: Landsat 4 Thematic Mapper 2003: Aster Aerial photographs (parcel size, …) Physiographic characteristics Digitizing test sites Supervised classification 77% accuracy
 1992: Landsat 4 Thematic Mapper 2003: Aster Aerial photographs (parcel size, …) Physiographic characteristics Digitizing test sites Supervised classification 77% accuracy")
6
Topography Pécsely Vászoly

7
Land Use Pécsely Basin 2003 Based on Aster satellite image Arable land Pasture Vineyard Forest Build up area 2003

9
Historical land use changes Land use around Pécsely in 1955 (a) and 1971 (b) Source: Museum of Military History, Budapest
 and 1971 (b) Source: Museum of Military History, Budapest")
10
Historical land use changes 1949:Start collectivisation 1952:Opposition against collectivisation 1955: Collectivisation 1956: Revolution against collectivisation 1957:Flexibilization 1961: “Complete” collectivisation (90%) 1968:New economic mechanism (more independent farms) 1989:Republic Privatization 1994:Farmers can claim their land back
 1968:New economic mechanism (more independent farms) 1989:Republic Privatization 1994:Farmers can claim their land back")
11
Recent land use changes Comparison of satellite images and aerial photographs Construction of land use transition maps Analysis of the characteristics of the transition zones Calculation of conditional transition probabilities

12
Arable land: equal area; smaller parcels Heterogeneous pattern 1992 Based on landsat satellite image 2003 Based on Aster satellite image Recent land use changes

13
Evolution in land use (1992 –2003) Unchanged: 1066 ha (44%) 5 changes in red represents 72% of all changes Land Use Changes (in Ha) No change Changed to arable land Changed to pasture Changed to vineyard Changed to forest Build up area
 Unchanged: 1066 ha (44%) 5 changes in red represents 72% of all changes Land Use Changes (in Ha) No change Changed to arable land Changed to pasture Changed to vineyard Changed to forest Build up area")
14
Actual land use changes Arable land Pasture166 ha Pasture Arable land108 ha Forest181 ha VineyardArable land164 ha Pasture220 ha Forest102 ha

15
Statistical analysis Parameters Hight Slope Soil texture Distance to road Distance to village

16
Statistical analysis The problem: which factors control land use changes ? Relative importance of different factors ? Prediction of future land use changes ? Which variables contribute significantly to the land use change pattern Chi-square analysis Logistic regression

17
Conclusion Statistics Which physical and “infrastructure” parameters determine the spatial pattern? Small differences observed between both methods because the first one handles with categorical variables and the second one with continuous variables. Chi-square analysis handles each factor separately.

18
Transition Probabilities Based on the logistic regression analysis Transition probability map for each type of land use conversion Probability map arable land to pasture Probability map pasture to arable land Probability map pasture to forest

19
Simulation of Land Use Changes Stochastic allocation procedure was used to generate land use pattern for different scenarios Predictions for 2015 when the actual trend persists??? Arable land Pasture Vineyards Forest

20
Consequences of Land Use Changes WATEM/SEDEM is a spatially distributed erosion and sediment delivery model (Van Rompaey et al., 2001, Van Oost et al., 2000, Verstraeten et al., 2002)
")
21
Hillslope Sediment routing CALCULATION OF DISTRIBUTED PATTERN OF MEAN ANNUAL TRANSPORT CAPACITY (TC) CALCULATION OF DISTRIBUTED PATTERN OF MEAN ANNUAL SOIL EROSION RATES (E) (RUSLE-based) ROUTING OF SEDIMENT VIA FLOWPATHS TO THE RIVER CHANNELS RIVER CHANNEL TC > E + SED_INPUT TC < E + SED_INPUT SEDIMENT TRANSFER SEDIMENT TRANSFER + SEDIMENTATION SEDIMENT DELIVERY
 CALCULATION OF DISTRIBUTED PATTERN OF MEAN ANNUAL SOIL EROSION RATES (E) (RUSLE-based) ROUTING OF SEDIMENT VIA FLOWPATHS TO THE RIVER CHANNELS RIVER CHANNEL TC > E + SED_INPUT TC < E + SED_INPUT SEDIMENT TRANSFER SEDIMENT TRANSFER + SEDIMENTATION SEDIMENT DELIVERY")
22
Results (erosion reduction) Pécsely SY: 0.030 ton/ha year (1975 – 1994) Kali Basin SY: 0.018 ton/ha year (1981 – 1989) Very low SDR-values as a consequence of relatively flat centre of the basin Predictions for 2015???
 Pécsely SY: ton/ha year (1975 – 1994) Kali Basin SY: ton/ha year (1981 – 1989) Very low SDR-values as a consequence of relatively flat centre of the basin Predictions for 2015")
23
Conclusions 1949 – 1989:Collectivization 1989 – 2004:Privatization Fragmentation Increase of non-cultivated areas Driving Forces: (Chi² and Logistic Regression) Transition Probability Maps Scenario Development GEOMOPRHOLOGICAL IMPACT Forest: 715 to 963 ha Pasture: 526 tot 633 ha Vineyards: 636 to 272 ha Arable land: constant
 Transition Probability Maps Scenario Development GEOMOPRHOLOGICAL IMPACT Forest: 715 to 963 ha Pasture: 526 tot 633 ha Vineyards: 636 to 272 ha Arable land: constant")
24
Thank You !!!

Similar presentations