Download presentation
Presentation is loading. Please wait.

1
Dr. Richard N. Palmer, Margaret A. Hahn, Dr. Azad Mohamadi, Dennis Kessler, Joe Dvorak Department of Civil and Environmental Engineering University of Washington palmer@u.washington.edu http://maximus.ce.washington.edu/~palmer/ A Computer Assisted Decision Support System Portland Water Bureau’s Storage and Transmission Model (STM)
.")
2
A Context for Planning Components of the PWB system Modeling Approach The STM Decision Support Goals of the Talk

4
Concerns over water supply change over time We care about different things now

6
Endangered Species Growing Urban Demands Climate Variability

7
The Two Basic Problems Out-of-stream water use highest during the summer This pattern coincides with driest season of the year Precipitation (mm) Scaling Factors
 Scaling Factors")
11
Planning Process Drivers for IMP Stakeholder Interest Wholesale contract renewal (2005) Water shortage Governance Issues (Wilsonville Tigard) Clackamas Consortium to evaluate transmission Reliability/Vulnerability
 Water shortage Governance Issues (Wilsonville Tigard) Clackamas Consortium to evaluate transmission Reliability/Vulnerability")
12
Potential Role from “Strategic Direction and Mission” Be the regional water supplier Supply Multnomah Counties and others as water is available Serve primarily Portland Serve the historic service base

13
IMP Objectives Provide cost data for contracts Examine emergency supplies Address aging infrastructure Develop evaluation procedures Identify preferred alternatives

14
During the past 50 years, our means of water resource evaluation has changed remarkably The Evaluation of Supply Alternatives Quality of Life Years

15
Active Storage Winter Spring Summer Fall Storage in Reservoirs Simple Operation Concepts Top of Dam Dead Storage

16
Winter Spring Summer Fall Flow in River Flows for Fish

18
Portland System Serves ~ 840,000 people Largest system in state Bull Run Watershed (215 MGD capacity) Columbia South Shore Wellfield 1984 (90 MGD capacity)
 Columbia South Shore Wellfield 1984 (90 MGD capacity)")
19
Bull Run Watershed national forest reserve in 1892 First pipeline built in 1895, 24 miles long. Dam 1 built in 1929 Conduit 4 built to 100 mgd Dam 2 built in 1962 Bull Run System

22
Dam 1

23
Dam 2

24
Bull Run Lake

25
Columbia South Shore Wellfield Emergency back up, Peak demands Seasonal augmentation

26
Mt. Tabor Open Reservoirs

27
Groundwater Pump Gallery

29
Modeling Approach Who will use the model, how will it be used? Facilitate evaluation of a wide range of alternatives Reflect issues of importance to the degree possible Shared Vision of resources, operations and alternatives

30
Modeling Approach Requires modeling environment that is flexible and robust Built conjunctively with Bureau PWB must understand strengths and limitations of model Ownership must be shared by PWB and model developers

31
Questions to be addressed What is the safe yield? What is yield of Dam 3? What is the yield of groundwater? What are the impacts of operations? Is transmission adequate? Should in-town storage be increased? In what year is increased supply required?

32
Primary Alternatives Conservation Expansion of In-Town Storage and Transmission Groundwater Dams ASR Changing of Operating Rules

33
Portfolio of Alternatives EXISTING ConservationGroundwaterDam 3Expansion WEST EAST REGIONAL EXISTING, DAM 3, MEDIUM CONSERVATION EXISTING, HIGH CONSERVATION EXISTING, MEDIUM CONSERVATION REGIONAL, DAM3, HIGH CONSERVATION

35
How do you make a planning process come alive?

36
Hello, my name is STM, But you can win a prize by giving me a better name!

37
Software Selection

38
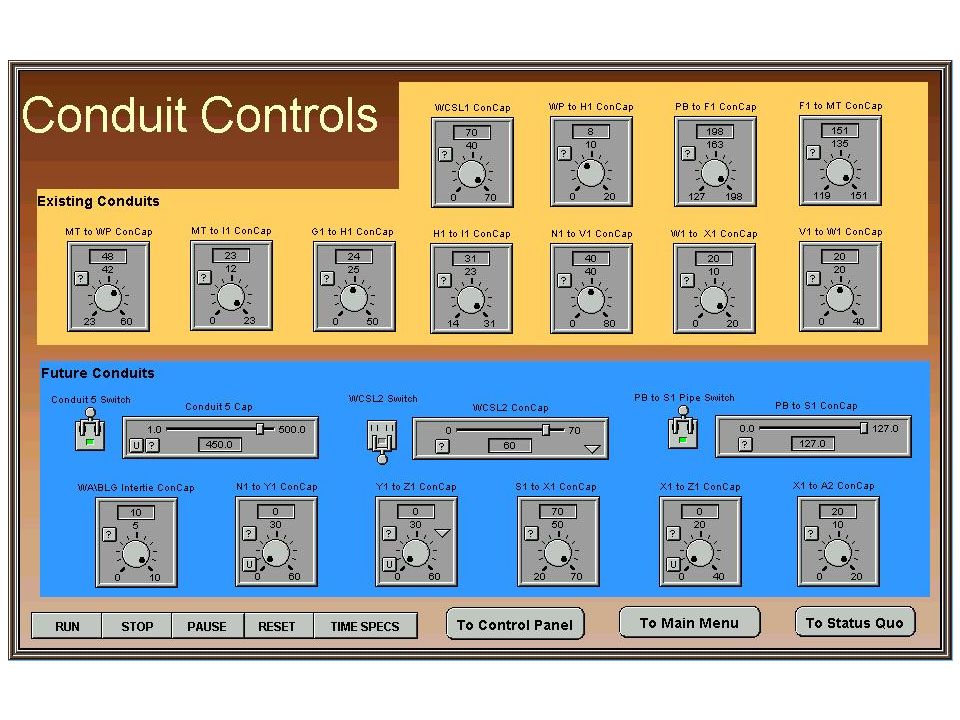
What the model does Tracks daily movement of water Evaluates future water demands In 30 seconds: evaluates 500,000 variables for any year from 1940-1998 for any forecasted period for 60 years

54
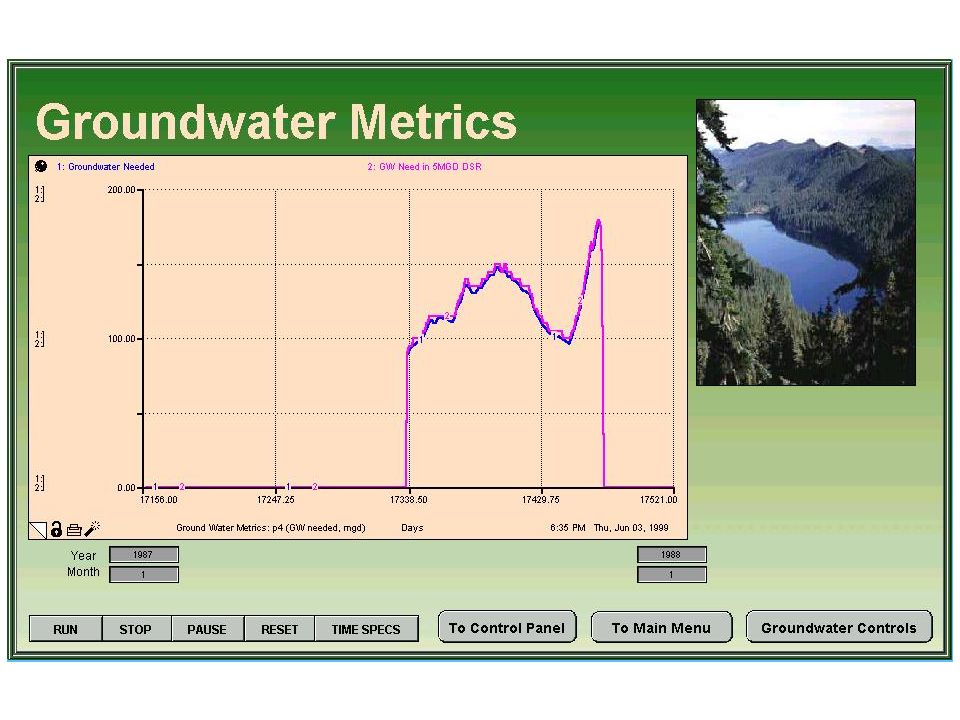
Key Metrics Adequacy of Supply Storage Remaining Groundwater Used, ratio of use Percent Reliability Transmission Shortfall

56
Computer-Aided Decision Support First introduced by MIT and Carnegie Institute in the early 1970’s Goal: to provide information in a format, time-frame, and context to improve decisions Not a replacement for decision-makers

57
First decision support tools Notice attention to detail!

58
Notice stakeholder involvement and outreach program in action Now, lets see, which button was I supposed to push for the paper feed?

59
PWB Team

60
Scenario Process Two iterations were used Describe plausible futures with emphasis on different goals Develop 20 scenarios, evaluate, then further investigate 9 Bring together staff members to view impacts of scenarios with the STM Note surprises, counter-intuitive results, and insights

61
Lessons learned Conservation will play an important role Conduit 5, Powell Butte Reservoirs I&II, Upgrade CSSW, Treatment, Westside ASR Use of groundwater drives Dam 3 Dam 3 could supply regional customers If no expansions in BR, then groundwater More customers with new surface sources requires increased groundwater use

63
Future Activities Automate STM Develop a Bureau systems approach to modeling Integrate models where appropriate Explore role of climate change (climate variability)
")
66
Identify Problems and Objectives Formulate Teams Define the Status Quo Formulate Alternatives Evaluate Alternatives Implement the Plan Exercise the Plan

Similar presentations


 Water Resources Model (MODSIM) Groundwater.>")


