Download presentation
Presentation is loading. Please wait.

1
The Impacts of Climate Change on Portland’s Water Supply Richard Palmer and Margaret Hahn University of Washington Department of Civil and Environmental Engineering and Climate Impacts Group, JISAO Joe Dvorak, Dennis Kessler, Azad Mohammadi Portland Bureau of Water Works

2
Objective of Study Explore the impacts of climate change on –Bull Run Watershed –Hydrology –Water reliability –Policy

3
Talk Overview Introduction Watershed Hydrology Models Impacts on Watershed Impacts on Demands Impacts on System Performance Conclusions

4
Bull Run Watershed

5
Bull Run Watershed Stats Area: 107 square miles Average elevation : 2350 feet Average productivity : 8 cfs/square mile Average Rainfall : 43 inches Average April snowpack : 16 inches SWE

6
Portland System Serves ~ 780,000 people Surface Water –Bull Run Watershed (215 MGD capacity) Groundwater –Columbia South Shore Wellfield (90 MGD capacity)
 Groundwater –Columbia South Shore Wellfield (90 MGD capacity)")
7
Evaluation of Climate Change Meteorological data Climate Shift Hydrology model Calibration Impacts Evaluation Precip and temp Downscaled GCM DHSVM Historic vs Simulated System Simulation model

8
Hydrology Highlights Bull Run is a rainfall driven watershed

9
Hydrologic Characteristics of PNW Rivers

12
Hydrology Highlights Snow melt typically occurs before July

14
Models Used to Evaluate Climate Change General Circulation Models Distributed Hydrology, Soil-Vegetation Model Supply and Transmission Model

15
GCM Models Used HadCM2 and HadCM3 –Hadley Centre of United Kingdom –Used in IPCC report ECHAM 4 –Max Planck Institute of Germany –Used in IPCC report PCM3 –US Department of Defense, US Army Corps of Engineers, Los Alamos National Laboratory

16
Characterizes basin hydrology with –Elevation, aspect and slope data –Soil type and vegetation data –Stream network –Meteorological data –Energy balance for snow –Mass balance for precipitation and run-off DHSVM Distributed Hydrology, Soil-Vegetation Model

18
Temperatures will increase by 2° C by 2040, with higher temperatures in the summer

19
Precipitation will increase in the winter and decrease in the summer.

20
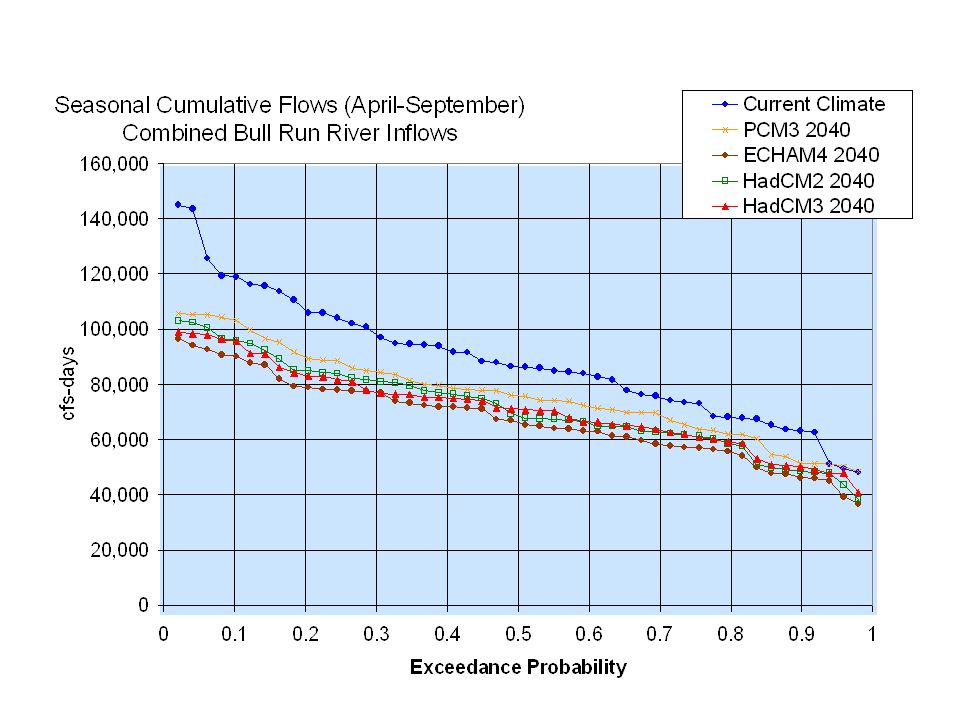
Impacts of Climate Change on Watershed

22
Climate Change Impacts on 1966 Hydrology

23
Impacts on Watershed More precipitation, but less snow –Higher winter flows, lower spring flows Lose spring snowmelt Cumulative spring and summer flows reduced by 20,000 cfs-days or by 20% of current climate cumulative flows

24
ECHAM4 Decade 2040 Climate Change Impacts measured as Reduced Storage Value from Current Climate/ 2000 Demands

25
Impacts on Storage

26
Impacts of growth and climate change on reduced storage climate change and growth growth climate change Exceedance Probability of Reduced Storage Value from Current Climate and 2000 Demands

27
Simple Translation Forecasted Regional Growth will result in 40 mgd additional demand Climate change impacts will increase this by another 20 mgd

28
Conclusions Rainfall controlled system Temperature signal of 2 C Climate impacts are not uniform Shift in quantity and timing of snowpack Impacts of climate reduces storage 2.8 BG Average loss of 20 mgd due to climate change Climate change is only one factor that will contribute to the need for more “supply”

Similar presentations