Download presentation
Presentation is loading. Please wait.

1
Margaret Hahn and Dr. Richard Palmer University of Washington Department of Civil and Environmental Engineering Climate Impacts on PNW Municipal Water Supplies

2
Objective and Outline Assess the impacts of climate change on three neighboring water supply systems Conclusions Background Method Results Response

3
Conclusions Climate impacts on the four basins’ hydrology are similar Average percent difference in seasonal flows –2020 Winter : 28% 2020 Spring : -20% –2040 Winter : 37% 2040 Spring : -31% Absolute average percent difference –Sultan : 31% –Tolt : 18% –Cedar : 36% –Green : 32% Average supply system impact is 15-17% increase in System Use (surface storage, groundwater and/or system shortfalls)
")
6
Background

8
Evaluation of Climate Change Climate Shift Meteorological Data Hydrology Model Demand Model Operations Model

9
Precipitation will increase in the winter and decrease in the summer. Temperatures will increase by 2° C by 2040, with higher temperatures in the summer

10
DHSVM Distributed Hydrology-Soil-Vegetation Model

11
DHSVM Calibration

12
Sultan River Inflows into Spada Reservoir Average Annual Hydrograph

13
Tolt River Inflows into Tolt Reservoir Average Annual Hydrograph

14
Cedar River Inflows into Chester Morse Reservoir Average Annual Hydrograph

15
Green River Inflows into Howard Hansen Reservoir Average Annual Hydrograph

16
Ranked Cumulative Winter Flow (JFM) 2040 32%43% cfs- weeks
 %43% cfs- weeks")
17
Ranked Cumulative Spring (AMJ) Flow 2040 -30% cfs- weeks
 Flow % cfs- weeks")
18
Results – Impacts on Hydrology Percent difference from current climate cumulative seasonal flows JFMAMJJFMAMJ Mean Absolute Percent Difference 2020 2040 Sultan32-1843-3031 Tolt16-1620-2118 Cedar36-2349-3636 Green28-2537-3732 Average 28-2037-31

19
Water Supply System Analysis CRYSTAL Cascade Regional Yield Simulation and Analysis Model Simulation model of Puget Sound water supply Considers future demands, policies, supplies and infrastructures Uses weekly time step Developed in Powersim

20
Picture of Crystal

22
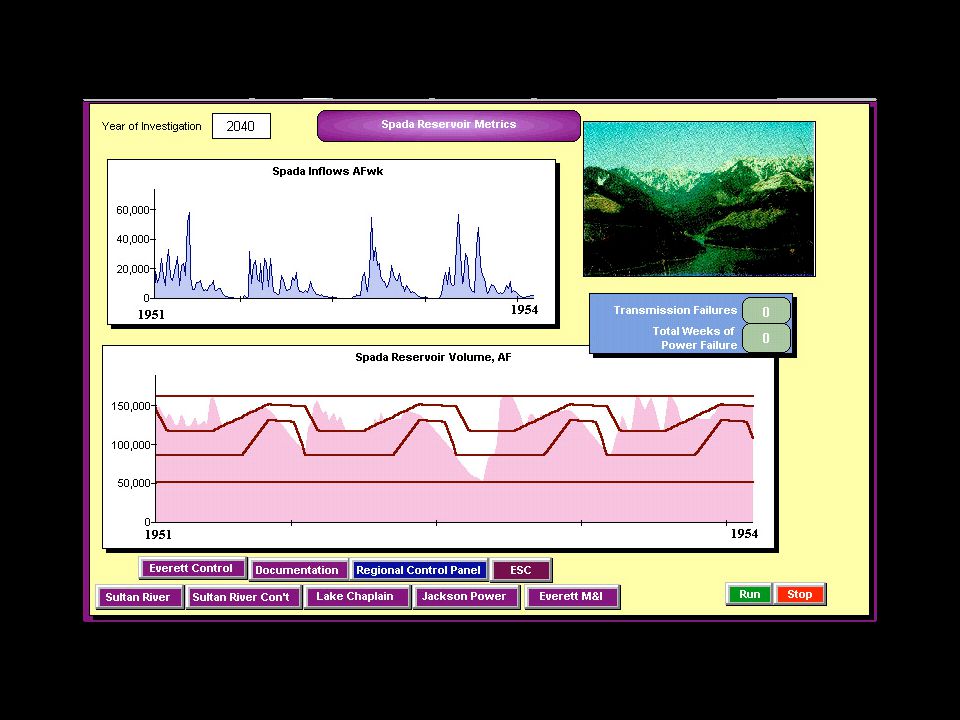
Sultan River, Spada Reservoir – Supply Used Max – 37% Min – 0% Avg – 15%

23
Cedar/Tolt – Supply Used plus Shortfalls Max - 32% Min - 17% Avg - 12%

24
Green – Supply Used Max - 28% Min - 2% Avg - 16%

25
Climate Impact on Water Supply Average climate impact on Supply Used, Percent Difference from Current Climate BasinMaxMinAvg Sultan37015 Cedar/Tolt321217 Green28216

26
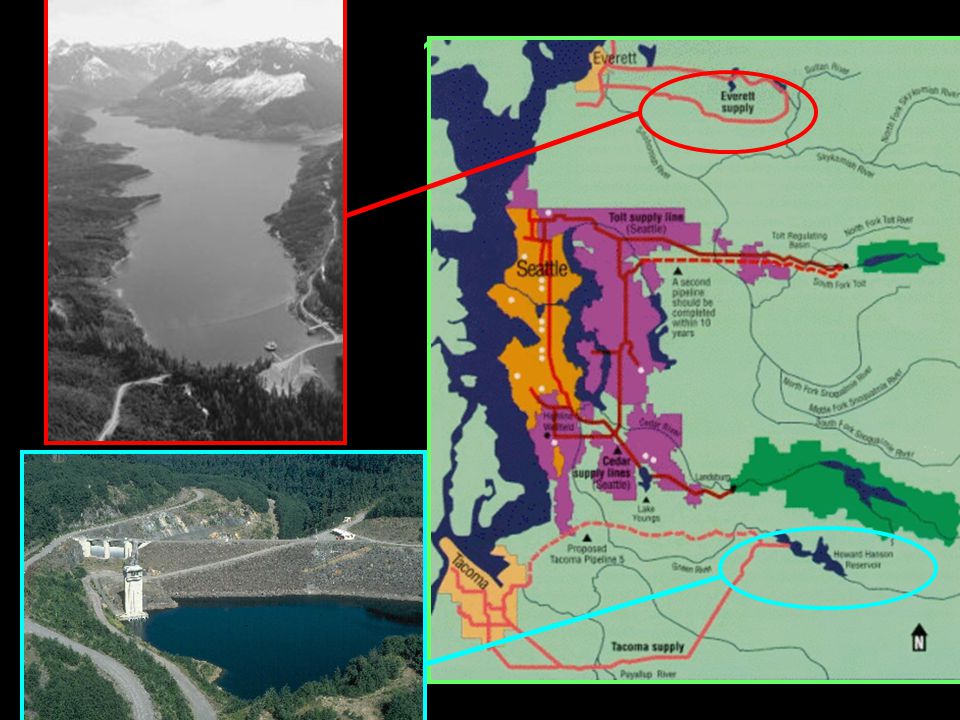
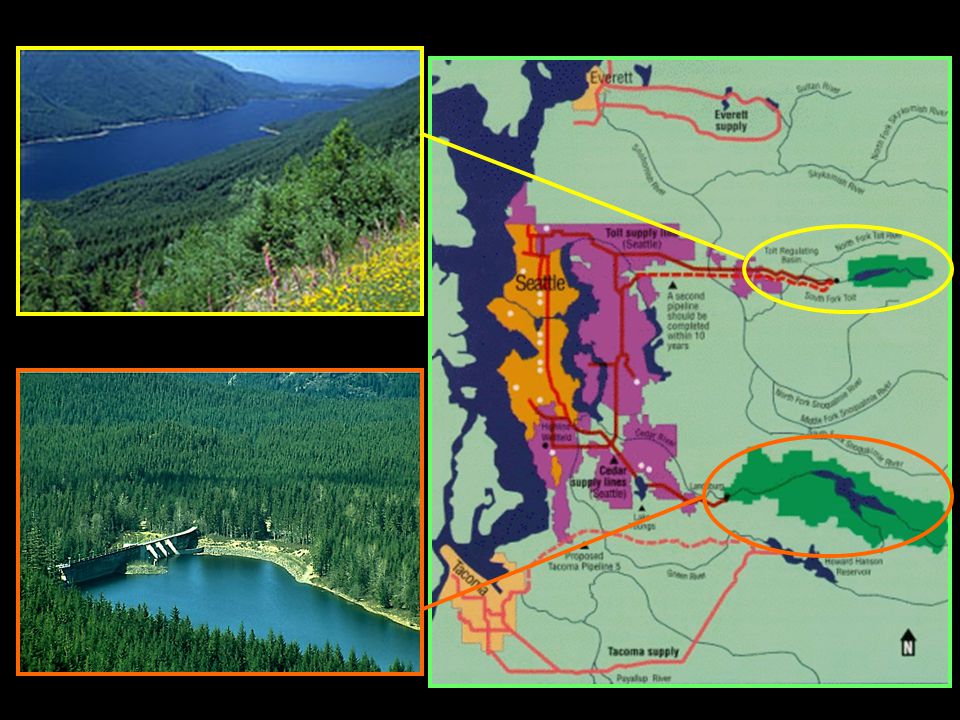
Possible Reactions to Climate Change Information Supply –Tacoma to Seattle Connection (2 nd Supply Project) –Seattle to Everett Connection –Water Reuse Demand –Conservation Measures –Pricing –Change Service Base
 –Seattle to Everett Connection –Water Reuse Demand –Conservation Measures –Pricing –Change Service Base")
29
10,000 acre-ft ~~ 3333 mgal difference in the amount of storage used due to climate change Assume 100 day storage drawdown period Assume 1.3 million customers How much would each person have to conserve? 23 gal per capita during drawdown

30
Estimated Daily per Capita Water Use, Indoor/Outdoor 95 gpd

31
Estimated Daily per Capita Water Use, Indoor/Outdoor 72 gpd Overall reduction 25% 72 gpd Reduce outside use 33%10 gpd Upgrade toilets 37%7 gpd Upgrade clothes washer 20%3 gpd Upgrade shower head 23%3 gpd Total23 gpd

32
Margaret Hahn and Dr. Richard Palmer University of Washington Department of Civil and Environmental Engineering Climate Impacts on PNW Municipal Water Supplies

Similar presentations

 are anticipated.>")


 the water year for which the December to February Sea Surface Temperature in the NINO 3.4.>")


