Download presentation
Presentation is loading. Please wait.

1
State Implementation Plans Could Rule Your Life or why NAAQS Are Important Chuck Sams R9 Air Quality Program Manager

2
National Ambient Air Quality Standard (NAAQS) 1970 CAA National target for an acceptable concentration of a specific, criteria pollutant in air: –primary standard to protect public health based entirely on health-related information, without considering the costs. –secondary standard to protect public welfare includes effects on soils, water, crops, vegetation, buildings, property, animals, wildlife, weather, visibility, transportation, and other economic values, as well as personal comfort and well-being.

3
State Implementation Plan (SIP) 1970 CAA Subset of a State’s Air Agency Rules. Those rules dealing with the attainment and maintenance of NAAQS. Includes Every guideline, letter, graph, table, legal & regulatory opinion, decision, and emission budget in a State’s Air Agency files dealing with the attainment and maintenance of NAAQS.

4
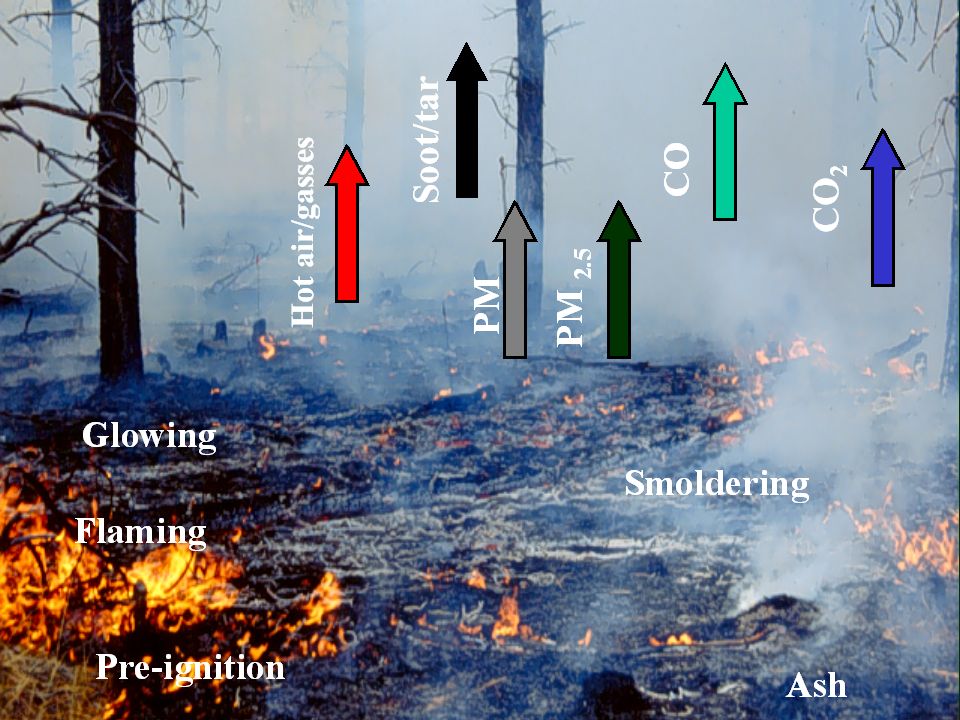
Criteria Pollutants Ozone – Secondary Pollutant: Sunlight + NOx + VOCs Particulate Matter – Secondary Pollutant: e.g. Particles derived from NOx or VOCs – Primary Pollutant: e.g. Soot Particles Nitrogen Oxides Carbon Monoxide Lead Sulfur Dioxide

5
Ozone – old 1-hour std: 0.120 ppm – new 8-hour std: 0.08 ppm Particulate Matter – old PM 10 std: 150 µg/m 3 average for 24 hours 50 µg/m 3 annual average – new PM 2.5 std: 65 µg/m 3 average 24 hours 15 µg/m 3 annual average Most Important NAAQS re: Fire

6
NOx Reactions: – NO 2 + sunlight NO + O – O + O 2 O 3 – NO + O 3 NO 2 + O 2 VOC Reactions: – VOC + OH RO 2 + H2O – RO 2 + NO NO 2 + RO National Ambient Air Quality Standards NOx + Sunlight + VOCs = Ozone *8-hour Ozone standard: 0.08 ppm

7
(similar size to pollen) (similar size to fly ash) (similar size to dust) *Annual PM 2.5 standard = 15 µg/m 3
 (similar size to fly ash) (similar size to dust) *Annual PM 2.5 standard = 15 µg/m 3")
8
Smoke Air expelled from the lungs is twice as clean as what entered.

9
No monitoring data from a Federal Reference Method Monitor? Then, no violation of the NAAQS! Even so, High pollutant concentrations can lead to: – Placement of a FRM Monitor nearby – Reconsideration of the SMP and/or SIP – Stricter rules for you and your neighbors

10
1-hr and likely 8-hr Ozone Non-Attainment Areas* * Based on 8-hr values during 1999-2001. Final designation will be based on 2000-2002 data.

11
1-hr and likely 8-hr Ozone Non-Attainment Areas* * Based on PM2.5 values during 1999-2001. Final designation will be based on 2000-2002 data. PM 10 and likely PM 2.5 Non-Attainment Areas*

12
Potential PM 2.5 and 8-hour Ozone Non-attainment Areas Based on FRM Monitoring Data from 1999-2001 Everything, including NFS Lands

13
1-hr and likely 8-hr Ozone Non-Attainment Areas*PM 10 and likely PM 2.5 Non-Attainment Areas*NFS Lands Potentially Affected by Ozone Standards* * Based on 8-hr values during 1999-2001. Final designation will be based on 2000-2002 data.

14
1-hr and likely 8-hr Ozone Non-Attainment Areas* * Based on PM2.5 values during 1999-2001. Final designation will be based on 2000-2002 data. NFS Lands Potentially Affected by PM Standards

15
EPA is developing a two-phase, integrated implementation strategy for the ozone, particulate matter, and regional haze programs. EPA Proposes to Integrate Implementation of the Ozone and PM Standards Both pollutants are formed under similar atmospheric conditions by gases (e.g. NOx and VOCs) emitted from the same type of sources. Both remain in the air for days, and can travel hundreds of miles from their origins. Both cause respiratory symptoms and other serious health problems in sensitive populations
 emitted from the same type of sources. Both remain in the air for days, and can travel hundreds of miles from their origins. Both cause respiratory symptoms and other serious health problems in sensitive populations.")
16
Harmonization of 8-hr O 3, PM 2.5, & Regional Haze SIPs EPA is developing a two-phase, integrated implementation strategy for the ozone, particulate matter, and regional haze programs - April 25, 2003 – o3 Non-Attainment designation Summer 2003 – Propose PM 2.5 NAAQS Implementation Rule. End of 2003 – Finalize O 3 NAAQS Implementation Rule. Summer 2004 – Finalize PM 2.5 NAAQS Implementation Rule. By December 2004 – Designate O 3 and PM 2.5 Non-Attainment Areas. March to June, End of 2005? – Finalize PM 2.5 Transport Rule (including o3 and PM2.5 measures). By December 2007 – States submit SIPs. December 2009 – Attain NAAQS ?? Compiled from information supplied by: Jack Edwardson (EPA OAQPS) and John Silvasi (EPA OAQPS)
. By December 2007 – States submit SIPs. December 2009 – Attain NAAQS . Compiled from information supplied by: Jack Edwardson (EPA OAQPS) and John Silvasi (EPA OAQPS).")
17
General Conformity Rules (i.e. Conformity of Federal Actions to a SIP) You Should: Only apply Rules to Federal actions within Non-Attainment and Maintenance Areas ( EPA & States regulate Federal activities to a greater extent than private… Section 176 CAA ) …HOWEVER… Make Conformity Determinations in conjunction with NEPA process, if practical. Determine your Forest’s Emissions Inventory ASAP. Provide your NFS emission values for inclusion in your State’s Emissions Budget.
 You Should: Only apply Rules to Federal actions within Non-Attainment and Maintenance Areas ( EPA & States regulate Federal activities to a greater extent than private… Section 176 CAA ) …HOWEVER… Make Conformity Determinations in conjunction with NEPA process, if practical. Determine your Forest’s Emissions Inventory ASAP. Provide your NFS emission values for inclusion in your State’s Emissions Budget..")
18
General Conformity Rules (i.e. Conformity of Federal Actions to a SIP) You Should: Make Friends with your state’s Air Quality Regulators ASAP: –Make your Forest’s projected Emission Inventory part of your state’s Emission Budget, and therefore the SIP –and likely avoid having to make Conformity Determinations.
 You Should: Make Friends with your state’s Air Quality Regulators ASAP: –Make your Forest’s projected Emission Inventory part of your state’s Emission Budget, and therefore the SIP –and likely avoid having to make Conformity Determinations..")
19
…However…??? General Conformity is coming for Attainment Areas. SO Prepare and keep Emission Inventories updated for all Forests.

20
Particulate Matter Related to Health Effects Increased premature deaths Aggravation of respiratory or cardiovascular illness Lung function decrements Increased work loss Changes in lung function/structure/natural defense From a recent national study, 0.5% increase of daily deaths for each 10 mg/m 3 increase in PM 10. Seattle and Spokane were two of the 90 cities in the study.

21
Questions

22
Respirable Particles (PM 2.5 ) Irritation of mucous membranes Deposition in respiratory tract Transports carcinogenic PAHs
 Irritation of mucous membranes Deposition in respiratory tract Transports carcinogenic PAHs")
23
Carbon Monoxide (CO) Colorless and odorless Reduces oxygen content of the blood Loss of mental acuity, motor skills, and time awareness Stresses heart May cause death
 Colorless and odorless Reduces oxygen content of the blood Loss of mental acuity, motor skills, and time awareness Stresses heart May cause death")
24
Benzene Irritating to mucous membrane Known carcinogen Respiratory failure at high concentrations

25
No Smoke CO=0ppm Light Smoke CO=15ppm Moderate Smoke CO=30ppm Very Heavy Smoke CO=58ppm Heavy Smoke CO=44ppm

26
Observations In a recent study 3% (prescribed fire) and 1-10% (wildfire) demonstrated exceedances for CO and PM. Mitagation for exposure is simply removal of personnel from smoke environment during normal rest rotation schedules. CO serves as a surrogate for PM 2.5, acrolein, and formaldehyde.

28
20-500 lbs/ton Criteria pollutant Generally limited concentrations from burning effects communities Adverse effects on fireline workers Carbon Monoxide (CO)
")
Similar presentations


 Particulate Matter 2.5 (PM 2.5 ) The Challenge: Air Pollution.>")


 Non-Attainment Areas – Visibility Protection.>")


 van Leeuwen.>")


