Download presentation
Presentation is loading. Please wait.

1
Class 33 PRIMARY PRODUCTIVITY (PP) IN THE OCEANS Photosynthesis and Chemosynthesis Gross and Net Primary Production Cycling of organic matter Controlling factors Seasonal variations at different latitudes Global distribution
 IN THE OCEANS Photosynthesis and Chemosynthesis Gross and Net Primary Production Cycling of organic matter Controlling factors Seasonal variations at different latitudes Global distribution")
4
PRIMARY PRODUCTIVITY (PP) IN THE OCEANS PP = Synthesis of organic matter by autotrophs 1. Photosynthesis by phytoplankton is most important CO 2 + H 2 O - - - - - - - -> “C 6 H 12 O 6 ” + O 2 Sunlight Chlorophyll

5
PRIMARY PRODUCTIVITY (PP) IN THE OCEANS 2. Chemosynthesis, e.g., by sulfur bacteria at hydrothermal vents H 2 S + 2O 2 - - - - - - - -> SO 4 = + Chemical Energy+ water CO 2 + H 2 O - - - - - - - -> “C 6 H 12 O 6 ” + O 2 Bacteria Chemical Energy

6
PRIMARY PRODUCTIVITY (PP) IN THE OCEANS 3. Biosynthesis: Builds essential molecules for life C 6 H 12 O 6 + nutrients (N, P, S, etc.) - - - - > proteins, lipids, DNA, etc.
 > proteins, lipids, DNA, etc..")
7
How much N and P are needed per gram of biomass produced? "Redfield ratio” (average for PP) [CH 2 O] 106 [NH 3 ] 16 [H 3 PO 4 ] C 106 H 263 O 110 N 16 P 1
 [CH 2 O] 106 [NH 3 ] 16 [H 3 PO 4 ] C 106 H 263 O 110 N 16 P 1.")
9
EnergyBiomass

10
Energy and Biomass are transferred through a food web.

11
Biomass

12
Energy

13
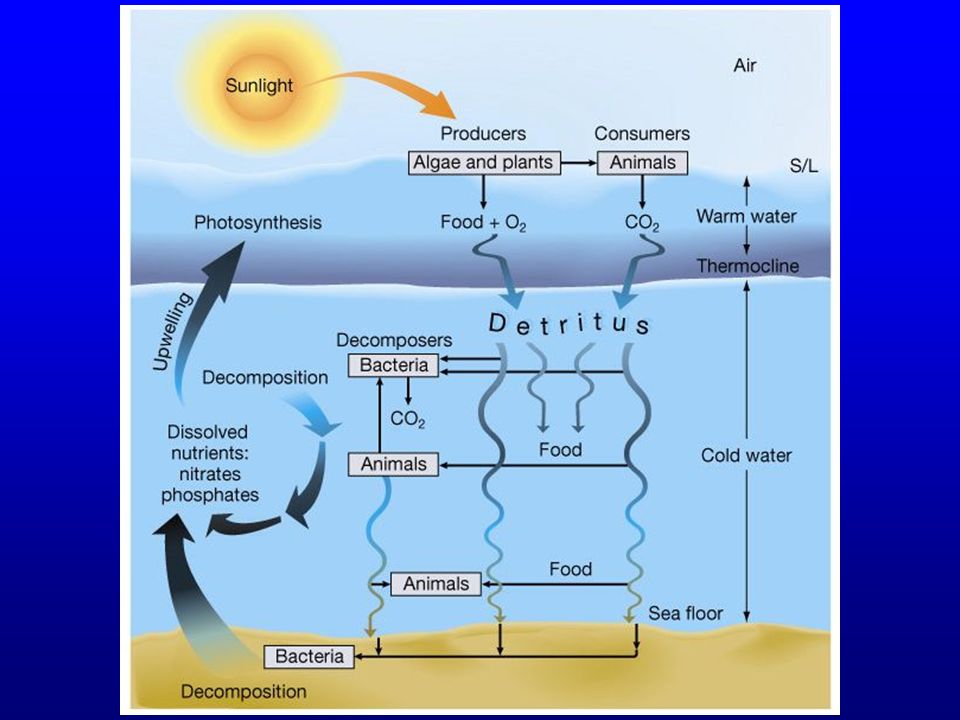
Gross Primary Productivity.. (GPP) = Total amount of organic matter produced by primary producers (phytoplankton) Net Primary Productivity.. (NPP) = GPP minus energy utilized (organic matter respired) by phytoplankton for life processes GPP and NPP are carbon uptake rates, g C / m 2 - yr Biomass, or "standing crop" is "density," g C / m 2 FATE OF ORGANIC MATTER -- HOW PP IS UTILIZED & CYCLED?
 = Total amount of organic matter produced by primary producers (phytoplankton) Net Primary Productivity.. (NPP) = GPP minus energy utilized (organic matter respired) by phytoplankton for life processes GPP and NPP are carbon uptake rates, g C / m 2 - yr Biomass, or standing crop is density, g C / m 2 FATE OF ORGANIC MATTER -- HOW PP IS UTILIZED & CYCLED .")
14
GPP- Total Production by Phytoplankton Organic matter used by phytoplankton to provide energy for themselves 70-90% NPP-Phytoplankton Biomass available to fuel the rest of the food web 10-30%

15
Almost complete recycling Tiny amount lost via deposition in sediments (~0.1% of GPP) ORGANIC MATTER RECYCLING
 ORGANIC MATTER RECYCLING")
16
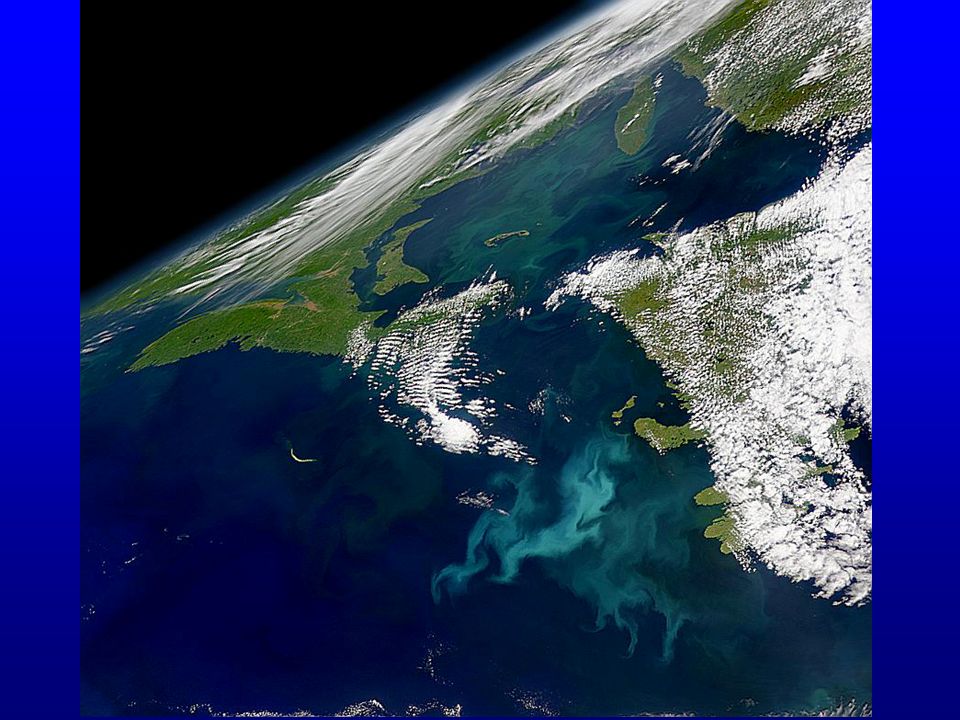
FACTORS CONTROLLING PRIMARY PRODUCTIVITY

17
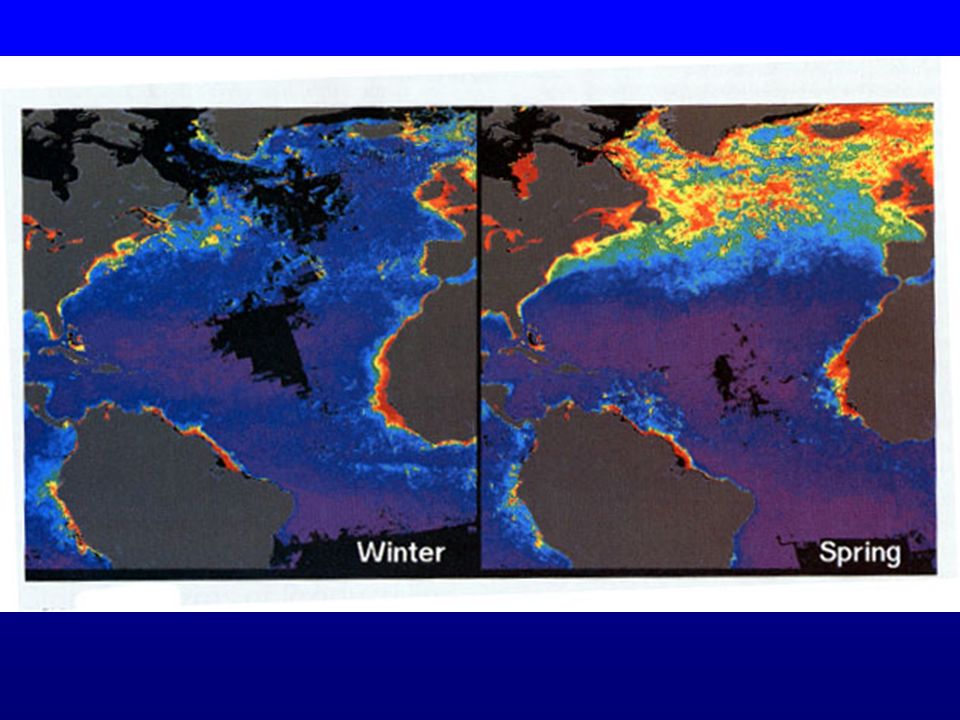
Seasonal Changes- Huge at High Latitude

19
1. Sunlight- …in two different ways A.Photosynthesis B.Stratification of surface waters; caused by seasonal heating –Warm top layer- less dense –Sits on top (w/ phytoplankton) FACTORS CONTROLLING PRIMARY PRODUCTIVITY
 FACTORS CONTROLLING PRIMARY PRODUCTIVITY.")
20
Winter mixing- convection Phytoplankton get less lightPhytoplankton get less light But nutrients are brought up (for later)But nutrients are brought up (for later) COLD
But nutrients are brought up (for later) COLD")
22
Constantly removed from surface waters by PP and sinking of organic matter Can be replenished by: 1.Winter mixing... 2. Nutrients: COLD

23
Constantly removed from surface waters by PP and sinking of organic matter Can be replenished by: 1.Winter mixing... 2. Upwelling 3. Land-derived nutrients (rivers, dust) 2. Nutrients:
 2. Nutrients:.")
25
Stratification- good and bad

28
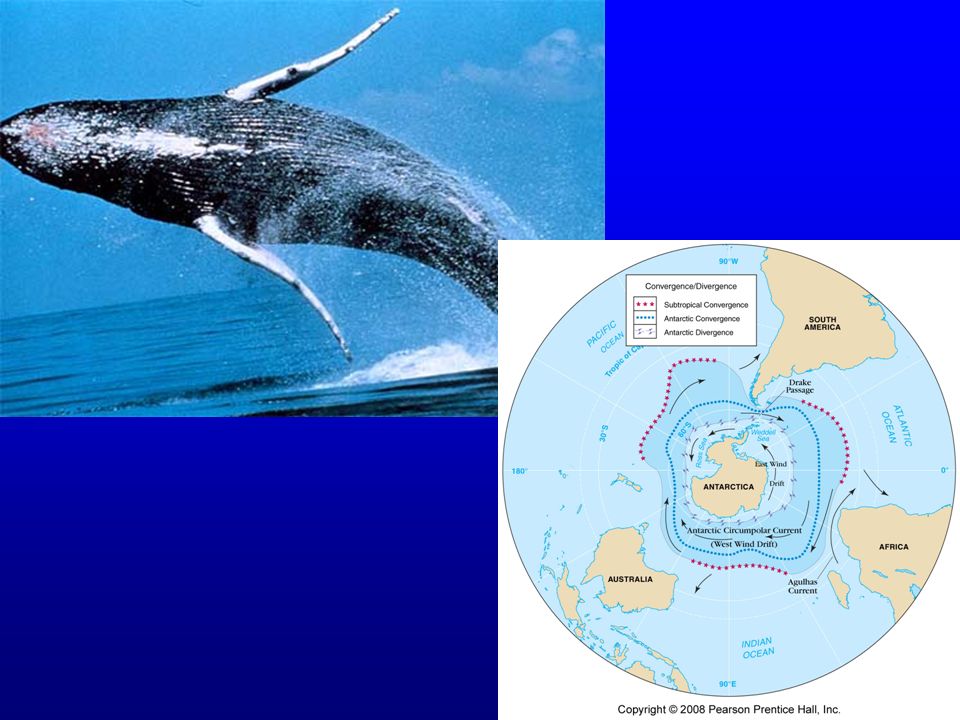
3. Grazing by herbivores: Reduces... Amt of living Phytoplankton, and thus…Amt of living Phytoplankton, and thus… Rate of primary productionRate of primary production FACTORS CONTROLLING PRIMARY PRODUCTIVITY

29
Krill

30
SEASONAL PRODUCTIVITY PATTERNS AT DIFFERENT LATITUDES

31
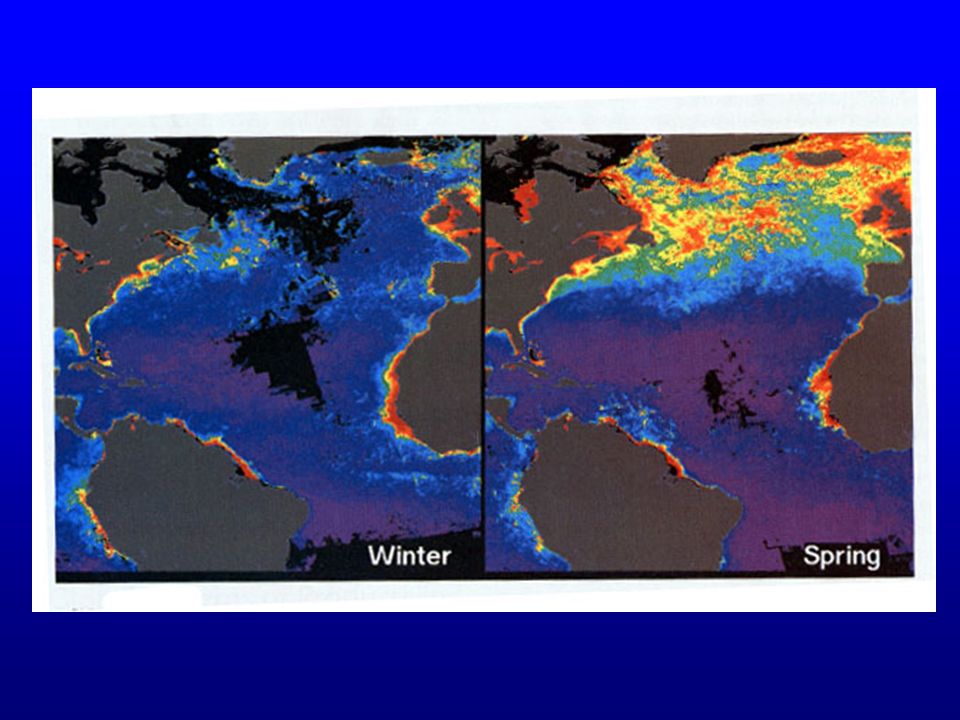
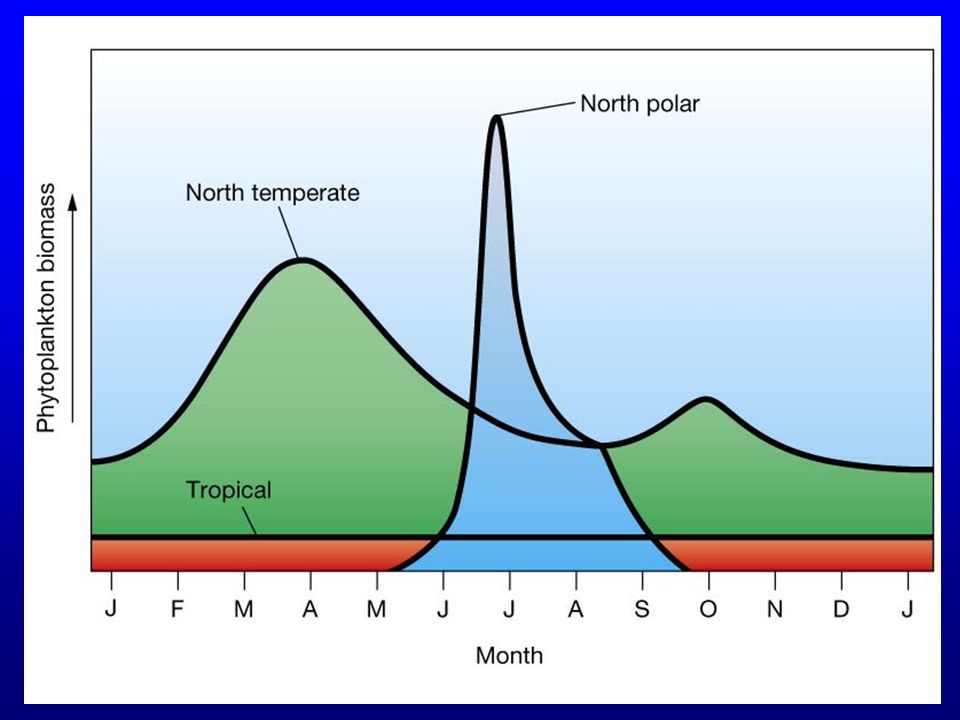
1. High-latitude: One intense spring/summer "bloom" Nutrients abundant after winter mixingNutrients abundant after winter mixing Bloom initiated by increased sunlightBloom initiated by increased sunlight Warming --> water stratificationWarming --> water stratification --> phytoplankton remain near surface- sun! Productivity controlled mostly by sunlight SEASONAL PRODUCTIVITY PATTERNS AT DIFFERENT LATITUDES

34
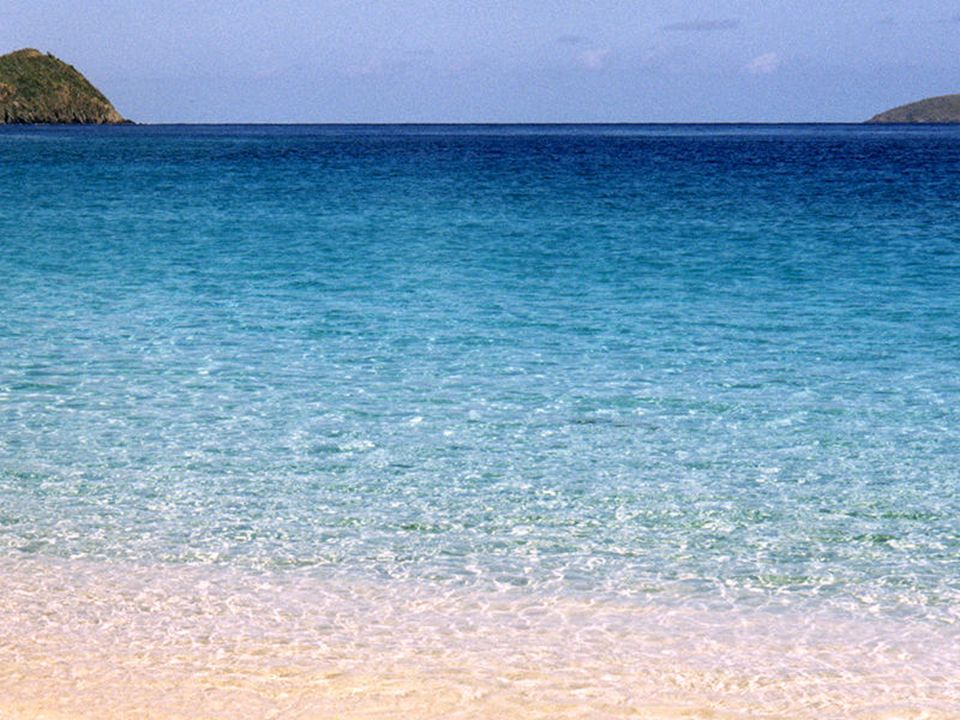
High-intensity sunlight all year Density-stratified surface watersDensity-stratified surface waters Little vertical mixing, thus low nutrient levelsLittle vertical mixing, thus low nutrient levels Exception: Upwelling areas.Exception: Upwelling areas. Productivity controlled by nutrient availability Tropical oceans (low latitude) Relatively low productivity throughout the year
 Relatively low productivity throughout the year.")
38
Mid-latitude primary productivity: Complex annual cycle

39
Winter: Mixing: Nutrients available But sunlight is limiting Mid-latitude: Spring + Late Summer "blooms”

40
Spring: Increased sunlight + water stratification Intense bloom Mid-latitude: Spring + Late Summer "blooms”

41
Mid Summer: Nutrients depleted Grazing reduces phytoplankton biomass Productivity decreases Mid-latitude: Spring + Late Summer "blooms”

42
Late Summer/ Early Fall: Nutrients released (by death/decay; or excreted by animals) --> Second, less intense bloom results Mid-latitude: Spring + Late Summer "blooms”
 --> Second, less intense bloom results Mid-latitude: Spring + Late Summer blooms")
43
Fig. 13-13 Mid-latitude: Spring + Late Summer "blooms”

45
Mid-latitude: Productivity controlled by both sunlight and nutrient availability

46
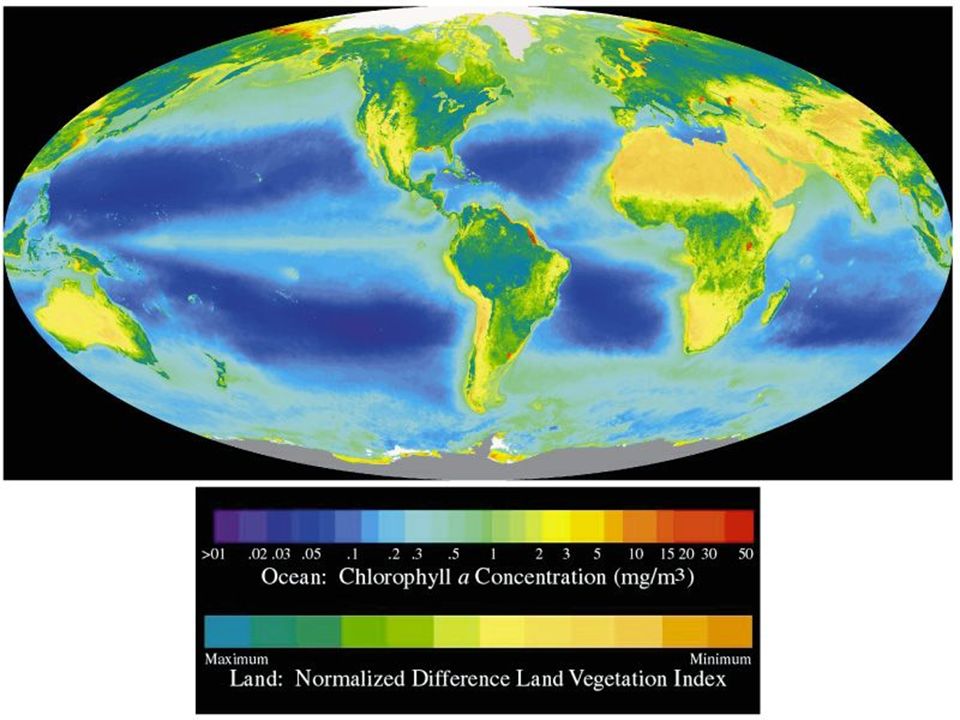
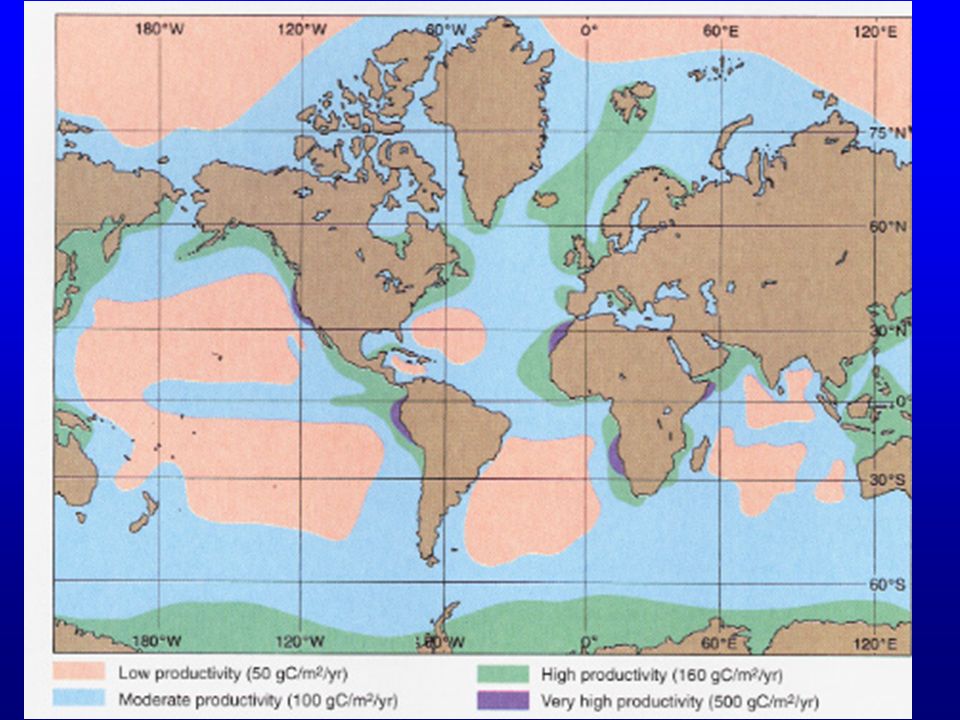
Global Distribution of Primary Productivity

47
1. Open oceans- non-upwelling areas Low nutrients --> low PP rates 2. Open Ocean Upwelling areas: equatorial + High-Lat. --> Moderate to high PP rates

48
3. Continental shelves High nutrients (runoff; nutrients recycled- can’t sink out of surface system) --> high PP rates
 --> high PP rates.")
50
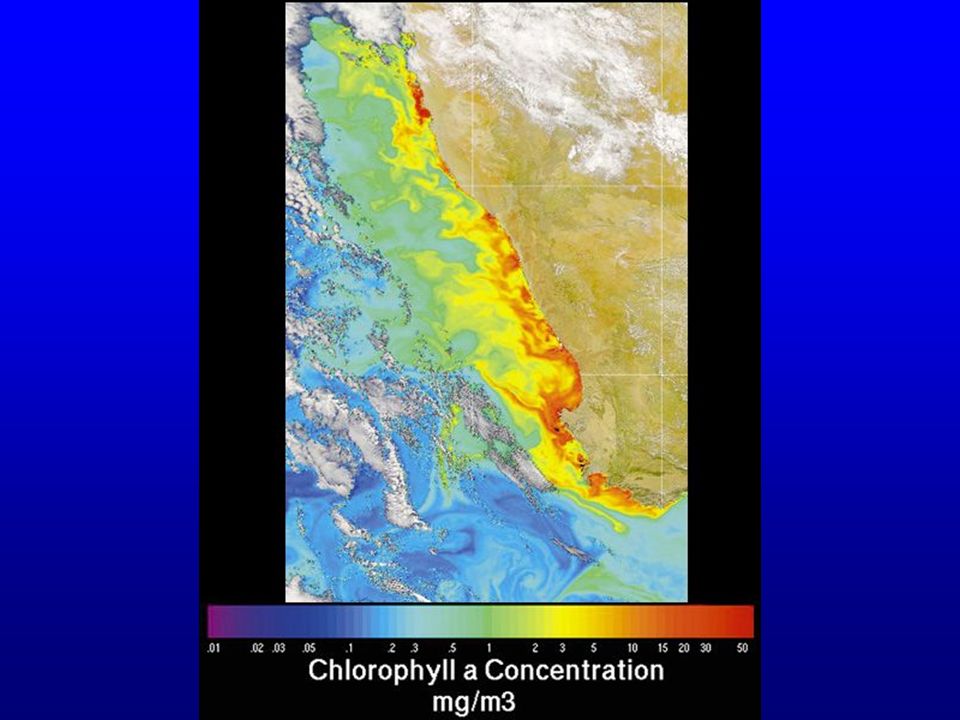
4. Coastal upwelling at low latitudes High nutrient supply + low-latitude sunlight --> very high PP rates 5. Estuaries Nutrients abundant- land runoff Very efficient nutrient recycling --> very high PP rates GLOBAL DISTRIBUTION OF PRIMARY PRODUCTIVITY (PP) (cont’d)
 (cont’d).")
Similar presentations


 Or biomass added per unit area per.>")


 –Photosynthesis –Chemosynthesis CO.>")

 Gross (total) production = total C fixed Net production = C remaining after respiration Standing.>")


 and all the abiotic factors that they interact with. Ecosystems receive.>")

