Download presentation
Presentation is loading. Please wait.

1
Open Oceans: Pelagic Ecosystems II

2
Global scale patterns of pelagic productivity

3
What are controlling processes?
Primary Productivity Different estimates of productivity Gross Primary Productivity Net Primary Productivity Standing crop and Grazing Rates

4
What is “productivity”?
primary productivity is defined as the total quantity of carbon fixed by autotrophs a rate expressed as grams of carbon fixed per square meter of sea-surface per unit of time gross primary production is the total amount of organic matter produced by autotrophs net primary production is the energy remaining after respiratory needs have been met NPP = Gross Primary Production - Respiration

5
Questions to consider Why should we care about patterns of biological productivity in oceans? What are the spatial patterns of productivity? What mechanisms promote or limit productivity?

6
Why should we care about productivity?
Photosynthetic activity in oceans created current O2-rich atmosphere Plankton form ocean sediments & fossil fuels Plankton are a critical part of “carbon pump” that influences atmospheric CO2 Phytoplankton form the base of food webs and associated biological diversity Limits to productivity may limit the amount of harvestable biomass from ocean ecosystems

7
Measuring Primary Productivity: Data
Standing crop methods Chlorophyll concentration (water extraction, satellite) Cell counts (flow cytometers) Rate measurements Light-dark bottle method Carbon-14 uptake Advantages & disadvantages
 Cell counts (flow cytometers) Rate measurements. Light-dark bottle method. Carbon-14 uptake. Advantages & disadvantages.")
8
chlorophyll density & temperature

9
Link between producers & grazers

10
Measuring Primary Productivity: Inferences
Each direct measure of GPP has disadvantages Computer models integrate different parameters to estimate rates of productivity through the water column and over time Model components (Field et al. Science 281: ) chlorophyll concentration water depth in photic zone fraction of water column where photosynthesis is light-saturated surface temperature
 chlorophyll concentration. water depth in photic zone. fraction of water column where photosynthesis is light-saturated. surface temperature.")
11
Results of productivity model

12
Some patterns average primary productivity in the oceans is ~50 g C/m2/yr 300 g C/m2/yr considered relatively high rate of primary productivity low rates of primary productivity typically 20 to 30 g C/m2/yr What accounts for this variation?

13
Comparing the makeup of water and plankton
Mean Elemental Ratios of N, and P Organisms: 16.0N / 1P Sea Water: 14.7N / 1P On average, seawater lacks sufficient organic N to take advantage of the available phosphorus

14
Limited water mixing further limits nutrient availability

15
Testing models: measuring plankton in open oceans
Techniques for studying plankton consumers Plankton levels may be dropping (NASA study)
")
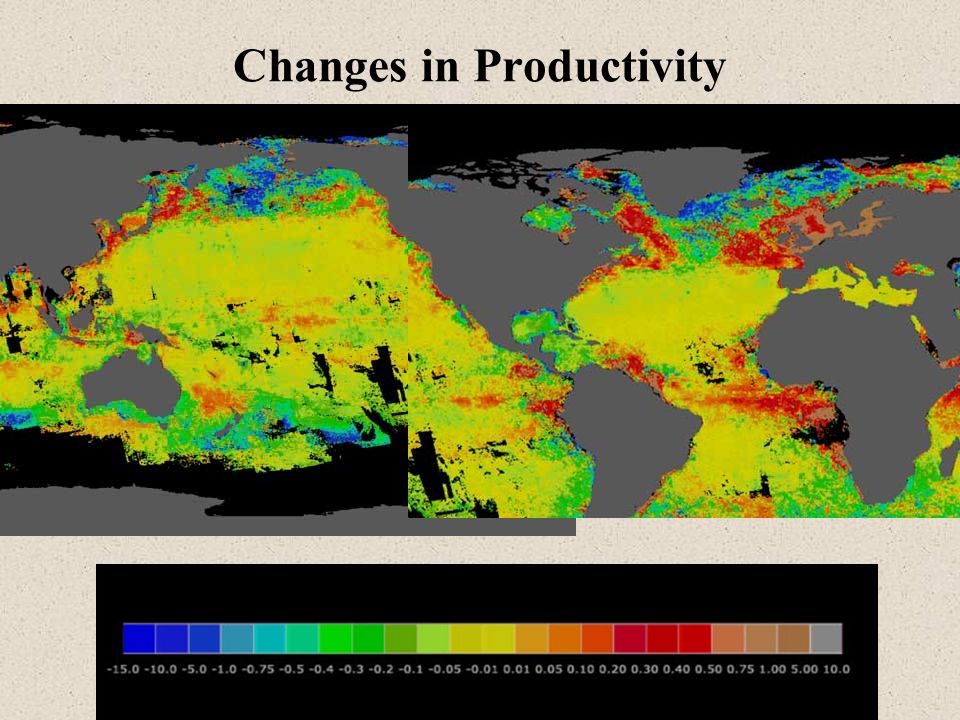
16
Changes in Productivity
17
From productivity to food webs: A size-based pelagic food web

18
Grazing pressure

19
Limits & Flows of NPP

20
Marine “Snow” krill

21
A spatially realistic pelagic food web

22
What are links among trophic levels in pelagic systems?

23
Large phytoplankton vary with depth

24
Nutrient distribution with depth

25
Distribution of food web biomass

26
The global nitrogen cycle

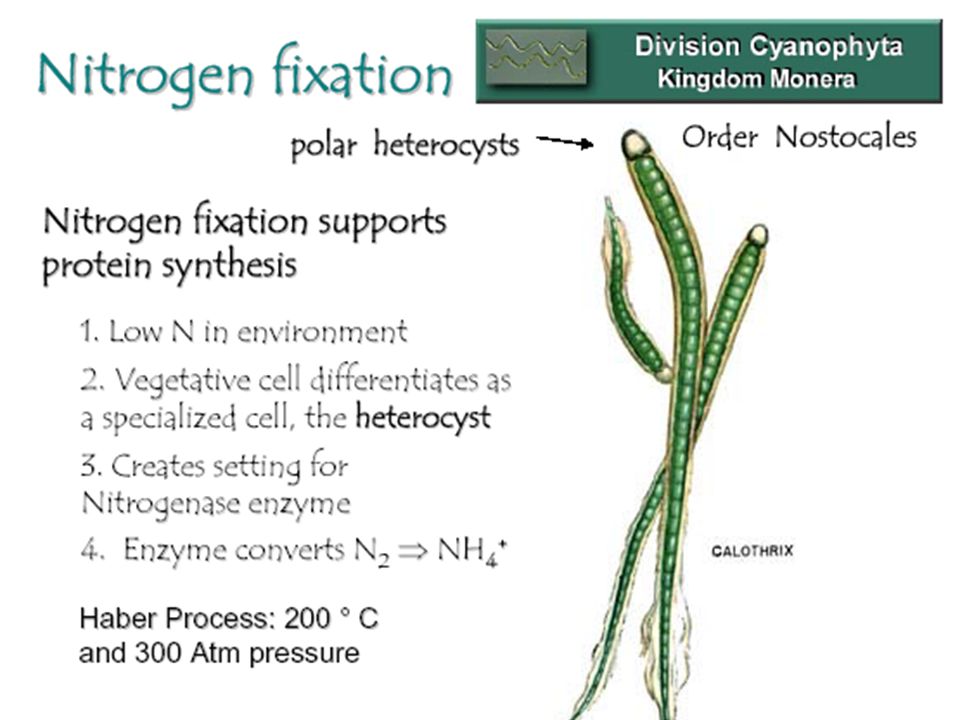
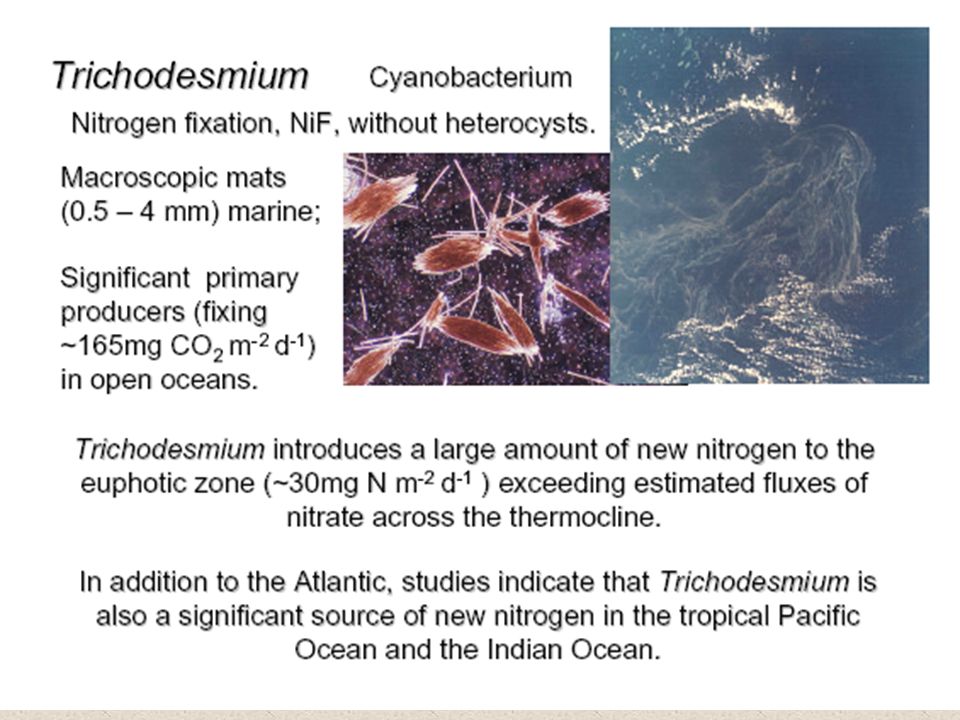
27
Influences on biologically useful Nitrogen

30
Diatom mats can migrate vertically

31
Consequences of active transport of NO3

32
Links to oceanic nekton

Similar presentations


 Or biomass added per unit area per.>")


 Requirements for photosynthesis: sunlight (and chlorophyll to capture energy) nutrients (nitrogen, phosphorus..), space.>")

 - Organism capable of making organic.>")


 –Photosynthesis –Chemosynthesis CO.>")


 Gross (total) production = total C fixed Net production = C remaining after respiration Standing.>")