Download presentation
Presentation is loading. Please wait.

1
EPA Report to Congress 2000 (latest available on web) Provided to Dr.G. Powell by Dr. D. Monreau, NCSU for this website

2
Uses for which assessments were made Aquatic life support Fish consumption Primary contact recreation (swimming) Secondary contact recreation Drinking water supply Agricultural
 Secondary contact recreation Drinking water supply Agricultural")
3
Rivers and Streams

4
Rivers and Streams

5
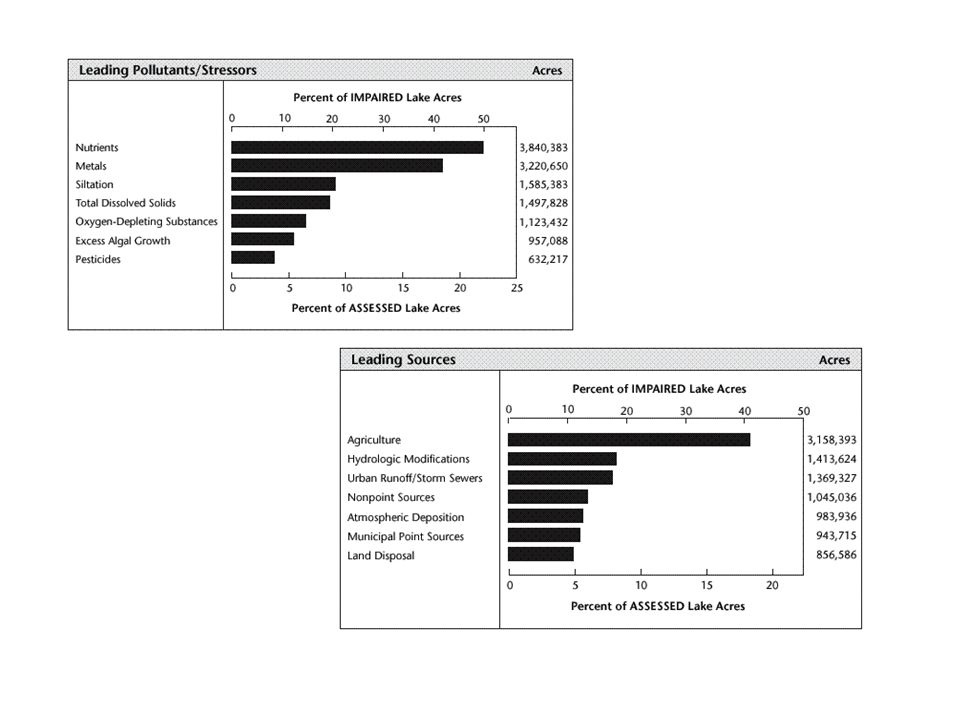
Lakes, Ponds, and Reservoirs

7
Estuarine Waters

10
Oxygen Balance in Streams Balance between Supply and Demand

11
Oxygen Supply

12
Oxygen Resources of Streams Atmosphere Water Oxygen O 2 Conc. Saturation ( equilibrium)
")
13
86 77 68 59 50 41 32 oFoF

14
Water Quality Standard = 5 mg/l

15
Oxygen Demand

16
Water

17
Biological Oxidation of Organic Matter Carbohydrate Oxidation: C x H y O z + O 2 bacteria CO 2 + H 2 O Algal cell oxidation: (CH 2 O) 106 (NH 3 ) 16 H 3 PO 4 + 1.2 O 2 bacteria CO 2 + H 2 O Algae = 34.3% C; 7.1% H; 51.8% O; 6.0% N; 0.8% P (15 lb algae/lb N)
 106 (NH 3 ) 16 H 3 PO O 2 bacteria CO 2 + H 2 O Algae = 34.3% C; 7.1% H; 51.8% O; 6.0% N; 0.8% P (15 lb algae/lb N)")
18
Nitrogen Cycle Animal protein Organic N Plant protein Organic N Ammonia NH 3 and NH 4 + Nitrites NO 2 - Nitrates NO 3 - Atmospheric N 2 Waste material, death & decay decay O2O2 O2O2 Anaerobic (O 2 absent) Aerobic (O 2 present) lightning nitrogen-fixing bacteria Hydrolysis is a chemical decomposition process that uses water to split chemical bonds of substances. hydrolysis

19
The Oxygen Sag- Net Effect of Supply and Demand

20
Saturation Concentration

22
Nutrients

24
1 lb N 16.7 lb algae 1.2 lb O 2 /lb algae 20 lb O 2 /lb N Approximate chemical formula for algal cells: (CH 2 O) 106 (NH 3 ) 16 H 3 PO 4 C= 34.3% H = 7.1% O = 51.8% N = 6.0% P = 0.8% respiration synthesis At 0.0015 lb NH 3 /day/person (0.00124 lb N/day/person), oxygen demand associated with algal growth = 0.025 lb/day/person Generally exerted in lakes or estuaries where reaeration is low.
 106 (NH 3 ) 16 H 3 PO 4 C= 34.3% H = 7.1% O = 51.8% N = 6.0% P = 0.8% respiration synthesis At lb NH 3 /day/person ( lb N/day/person), oxygen demand associated with algal growth = lb/day/person Generally exerted in lakes or estuaries where reaeration is low.")
25
Approximately 160 river miles

26
Nutrient Loads in Neuse River Basin by Source

27
Load = point +export from land = 21.8 million tons/yr = 5.5 lb/ac/yr

28
Load = point + export from land = 2.35 million lbs/yr = 0.59 lb/ac/yr = 0.45 million lbs

29
Chesapeake Bay Watershed Maryland Delaware New York District of Columbia Virginia West Virginia Pennsylvania Susquehanna James Potomac Appox. 160 mi.

30
Threats to the Bay and Rivers N UTRIENTS S EDIMENTS T OXIC CHEMICALS H ABITAT LOSS O VERFISHING

31
Estimated 1985 Base Nutrient Loads

32
Total = 303 million lbs/yr DHM

33
Total = 23.8 million lbs/yr DHM

34
Water Pollutant Loads

35
(Mass Loadings)
")
36
Nonpoint Source Loads of Nitrogen in the United States

37
Input to fields Export to streams Delivery to estuaries Decay

38
INPUTS 1 ton/ac = 3.125 lb/ac. Applied Nitrogen Loads From Commercial Fertilizer Lbs/ac <3.1 3.1-6.3 6.3-12.5 12.5-21.9 >21.9

39
Applied Nitrogen Loads From Animal Manure INPUTS 1 ton/sq.mi. = 3.125 lbs/ac Lbs/ac <3.1 3.1-6.3 6.3-12.5 12.5-21.9 >21.9

40
INPUTS 1 ton/sq.mi. = 3.125 lb/ac Nitrogen Loads From Atmospheric Deposition Lbs/ac <3.1 3.1-4.1 4.1-5.3 5.3-6.3 >6.3

41
March, 2000 water.usgs.gov/nawqa/

42
Nitrogen Export by Region

43
10 8 6 4 2 Lb/ac 1 kg/ha = 0.89 lb/ac 1 lb/ac = 1.12 kg/ha

44
Phosphorous Export by Region

45
0.9 0.7 0.5 0.3 0.1 lb/ac

Similar presentations