Download presentation
Presentation is loading. Please wait.

1
Aquifers in Alluvial Sediment River valley draining glaciated area Rivers draining area in west with high Pleistocene rainfall Fault-bounded basins in west Partially dissected alluvial plain (High Plains) Unconsolidated sands and gravels deposited by rivers. Must be large enough to produce significant rates and volumes of water (b>5 to 10m)
.")
2
Sea vs. Closed Basin as Deposition Site for Alluvial Sediments Sea Suspended load possibly removed Salts possibly removed Sea level change important Closed Basin Fine-grained seds in system Salts remain Isolated from effects of sea level change Affected by local climate

5
Alluvial aquifers in glacial deposits

7
Alluvial sediments in glaciated areas Glaciers advance, scour seds., modify river course. Sed comp. depends on location/source material. Large range of grn size. Till=clay-boulder beneath glacier. Sea-level drops as ice advances. Hydraulic gradient increase. Erosion, velocity, carrying capacity increase. Valleys incised into bedrock, older glacial sediments (cover earlier channel deposits) Glaciers recede. Discharge increases. Erosion. Braided rivers, large sediment capacity. Outwash plain (sands and gravels). Lakes in front of receding glaciers. Lacustrine=clay-silt (varved)
 Glaciers recede. Discharge increases. Erosion. Braided rivers, large sediment capacity. Outwash plain (sands and gravels). Lakes in front of receding glaciers. Lacustrine=clay-silt (varved).")
8
Alluvial sediments in glaciated areas, Cont Sea level rises, glaciers recede, hydraulic gradient diminishes, discharge diminishes, carrying capacity drops. Lakes. Coarse-grn seds deposited in incised valleys. Gravel on bottom, fining upward. Thickness depends on conditions during/following glaciation. Glacial landforms Region adjusts to interglacial. Discharge decreases. Sediments reworked. Important materials: Till, lacustrine, outwash, alluvial valley fill, diamicton, drift.

12
Gravel lens within a silty-clay till

13
AlluvialAquifer Systems Geometry Aquifer type Properties Recharge/Discharge Flow pattern Chemistry Examples

14
Geometry Channel deposits –Elongate, tabular bodies, sinuous Length: many km Width: 0.1-several km Thickness: 0.01-0.1 km Outwash deposits, alluvial plain – planar sheets many km horizontally Thickness: 0.01-0.1 km

15
Aquifer Types Unconfined Confined Both, unconfined with local confining unit Channel fill in modern valley Buried channel Outwash plain Alluvial plain Deposits

16
substratum Idealized setting Channel fill in modern valley Sand and gravel, Primary aquifer Confining unit where fine grained

17
substratum

19
Hydraulic conductivity of some major alluvial aquifers

20
Fining upward sequences in major alluvial aquifers

21
unconfined Storativity of major alluvial aquifers confined

22
Recharge to alluvial aquifers Infiltration through floodplain Discharge from basement Losing stream including tributary

23
Irrigation return flowRise in river stage, Bank storage Rise in river stage, Flood

24
Main channel losing due to pumping

25
Discharges from Alluvial Aquifers 1.To main channel or tributaries 2.Lakes on floodplain 3.Wetlands 4.Wells

27
Streambed conductance effects on gw/sw interaction Fine-grained seds on streambed Fine-grained seds in topstratum

28
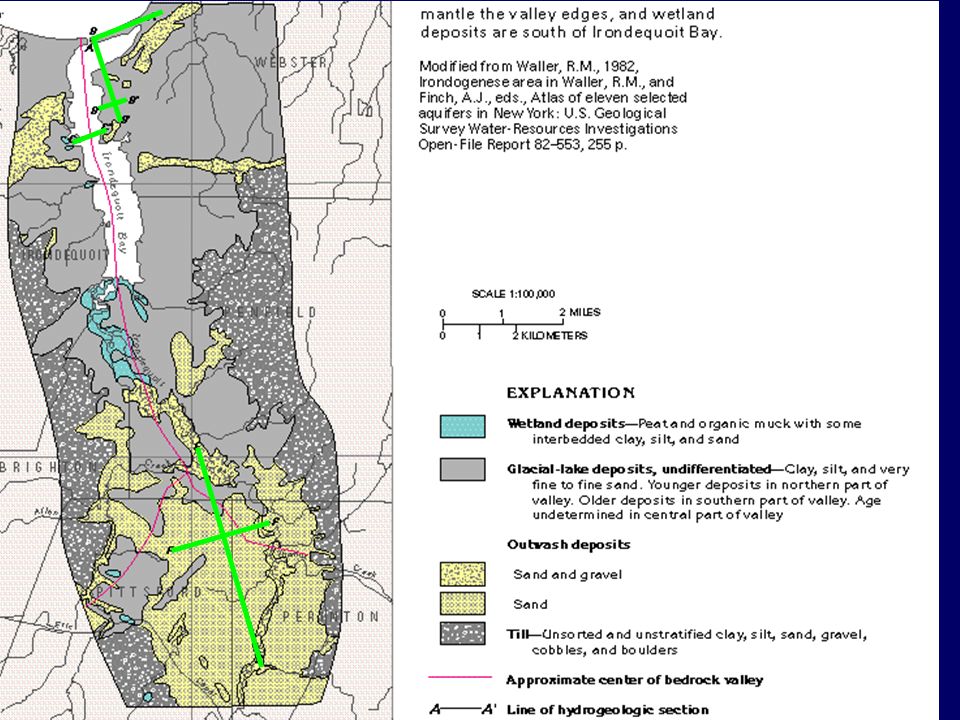
Some examples Fox-Wolf River Basin, WI. Outwash Corning aquifer, NY. River valley Andruscoggin. ME. Alluvial valley once inundated by seawater Irondogenese, NY, Alluvial valley once filled with fresh water lake Others

30
140 miles 20 miles

36
Another major outwash deposit

39
Chemung river valley, Corning, NY

40
5 miles 1 mile

42
1:40 aspect ratio 4000

46
16 Mgpd

47
3000 ft 1.Determine the horizontal head gradient at each location 2.Estimate the ground water fluxes at each location 3.Estimate the average flow velocities 4.Estimate the volumetric rate per unit length of river that the aquifer is contributing to the rivers at each location. 5.Provide an explanation for the differences between the two locations Corning Aquifer Exercise A. B.

49
Glacial valley partially inundated by the sea

51
5000 ft

53
Hydraulic head in glacial outwash, Little Androscoggin Aquifer, Maine

55
7 Mgpd capacity

56
4 miles Aquifer filling a valley once filled by fresh water glacial lake

60
4.3 Mgpd

62
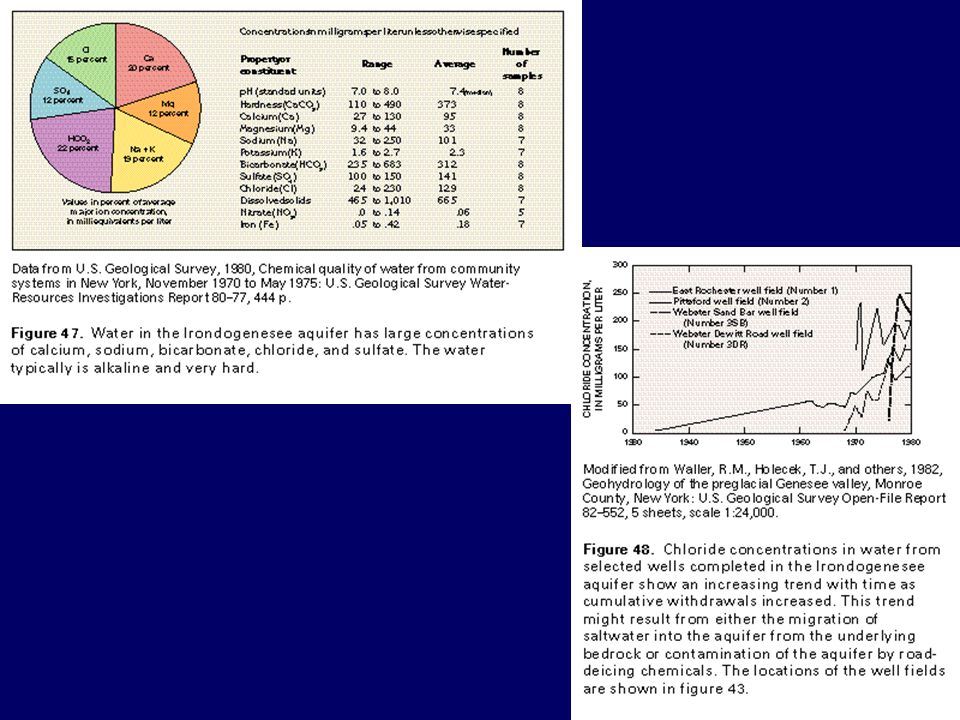
Water Quality Summary TDS Hardness Major ions

63
Corning Aquifer. Ca, Mg, HCO3; Hardness: 225 ppm; TDS: 212 ppm 16 Mgpd Little Androscoggin, Na, K, Ca, HCO3; Hardness: 24-68ppm TDS 67-128 ppm Irondogenesee Aquifer, Ca, Na, HCO3, Cl, SO4; TDS 665, Hardness: 373 4 Mgpd alluvium bedrock

65
Some other alluvial aquifers

67
Dissolution of underlying evaporites forms deep troughs in Pecos River Basin

69
80 Mgpd Water Quality: 1000+ mg/L common due to underlying evaporites and recharge from saline surface water and irrigation return flow where evaporation has increased salt content

70
100 miles Relative sizes of example alluvial aquifers

Similar presentations


 distinct episodes expansion and melting.>")

