Download presentation
Presentation is loading. Please wait.

1
What is New Hampshire? Vesta Roy Excellence in Public Service Series January 18, 2007 Dennis Delay Deputy Director, NHCPPS “…to raise new ideas and improve policy debates through quality information and analysis on issues shaping New Hampshire’s future.”

2
www.nhpolicy.org All of our reports are available on the web: www.nhpolicy.org New Hampshire Center for Public Policy Studies Board of Directors Martin L. Gross, Chair John B. Andrews John D. Crosier Gary Matteson Todd Selig Donna Sytek Georgie A. Thomas James Tibbetts Brian Walsh Kimon S. Zachos Staff Steve Norton Dennis Delay Ryan Tappin Doug Hall “…to raise new ideas and improve policy debates through quality information and analysis on issues shaping New Hampshire’s future.”

3
Topics for Presentation New Hampshire’s People New Hampshire’s Environment New Hampshire’s Economy State Budget Public Education Public and Private Health Care Spending Corrections and Drug Abuse Local and County Governance 1

4
Starting in the 1960’s, New Hampshire Population Grew Faster Than the Rest of New England zSource: Chart from Fed Bank of Boston zPopulation Growth Index – New England and US

5
New Hampshire Growth Highest in I-93 Corridor zSource: NH Office of State Planning Estimates

6
Three NH Counties Had More Deaths Than Births. zSource: US Census Bureau Components of NH County Population Change April 1, 2000 to July 1, 2005 InternationalInternalTotal Net Natural IncreaseMigration Belknap-242335,1055,338 Carroll-2761413,9924,133 Cheshire3902192,9663,185 Coos-576641,0881,152 Grafton4626761,9762,652 Hillsborough11,6136,7192,5849,303 Merrimack1,7768348,2389,072 Rockingham7,3741,3289,37810,706 Strafford2,6717723,4874,259 Sullivan4621212,0472,168 Total23,87211,10740,86151,968

7
Most of NH’s Migrants Come From Massachusetts NEW HAMPSHIRE NET MIGRATION 2000 to 2005 (Source: NH OSP) STATEEntered NH FromLeft NH For:Net Change MA92,07842,69249,386 ME14,83024,868-10,038 VT11,17519,613-8,438 FL11,96311,108855 NY10,2417,3792,862 CA7,4708,435-965 CT6,8875,1481,739 Foreign4,1825,082-900 PA4,3684,707-339 NJ4,2995,414-1,115 VA4,0564,410-354 TX3,9193,490429 NC3,3283,669-341 RI2,9942,573421 CO2,4872,507-20 SC1,4312,535-1,104 GA2,1602,957-797 TOT** 216,527186,31030,217
 STATEEntered NH FromLeft NH For:Net Change MA92,07842,69249,386 ME14,83024,868-10,038 VT11,17519,613-8,438 FL11,96311, NY10,2417,3792,862 CA7,4708, CT6,8875,1481,739 Foreign4,1825, PA4,3684, NJ4,2995,414-1,115 VA4,0564, TX3,9193, NC3,3283, RI2,9942, CO2,4872, SC1,4312,535-1,104 GA2,1602, TOT** 216,527186,31030,217")
8
The New Hampshire population age makeup is shifting, along with the region and the rest of the US. Source: US Census Bureau

9
New Hampshire is estimated to have a relatively high median age of the population, exceeding the US median age by 3.1 years Only Maine and Vermont, among the New England States, have higher population median ages All New England states have higher population median ages than the United States

10
The New Hampshire workforce is getting older, but population growth will continue with high “quality of life” and job opportunities Source: US Census Bureau and New Hampshire Office of Energy and Planning

11
New England donors give more to secular causes but less to religious causes 0 100 200 300 400 500 600 700 800 900 1000 020040060080010001200 Religious giving: average/household (inc. non-donors) Secular Giving: Average/household (inc. non-donors) New England Mid-Atlantic Great Lakes SE:Gulf States Oil States Plains states SE:Atlantic Mountain:SW Pacific (Center on Philanthropy Panel Study Data) Religious and secular giving, by U.S. Census Region, 2002
 Secular Giving: Average/household (inc. non-donors) New England Mid-Atlantic Great Lakes SE:Gulf States Oil States Plains states SE:Atlantic Mountain:SW Pacific (Center on Philanthropy Panel Study Data) Religious and secular giving, by U.S. Census Region,")
12
Topics for Presentation New Hampshire’s People New Hampshire’s Environment New Hampshire’s Economy State Budget Public Education Public and Private Health Care Spending Corrections and Drug Abuse Local and County Governance 1

13
Global Warming? : Average ‘ice out’ day trend for 27 lakes in the Northeast, 1926-2000

14
Winter Recreation, Global Warming and New Hampshire Warm slushy winters mean 6,000 fewer jobs, a loss of 4 percent of North Country winter employment. 33 percent fewer skiers visit NH. Snowmobile registration license fees drop by almost 30 percent. Total loss in ski ticket, fishing license and snowmobile registrations is $13 million. Source: www.carboncoalition.org

15
Topics for Presentation New Hampshire’s People New Hampshire’s Environment New Hampshire’s Economy State Budget Public Education Public and Private Health Care Spending Corrections and Drug Abuse Local and County Governance 1

16
NH Income per person grew faster than US in 1970-80’s. Source: US Bureau of Economic Analysis

17
..but wealth is not evenly distributed among counties. Source: US Bureau of Economic Analysis

18
New Hampshire Growing Faster than US or Region Since 2001 Source: Bureau of Economic Analysis

19
Real Estate Eclipses Manufacturing in Contribution to GDP Source: Bureau of Economic Analysis

20
New Hampshire affordability better than the 1980’s. Sources: Census Bureau and Bureau of Economic Analysis

21
Northern New England Scores Well

22
Topics for Presentation New Hampshire’s People New Hampshire’s Environment New Hampshire’s Economy State Budget Public Education Public and Private Health Care Spending Corrections and Drug Abuse Local and County Governance 1

23
4

24
Comparison of Aggregate Growth (1997-2007) 7
 7")
25
Change in Inflation Adjusted Per Capita Appropriation 1997-2007 10

26
Feast and Famine: 1997-2007 Change in General Fund Appropriations (in $2007 per capita) 11
 11")
27
Summary: NH General Fund Spending 1997-2007 Budget up 55.4% in 10 years Slightly more than inflation and population growth … and less than economy. Programmatically: In real terms: “Feast AND Famine” 5 entitlement functions driving expenditure growth Aside from 5 growth areas, net reduction in real spending for remainder of budget. 26

28
General Fund Revenue by Source FY 2005 29

29
General Fund Revenue ($ million) New Versus Old Revenues Compound annual rate of increase: 3.4% 33
 New Versus Old Revenues Compound annual rate of increase: 3.4% 33")
30
$881 34

31
35

32
36

33
Does New Hampshire Have a Structural Deficit? “New Hampshire can be characterized as having a long-term structural deficit in the sense that for a given scope of programs and revenue system, expenditures grow automatically faster than revenues.” KPMG Peat Marwick February 13, 1992 44

34
So What? Recognize need to scale back on state activities OR recognize the necessity to raise tax rates or add new taxes to maintain a constant level of services. Results in more detailed review of all state programs every biennium because there is always a looming shortfall. Reduces possibility of surpluses for investment in desirable one-time projects. Makes long-term strategic planning more difficult. 45

35
Budget Conclusions? Absent significant policy changes, historic growth in primary drivers of state budget will continue. Over the past 15 years, ‘natural’ revenue growth has been outpaced by appropriations constant changes to tax structure including increased rates and new taxes. Absent significant policy changes which slow growth in primary drivers, appropriations likely to outstrip revenue growth revenue structure changes or ‘tinkering.’ Both revenue and expenditure side driven by economic changes …. 46

36
Topics for Presentation New Hampshire’s People New Hampshire’s Environment New Hampshire’s Economy State Budget Public Education Public and Private Health Care Spending Corrections and Drug Abuse Local and County Governance 1

38
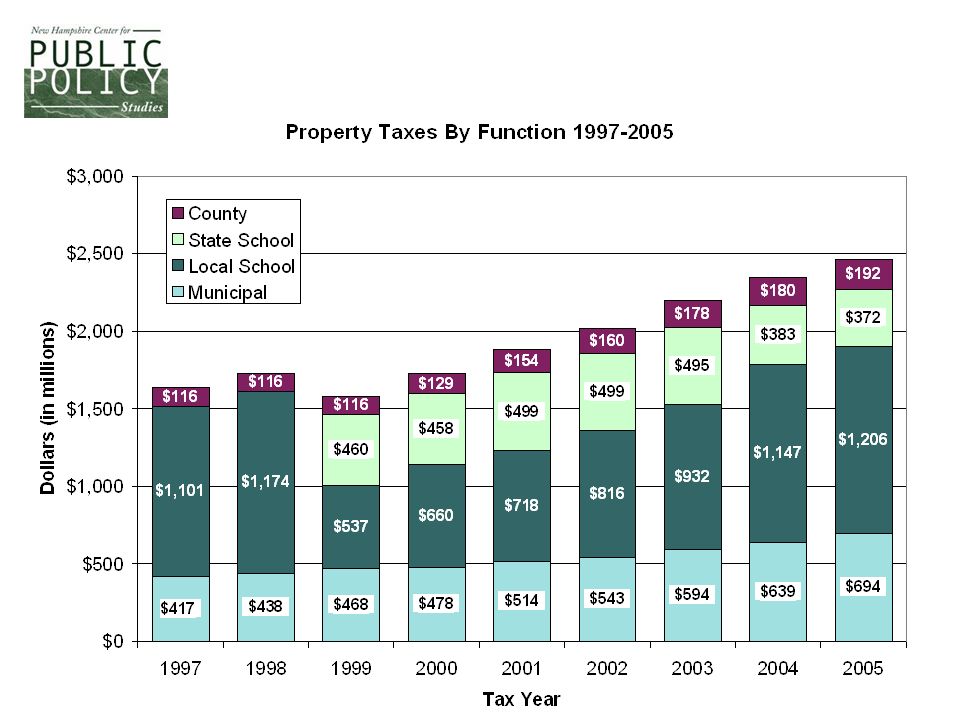
The “Adequacy” Reform Began in 1998 Legislature passed HB999 - new state “adequacy” aid in response to NH Supreme Court ruling in Claremont II Old “Foundation Aid” of $66 million was repealed Raised/introduced taxes for education Re-introduced statewide property tax for schools in tax year 1999 at $6.60 rate Distributed $407 million for school year 1999/2000 Legislature has regularly amended and changed the amount of aid and the distribution formula. Reform sought to comply with ‘Claremont II’ thru: greater pupil equity greater taxpayer equity

39
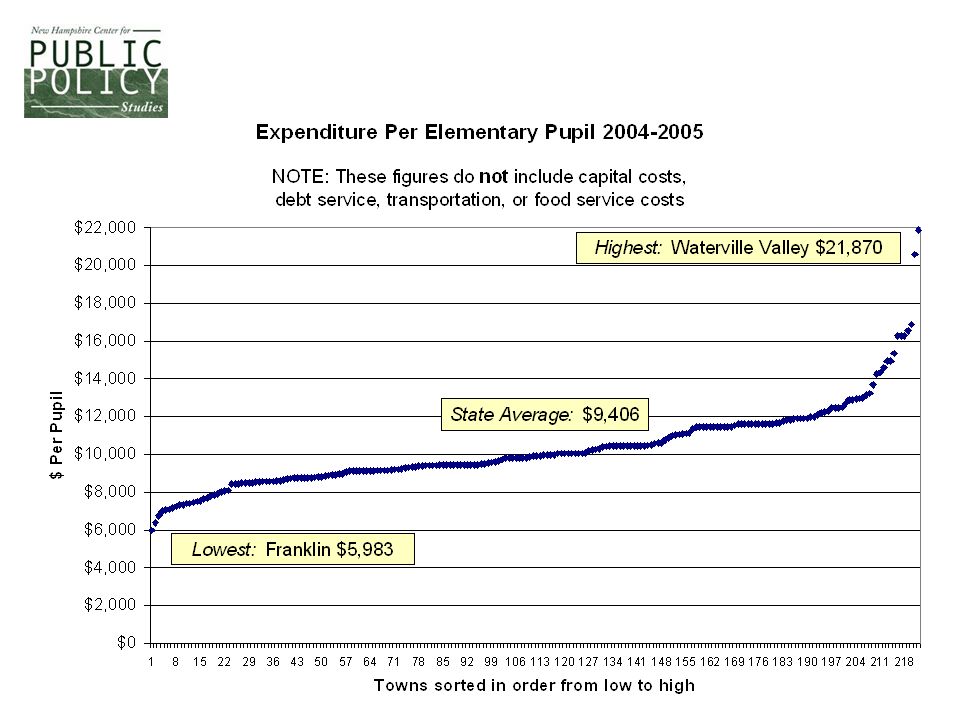
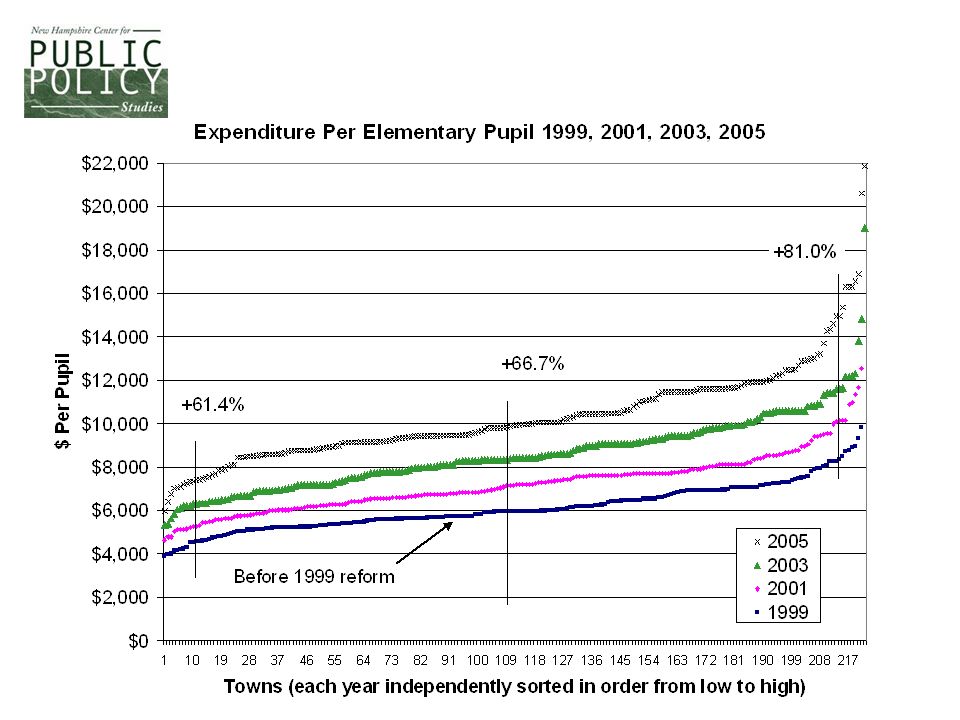
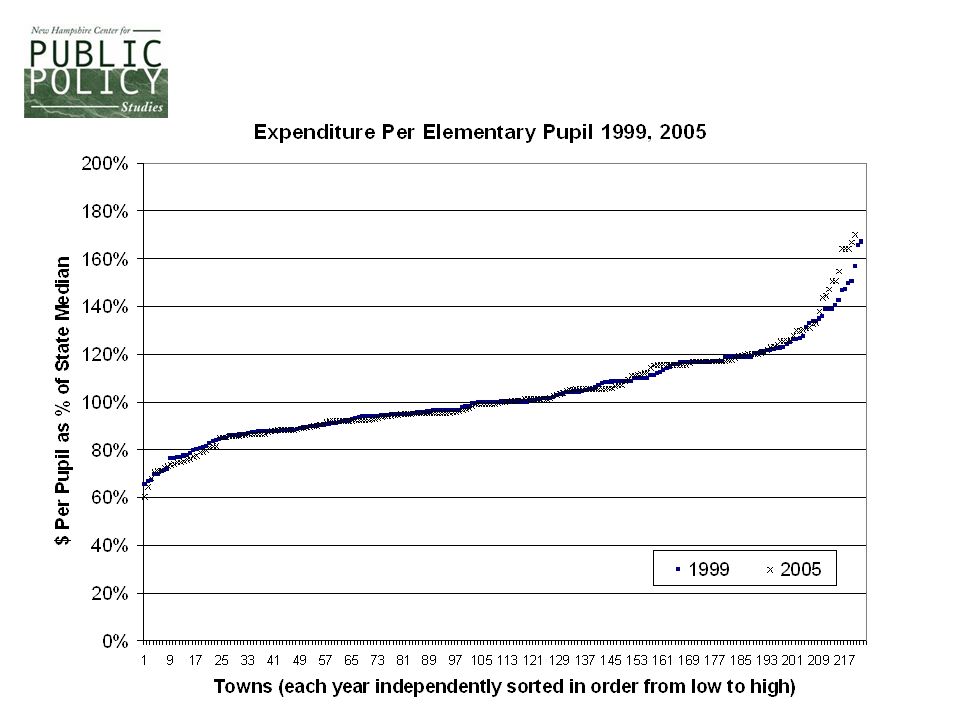
Change in Pupil Equity How have the differences in spending per pupil among the school districts that were cited by the Supreme Court changed since the reform?

44
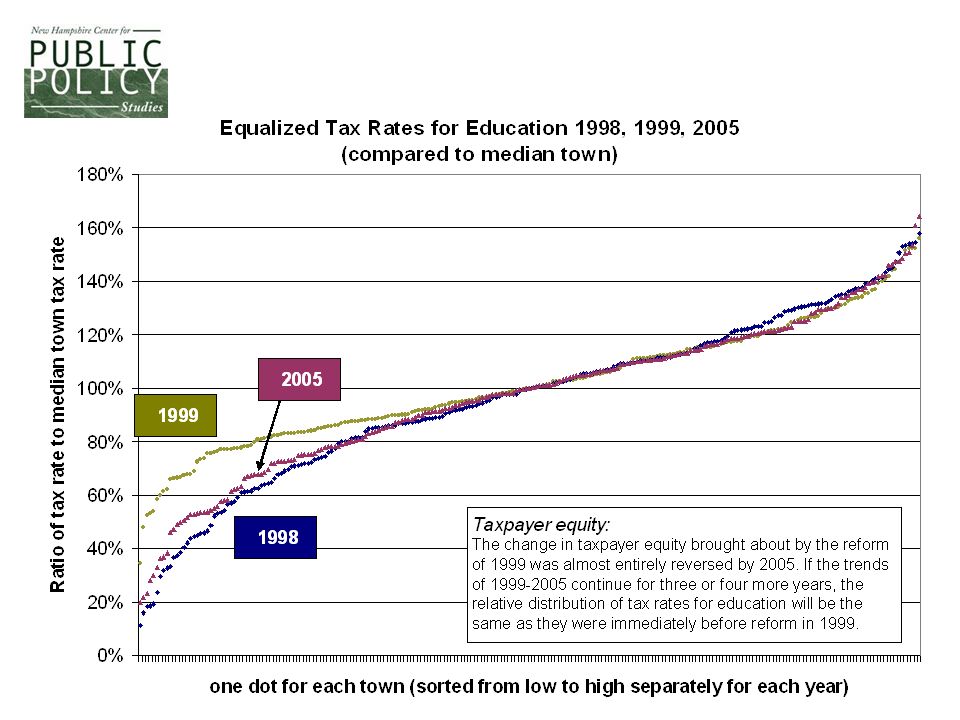
Change in Taxpayer Equity How have the differences in tax rates among the towns that were cited by the Supreme Court changed since the reform?

49
Change in Taxpayer Equity The initial increase in taxpayer equity in 1999 has nearly all eroded away. Change in Pupil Equity No change in pupil equity ever occurred.

50
New Hampshire's high school dropout rates have begun to decline Source: New England Public Policy Center

51
Topics for Presentation New Hampshire’s People New Hampshire’s Environment New Hampshire’s Economy State Budget Public Education Public and Private Health Care Spending Corrections and Drug Abuse Local and County Governance 1

55
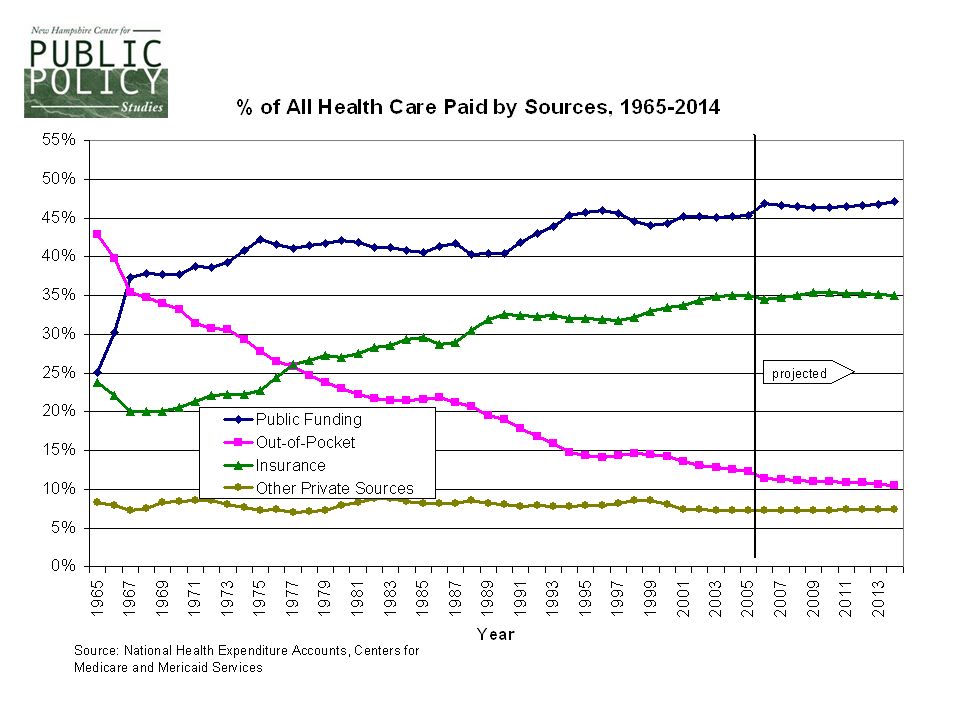
“Regions experiencing the largest spending gains were not those realizing the greatest improvements in survival. Factors yielding the greatest benefits to health were not the factors that drove up costs.” Health Affairs 25 (2006) Hospitals and physicians are competing for profitable services, making costly investments in the latest medical technologies. These market forces are largely going unchallenged by insurers and regulators (Center for Health Systems Change, Issue Brief No. 97) Elliot Fisher’s Work suggest some services are ‘unnecessary.’ Are we getting value?
 Hospitals and physicians are competing for profitable services, making costly investments in the latest medical technologies. These market forces are largely going unchallenged by insurers and regulators (Center for Health Systems Change, Issue Brief No. 97) Elliot Fisher’s Work suggest some services are ‘unnecessary.’ Are we getting value .")
58
We spend more on health care at the end of our lives. zSource: www.ahrq.gov Medical Expenditure Panel Surveywww.ahrq.gov

59
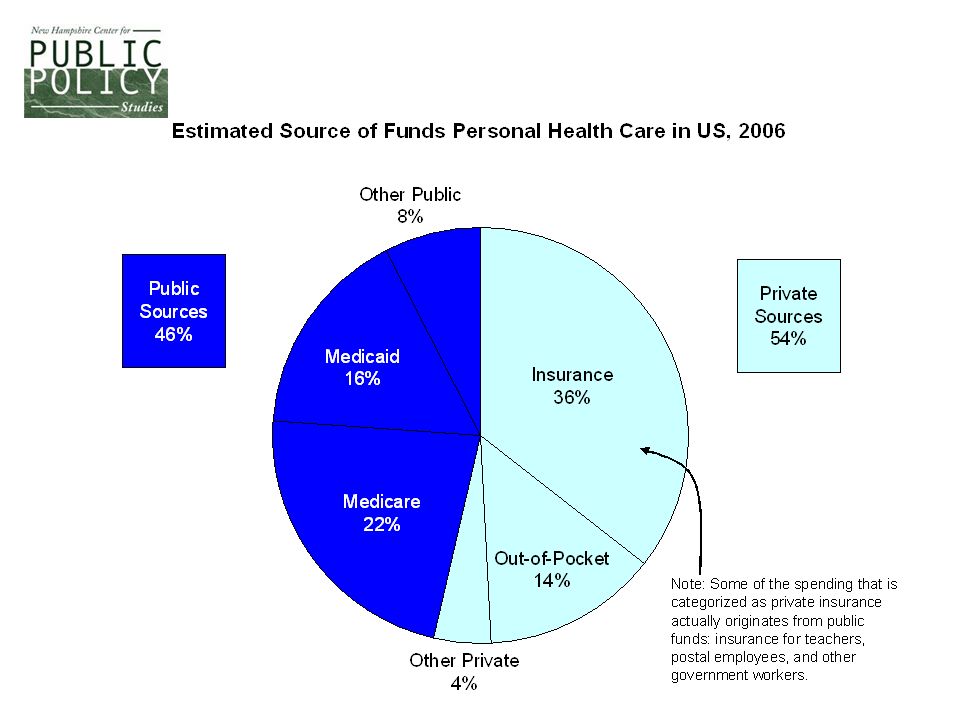
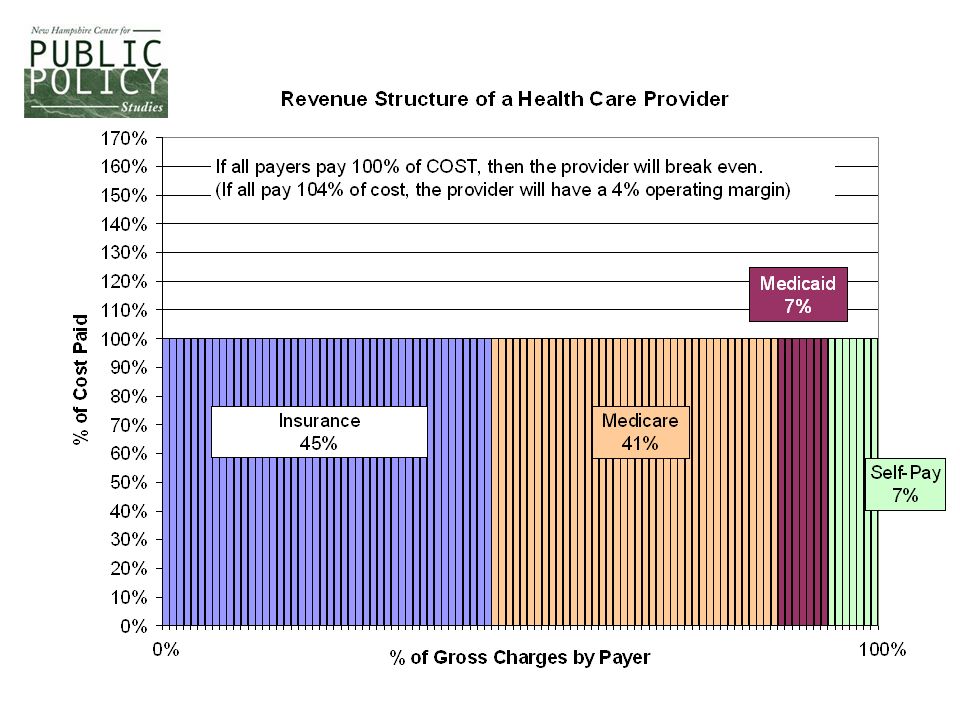
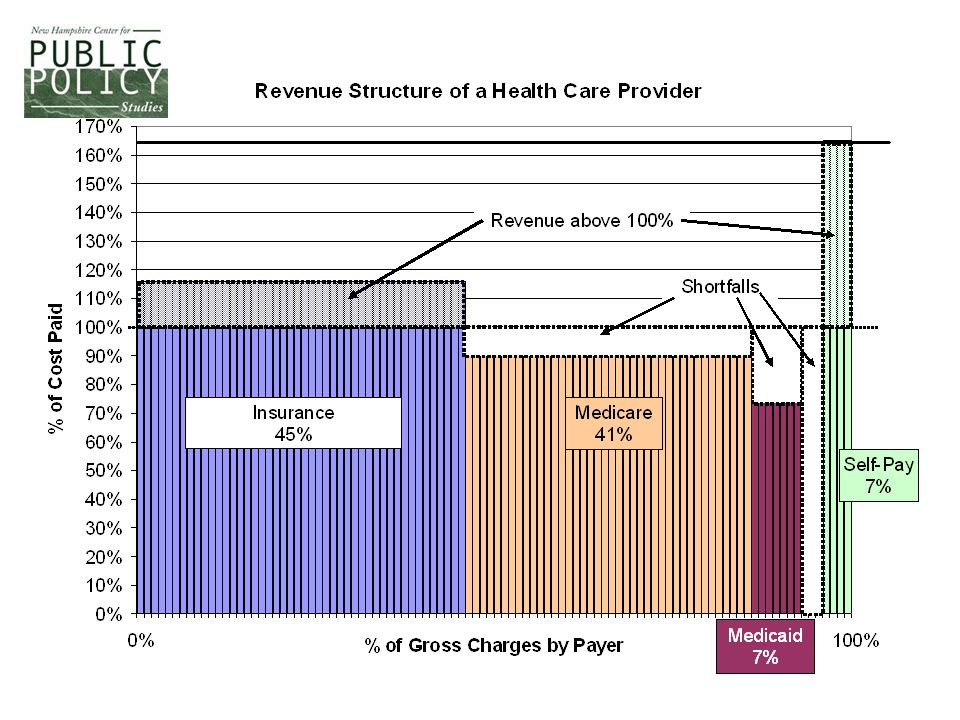
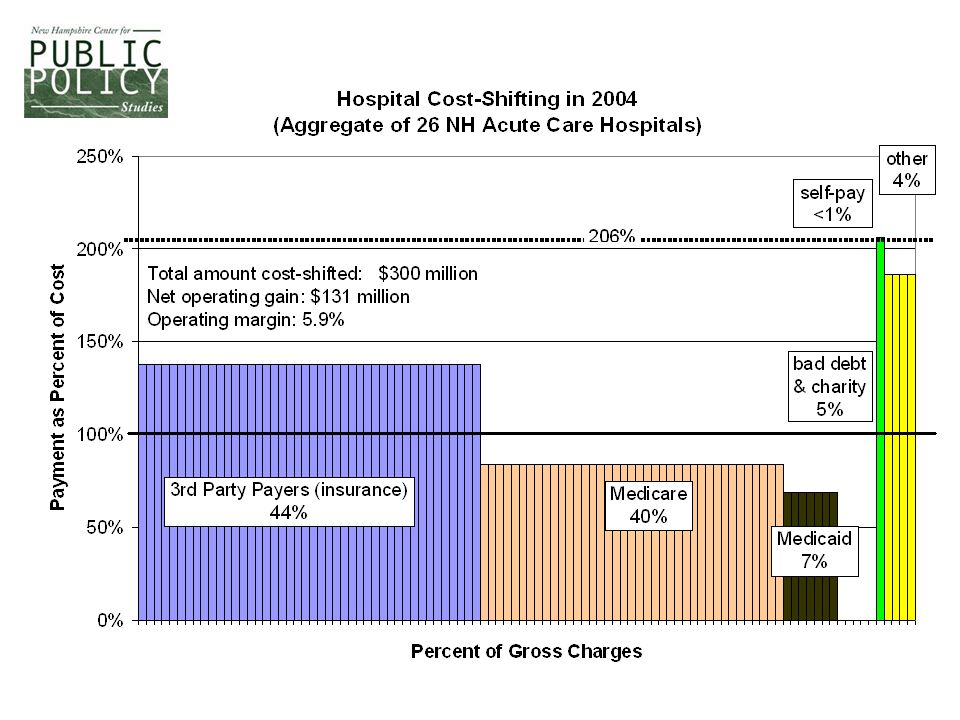
Cost-Shifting The allocation of unpaid costs of care delivered to one patient population through above-cost revenue collected from other patient populations. For hospitals, nursing facilities and physicians, the historical cause of cost shifting has been below-cost reimbursement rates paid by PUBLIC programs and uncompensated care losses due to charity care and bad debt. Why are These Trends Important?

61
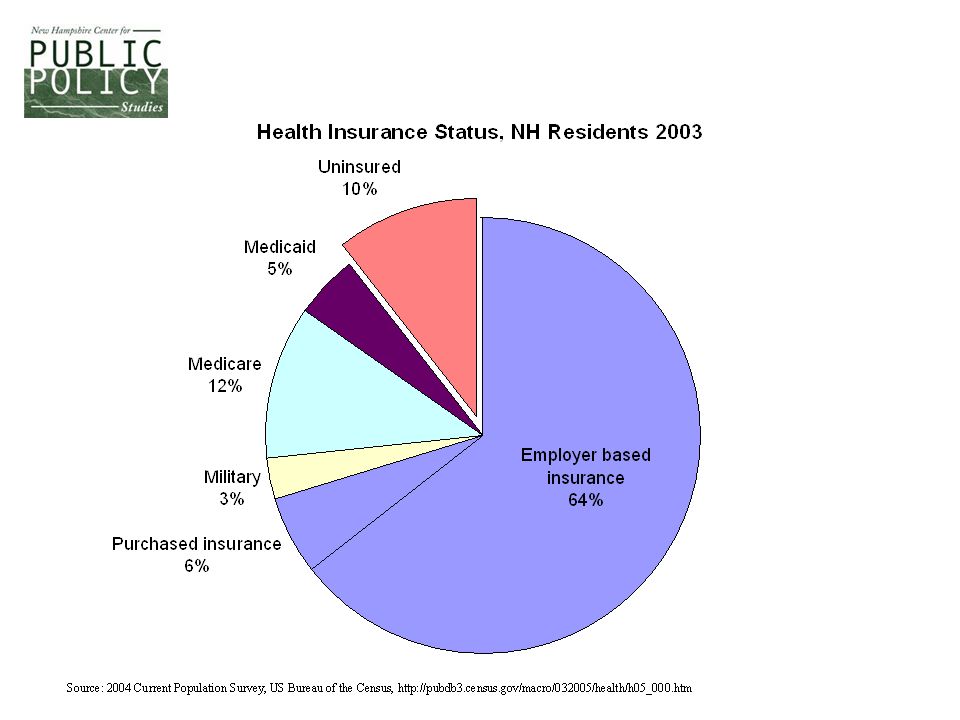
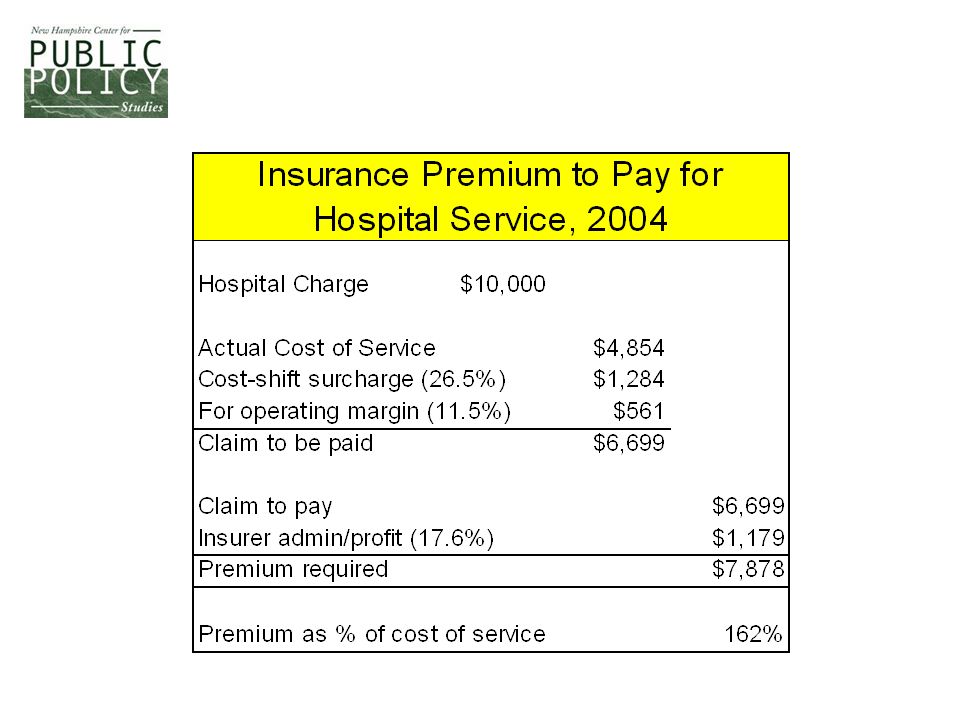
Differences Among Employers Provide many employees a health insurance benefit Large employers Manufacturers High wage and full time employers Provide few employees a health insurance benefit Small employers Construction, retail sales, hospitality Low wage and part time employers The former are effectively subsidizing the latter through family policies and cost-shifting by health care providers. Can you name the employers in your community that are shifting the health care costs of their employees onto you?

67
Cost-Shifting Cost-shifting also occurs in nursing homes, physician offices, clinics, and other providers. The degree of cost-shifting in nursing homes is greater than in hospitals, but not yet quantified. The degree of cost-shifting in private practices is unknown because there are no complete financial reports. Anecdotal evidence would indicate that for some practices it is greater than in hospitals, while for other practices it is minimized by declining to serve some patients.

68
If all jobs, healthcare and population grew at the same rate the lines would overlap perfectly.

69
Healthcare and the Economy Healthcare is clearly an important contributor to the economic system in New Hampshire. This does not ‘eliminate’ the need to bring focused attention to growth in health care Opportunity Cost (are these really the jobs we want?) Question of value still remains primary
 Question of value still remains primary.")
70
Topics for Presentation New Hampshire’s People New Hampshire’s Environment New Hampshire’s Economy State Budget Public Education Public and Private Health Care Spending Corrections and Drug Abuse Local and County Governance 1

71
24

72
25

73
Teen Drug Abuse in NH Higher than National Average

74
Topics for Presentation New Hampshire’s People New Hampshire’s Environment New Hampshire’s Economy State Budget Public Education Public and Private Health Care Spending Corrections and Drug Abuse Local and County Governance 1

75
One-third of NH residents live in a town with a traditional town meeting. Percentage of NH Population by Form of Governance: 2002 No MeetingTraditional Meeting Official Ballot Municipalities Count of Municipalities1517148 Percent of State Population36%33%31% School Districts Count of Districts1010264 Percent of State Population26%22%52%

76
Nursing homes and human services account for biggest differences in per capita NH county spending.

77
The number of households filing first- time requests for elderly exemptions has grown…

78
..but the Elderly Exemption shifts a very small part of total tax burden. Year Elderly Exemptions Average Tax Reduction Total Exemption Value Percent of Total Tax Commitment 2000$1,043$11,790,1120.68% 2001$1,175$13,228,6590.70% 2002$1,259$14,119,3920.70% 2003$1,379$16,085,3680.74% 2004$1,523$18,135,3780.78% 2005$1,596$18,964,5360.80%

79
Questions?

80
www.nhpolicy.org All of our reports are available on the web: www.nhpolicy.org New Hampshire Center for Public Policy Studies Board of Directors Martin L. Gross, Chair John B. Andrews John D. Crosier Gary Matteson Todd Selig Donna Sytek Georgie A. Thomas James Tibbetts Brian Walsh Kimon S. Zachos Staff Steve Norton Dennis Delay Ryan Tappin Doug Hall “…to raise new ideas and improve policy debates through quality information and analysis on issues shaping New Hampshire’s future.”

Similar presentations


 Room 100, State.>")


