Download presentation
Presentation is loading. Please wait.

1
Using Google Earth in the Classroom Thomas Chandler, PhD http://www.ncdp.mailman.columbia.edu

2
Middle School students reading various geography text books during class in 1927, at the University of Chicago Laboratory School. Emphasis on memorization. Difficult to layer data.

3
1980s: Databases, Not Easy to Interpret

4
1990s: GUI, Visualization

5
These four layers might be part of one city's geographic dataset. The layers all contain features located within the city's boundaries, but each one represents a distinct "theme." Earth Sandwich

6
Raster Vector

10
Map based problem solving has been done without digital tools for centuries. John Snow: Cholera outbreak in London, 1854 © Edward Tufte

11
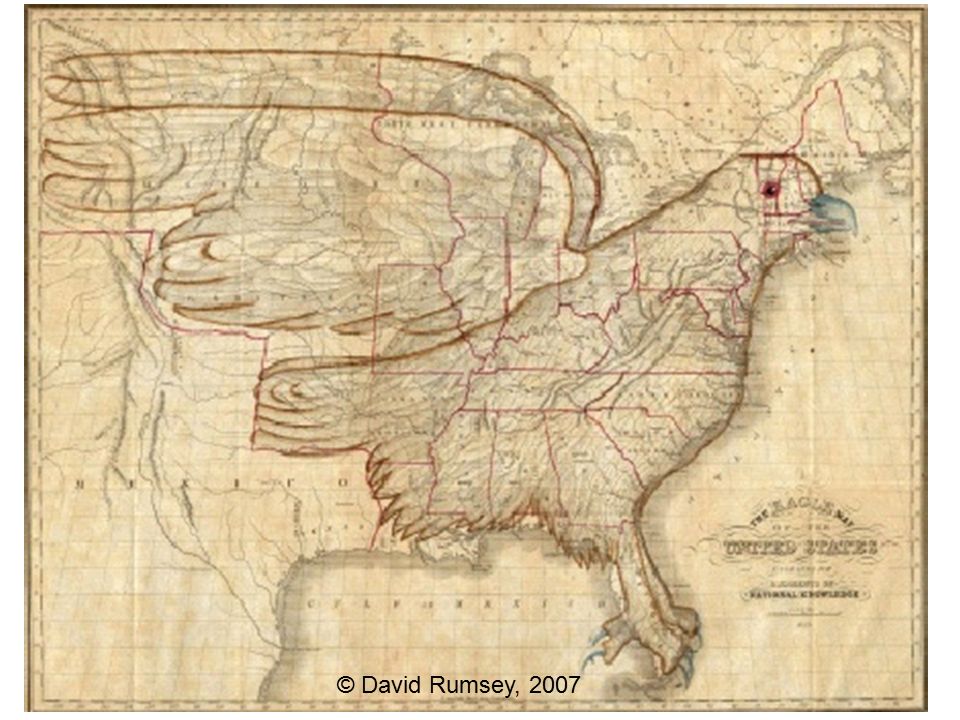
© David Rumsey, 2007

13
Public Policy: Digital mapping is used to enable policy makers to more easily detect patterns pertaining to: - census demographics - public health concerns - crime - tax rates - transportation routes - pollution levels - real estate development - weather patterns - gas / electric power consumption - the impact of various types of natural and human made disasters

14
New York City Demographics © NYC Dept of Urban Planning, 2007

15
2000 West Nile Virus Cases

16
2001 West Nile Virus Cases

17
2002 West Nile Virus Cases

18
2003 West Nile Virus Cases

19
© Ethnologue

20
Bangladesh

21
Presidential Elections © ESRI, 2004

23
Using GIS for Flu Vaccination Clinics http://www.albany.edu/faculty/msz03/gis2008/gis2008_brems.pdf - Determine who needs to be treated - Records based on home address on registration form - Notify areas with low vaccination rate / large population

24
ArcPad is designed for field teams who require GIS capabilities. It provides staff with the ability to capture, edit, display, share and analyze geographic information. ArcPad: Rapid Needs Assessment http://archive.naccho.org/modelPractices/Result.asp?PracticeID=169

25
University of Mississippi Medical Center (UMMC), have developed a syndromic surveillance system with GIS disease mapping capabilities. http://www.esri.com/ news/arcuser/0206 /geostat1of2.html

26
Geocoding Twitter Feeds Cased on Specific Search Terms: “Just Landed” http://blog.blprnt.com/blog/blprnt/just-landed-processing-twitter-metacarta-hidden-data

28
This map and the data behind it were compiled by Dr. Henry Niman, a biomedical researcher in Pittsburgh, Pennsylvania, using technology provided by Rhiza Labs and Google. The map is compiled using data from official sources, news reports and user- contributions and updated multiple times per day. http://flutracker.rhizalabs.com/

29
http://www.batchgeocode.com

30
GeoBrowser Social Networking 3D drawings Server based Keyhole Markup Language (KML)
")
31
Key concept: Real-time mapping, viewing storm tracks and social vulnerabilities

32
Key concepts: Visualizing census data to examine social vulnerabilities. This image displays a 3D visualization of the African American population in Louisiana.

33
Key concept: Analyzing the oil industry’s impact on Louisiana.

34
Key concept: Adding images regarding Hurricane Katrina

35
Key concept: Studying satellite imagery. “Before and after” images

36
Key concept: Adding video from YouTube

37
Spatial Intelligence not used extensively in schools

38
How is digital mapping being used in classrooms? Learning about digital maps: - focus on learning the software - teacher is “sage on the stage” - focus on procedural tasks vs. Learning with digital maps: - focus on learning subject matter - project based learning - problem solving - community based interaction - authentic assessment

39
Example: Ligon Magnet Middle School in Raleigh, North Carolina: Students incorporated digital maps into an oral history project –Formerly a segregated community. Students interviewed alumni who graduated in the 1930s and 1940s –Reclaimed historic places on contemporary maps –Used Sanborn fire insurance maps found at municipal urban planning office –Dr. Marsha Alibrandi http://www.ncsu.edu/ligon/about/history/esri/P7311.htm

40
The Sanborn maps vividly illustrated the history of segregation in the community.

42
Thank You….

Similar presentations


 & ArcView GIS software? What is a Geographical Information System (GIS)? Introduction to ESRI ArcView 3.x.>")


 John Wiley and Sons Ltd 1. Systems, Science and.>")


 Fundamentals for Program Managers.>")


