Download presentation
Presentation is loading. Please wait.

1
Demographic Diversity and its Implications for the Future John Cleland London School of Hygiene & Tropical Medicine

2
Life Expectancy Trends 1950-2005 Europe Latin America Asia World Africa Northern America

3
Fertility Trends 1950-2000 Africa Asia Latin America World Europe Northern America

5
Major Causes of Projected Population Growth: Developing Countries, 1995-2100 Source: Bongaarts J. Science 263:771-776. 1994

6
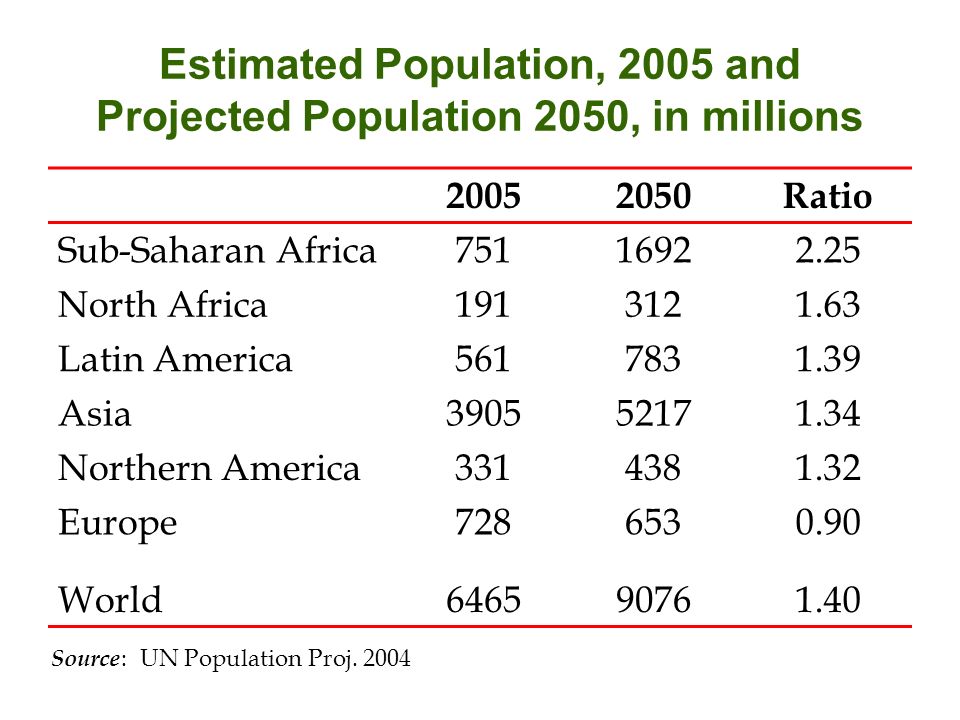
Estimated Population, 2005 and Projected Population 2050, in millions 20052050Ratio Sub-Saharan Africa75116922.25 North Africa1913121.63 Latin America5617831.39 Asia390552171.34 Northern America3314381.32 Europe7286530.90 World646590761.40 Source : UN Population Proj. 2004
10
Population Ageing in Europe

11
POTENTIAL SUPPORT RATIO (NUMBER AGED 15-64 /AGED 65+) Source : UN. World Population Ageing, 2002
 Source : UN. World Population Ageing, 2002")
14
IMMIGRATION SCENARIOS (EUROPE) (ALL FIGURES IN MILLIONS) Population Size (2000)730 Projected Pop. Size assuming no net migration600 Net Annual Migration (1990-98)0.95 Net Annual Migration to Keep Constant Pop.1.82 Net Annual Migration to Keep Constant Age Group 15-64 2.93 Net Annual Migration to Keep Ratio 15-65/65+ Above 3.0 4.27 Net Annual Migration to Keep Constant Ratio 15- 64/65+ 25.20 ( Source : UN Replacement Migration 2001)
0.95 Net Annual Migration to Keep Constant Pop.1.82 Net Annual Migration to Keep Constant Age Group Net Annual Migration to Keep Ratio 15-65/65+ Above Net Annual Migration to Keep Constant Ratio / ( Source : UN Replacement Migration 2001).")
17
African Fertility Trends (Past & Projected)
")
18
Percentage of currently married women using a modern method of contraception: West Africa PERIOD Country1975- 79 1980- 84 1985- 89 1990 -94 1995- 99 2000+Policy to Reduce Fertility Benin137- Burkina Faso45 9 Chad12- Côte d'Ivoire147 Gabon12- Ghana641013 19 Guinea546 Liberia6 Mali156 Mauritania05- Niger255 Nigeria149 8 Senegal125810 Togo 3 79-

19
Mean desired family sizes among all women (African surveys) PERIOD Country1975-791980-841985-891990-941995-992000+ Benin7.45.54.9 Burkina Faso5.7 5.6 Chad 8.9 Côte d'Ivoire8.45.55.4 Gabon 4.9 Ghana65.34.44.3 4.4 Guinea5.7 5.6 Liberia6 Mali6.96.66.2 Mauritania6.2 Niger8.2 Nigeria8.35.86.1 6.7 Senegal8.36.85.95.3 5.4 Togo 5.3 4.5
 PERIOD Country Benin Burkina Faso Chad 8.9 Côte d Ivoire Gabon 4.9 Ghana Guinea Liberia6 Mali Mauritania6.2 Niger8.2 Nigeria Senegal Togo")
21
Niger Population (2005)14 million Total Fertility Rate8 births per woman Desired number of children8 % using modern contraception4% Life expectancy45.4 years Infant mortality145 Adult literacy16% % child stunted38% HIV prevalence1.2% Projected population in 2050 if (a) Fertility remains constant80 million (b) Fertility declines to 3.6 by 205050 million
14 million Total Fertility Rate8 births per woman Desired number of children8 % using modern contraception4% Life expectancy45.4 years Infant mortality145 Adult literacy16% % child stunted38% HIV prevalence1.2% Projected population in 2050 if (a) Fertility remains constant80 million (b) Fertility declines to 3.6 by million")
22
Probable Consequences Inability to feed population → continued dependence on food aid and/or famine Destruction of local ecosystems due to overgrazing etc Continuation of mass poverty, underemployment Continuation of dependence on international aid

23
Possible means of Mitigation Uranium mining Mass migration to neighbouring coastal states Remittances from migrants to Europe Attraction of global capital/skills for manufacturing with low cost labour Achieve sharper than expected fertility reductions

24
Kenya: Changes in Reproductive Indicators 1977-78198419891993 Mean desired family size7.76.24.73.9 % wanting no more children16%N/A49%52% % contracepting7%17%27%33% Fertility rate87.76.75.4

25
Trends in total fertility rate and contraceptive use in married Kenyan women

26
KENYA: CAUSES & CONSEQUENCES OF FERTILITY STALL CAUSE(?) Between 1995-2005 USAID’s Annual allocation for family planning fell from $12 million to $9 million while HIV/AIDS allocation rose from $2 to $74 million CONSEQUENCES: % unwanted births rose from 11% (1998) to 21% (2003) and % contraceptive users relying on public sector supplies fell from 68% to 53% KENYA’S PROJECTED POPULATION IN 2050 RAISED FROM 44 TO 83 MILLION
 Between USAID’s Annual allocation for family planning fell from $12 million to $9 million while HIV/AIDS allocation rose from $2 to $74 million CONSEQUENCES: % unwanted births rose from 11% (1998) to 21% (2003) and % contraceptive users relying on public sector supplies fell from 68% to 53% KENYA’S PROJECTED POPULATION IN 2050 RAISED FROM 44 TO 83 MILLION")
27
DISTRIBUTION OF 76 LOW AND LOWER-MIDDLE INCOME COUNTRIES BY RATE OF POPULATION GROWTH AND UNMET NEED FOR FP Unmet Need Low (<10%) Medium (10-19%) High (20%+) Population Growth High (2%+pa)0626 Medium (1.0-1.9%)61311 Low (<1.0%)653
 Medium (10-19%) High (20%+) Population Growth High (2%+pa)0626 Medium ( %)61311 Low (<1.0%)653")
28
Conclusions High fertility and rapid population growth remains a severe barrier to progress in many – but not all – poor countries Most poor countries already have appropriate population & FP policies BUT they have received far too little encouragement and funding from donor agencies to implement them with commitment. Donors must take much of the blame – Excessive political correctness? Fads and fashions? Renewed emphasis on population stabilisation and FP and respect for reproductive rights are compatible International FP needs a champion

29
What needs to be done? Re-forge link between investment in FP and poverty-reduction that was broken in 1994 at Cairo. Stop cloaking FP in that obfuscating phrase “sexual and reproductive health” Recognise that priorities in poor countries are increasingly divergent – population/fertility is a bigger problem than AIDS in most of Africa but not in Southern Africa.

Similar presentations