Download presentation
Presentation is loading. Please wait.

1
Population

3
Part 1: Where is everyone?

4
What is population distribution?

5
“Population distributions are descriptions of locations on the Earth’s surface where individuals or groups live.”

6
Two-thirds of the World’s Population is concentrated in four specific areas.

7
East Asia

8
South Asia

9
Southeast Asia

10
Europe

11
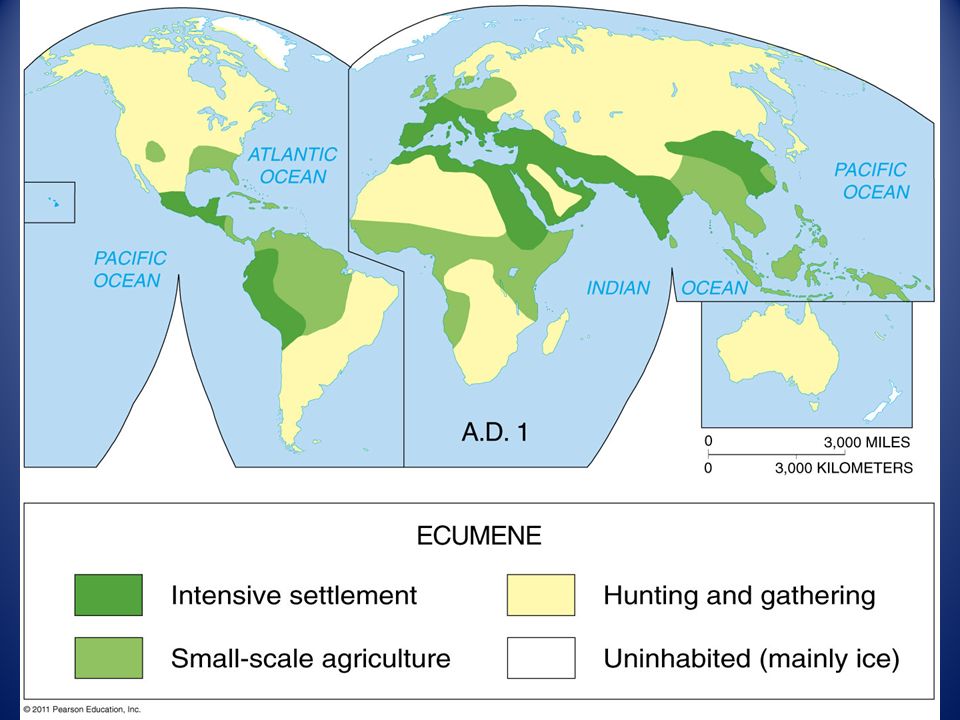
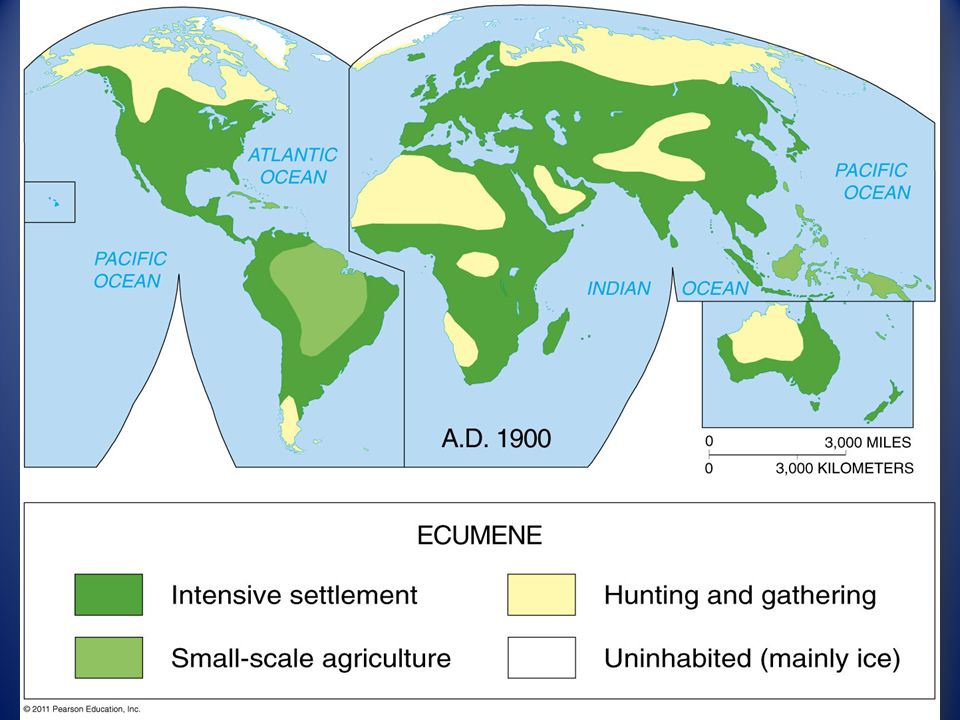
What is ecumene?

12
“Ecumene is the portion of the Earth’s surface occupied by permanent human settlement.”

18
How do you measure population?

19
“Population Density is the number of people occupying an area of land.”

20
The total number of objects in an area. Population divided by Land Area Arithmetic Density The number of people supported by a unit area of arable land. Provided insights into the relationship between the size of a population and the availability of resources in a region. Physiological Density The ratio of the number of farmers to the amount of arable land. Agricultural Density

21
What inferences can you make by looking at countries with a high percentage of arable land but a low agricultural density? What inferences can you make about a country with a high physiological density but a low arithmetic density?

22
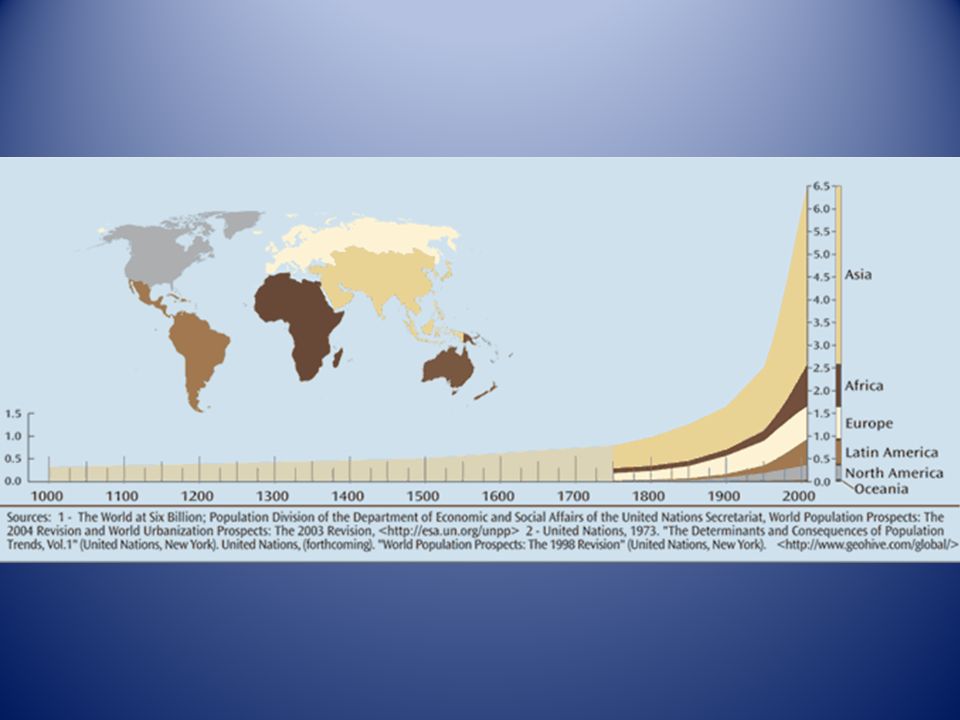
Part 2: Where has the World’s population increased?

23
How do you measure population change?

24
“You can measure population change through the Crude Birth Rate, the Crude Death Rate, and the Natural Increase Rate.”

25
The Crude Birth Rate (CBR) is the total number of live births a year for every 1,000 people alive in the society.
 is the total number of live births a year for every 1,000 people alive in the society.")
26
The Crude Death Rate (CDR) is the total number of deaths a year for every 1,000 people alive in the society.
 is the total number of deaths a year for every 1,000 people alive in the society.")
27
The Natural Increase Rate (NIR) is the percentage by which a population grows in a year.
 is the percentage by which a population grows in a year.")
28
NIR = (Crude birth rate − Crude death rate) / 10
 / 10")
29
2.992% = (37.89 − 7.97) / 10
 / 10")
32
The Total Fertility Rate(TFR) is the average number of children a woman will have during her childbearing years.
 is the average number of children a woman will have during her childbearing years.")
33
The Infant Mortality Rate (IMR) is the annual number of deaths of infants under 1 year compared with total live births.
 is the annual number of deaths of infants under 1 year compared with total live births.")
34
Life Expectancy measures the average number of years a newborn can expect to live at current morbidity levels.

35
Part 3: Why is population increasing at different rates?

36
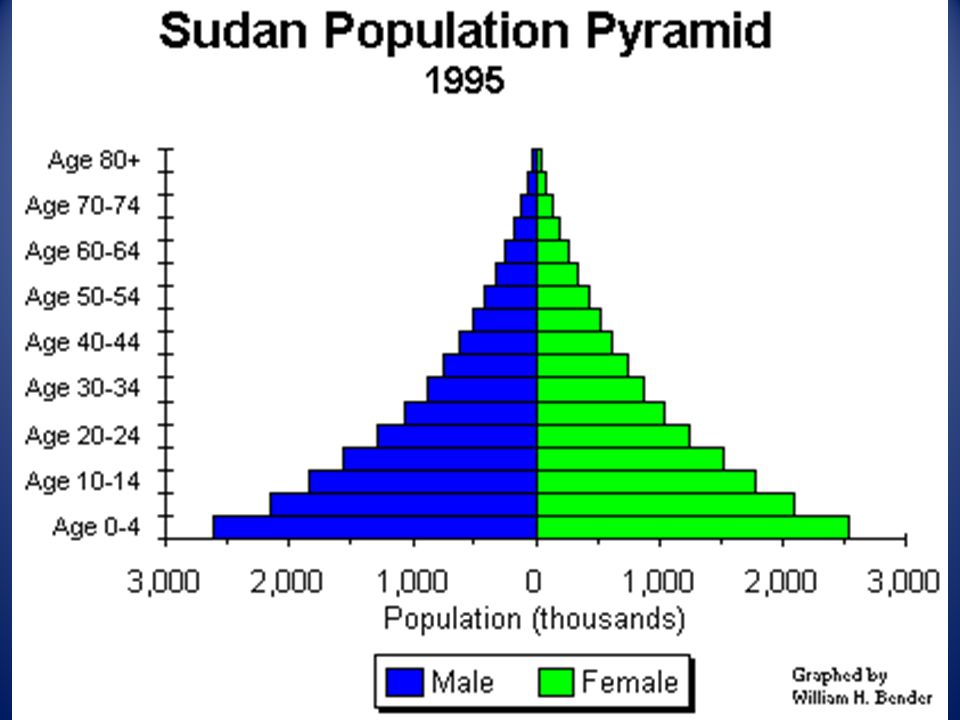
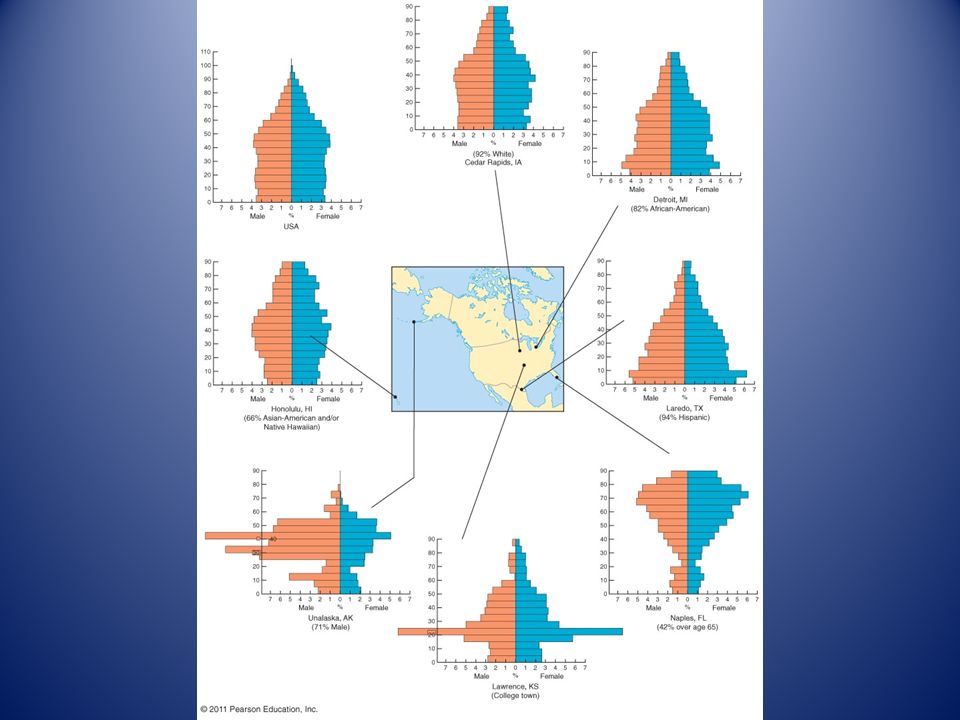
What is a population pyramid?

37
“A population pyramid is a graphical illustration that shows the distribution of various age groups as well as the sex ratio, the number of males per hundred females and the dependency ratio, the number of people who are too old or too young to work.

40
What is a model?

41
“A model attempts to explain or demonstrate why something exists the way it does. “

42
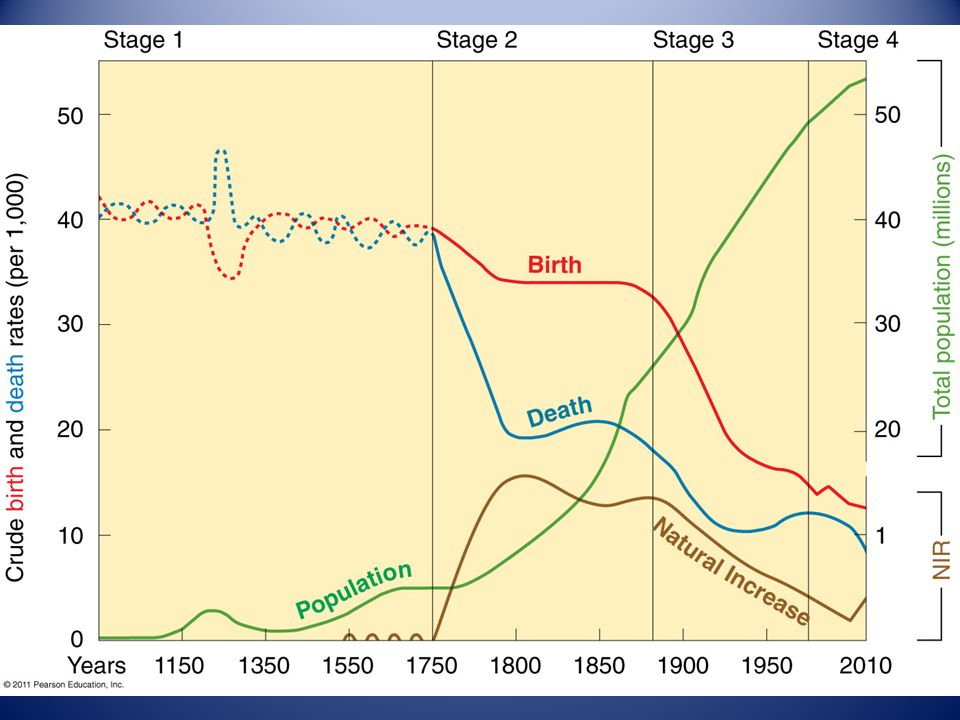
What is the demographic transition model?

43
“The demographic transition model explains the transition from high birth and death rates to low birth and death rates as a country develops from a pre-industrial to an industrialized economic system.

44
Stage 1: Low Growth Stage 2: High Growth Stage 3: Moderate Growth Stage 4: Low Growth

46
Stage 1: Low Growth 1.People depended on hunting and gathering for food. 2.Most of human history spent during this stage. 3.The NIR is essentially zero. 4.There is no country still in stage 1.

47
1.Brought about by the Industrial Revolution. 2.CDR Plummets while the CBR remains the same as in stage 1. 3.Allowed to spread to LDRs by the medical revolution (20 th century) Stage 2: High Growth
 Stage 2: High Growth.")
48
1.Brought about by cultural changes. 2.Characterized by a sudden drop in the CBR. 3.There is still growth but not as fast as in Stage 2 Stage 3: Moderate Growth

49
1.The CBR = CDR 2.Zero Population Growth 3.Low TFR Stage 4: Moderate Growth

50
1.Though not official, some say that there is a Stage Five. 2.In stage five, CDR is greater than CBR largely because of an aging population. 3.The NIR is below Zero. 4. Much of Europe is entering this stage. Stage 5: Negative Growth

51
Part 4: Overpopulation?

52
Thomas Malthus My theory is that population is growing too rapidly because while population increases geometrically, food supply increases arithmetically.

53
Thomas Malthus’ Theory

54
Malthus Supporters: Malthus’ theory did not take into account the rapid growth of LDCs. World population is not just stripping food but a lot of other resources as well.

55
Malthus Critics: His theory is based on a belief that the world’s supply is fixed rather than expanding. A larger population could stimulate economic growth to produce greater resources.

56
The Reality of Population Growth

57
Food is increasing more rapidly than predicted by Malthus.

58
Birth rates are declining.

59
Why are birth rates declining?

61
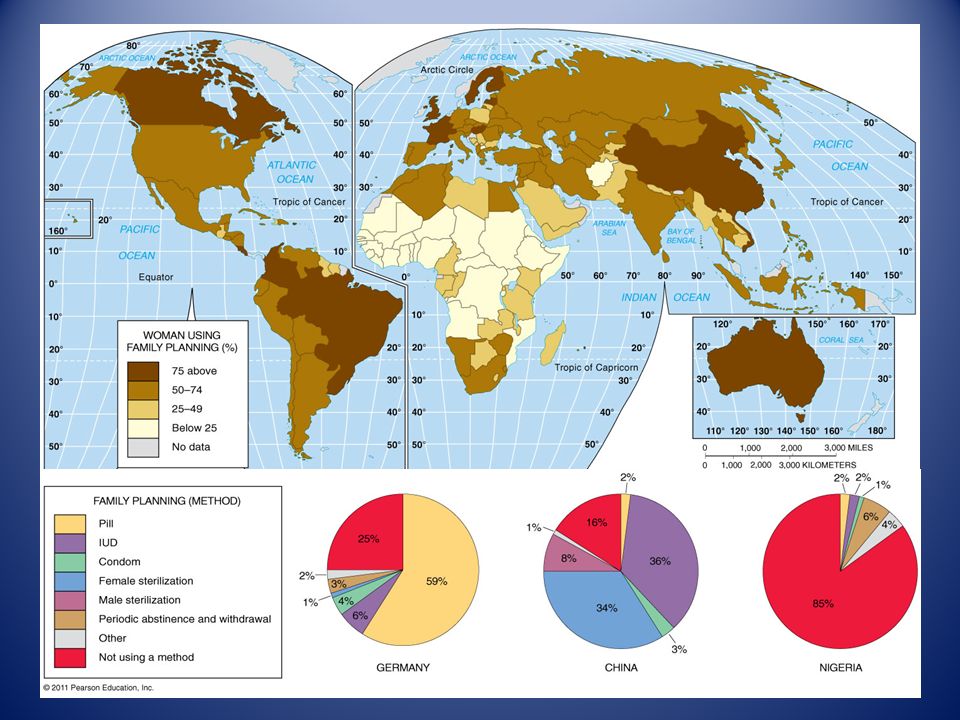
How do governments affect population?

62
What is the difference between expansive and restrictive population policies??

63
“Expansive population policies encourage large families. Restrictive population policies seek to reduce the rate of natural increase.”

64
How does disease affect population?

65
What is the Epidemiologic Transition Model?

66
“The Epidemiologic Transition Model focuses on distinctive causes of death in each stage of the demographic transition.”

67
The stage of Pestilence and Famine Example: The Black Death Stage 1 The stage of receding Pandemics Example: Cholera Stage 2 The stage of degenerative and human-created diseases Examples: Cancer and Cardiovascular Disease Stage 3 The stage of delayed degenerative diseases Example: Cancer and disease is slowed or stopped by medical advances. Stage 4 Reemergence of infectious and parasitic diseases. Reasons: Evolution, Poverty, Improved Travel Stage 5 (Possible)
.")
68
What is the largest epidemic of our time?

Similar presentations