Download presentation
Presentation is loading. Please wait.

1
Annual Growth, Catch-up Growth Lynn Fielding,
January 14, 2010 Anchorage, Alaska Lynn Fielding, School Board Member, Attorney, Author Greg Fancher, Asst Superintendent of Elementary Education, Kennewick WA

2
Kennewick Kennewick Portland

3
Kennewick School District
Ethnic Make- up Anglo % Hispanic % Asian % African-American 2% Staff: Teachers Classified Administrators Enrollment: 15,000 Schools: 13 Elementary 4 Middle Schools 3 High Schools 1 Vocational Center 50% Free and Reduced: Budget $152 M

4
Stating the Obvious Reading is our most basic academic skill.
85% of curriculum is delivered by reading including math--there are far more words than numbers in math textbooks. No other educational success can compensate for failure to teach reading early and well. Change must affect classroom practice.

6
Today: Overview: Cradle to College Changing Cradle to Kindergarten
Changing Kindergarten to College Coming together in Kennewick

7
A. The Mt. McKinley View of Cradle to College

8
Mindy Tony

9
Skills typical of 5 year range 7-year old 6-year old 5-year old

10
Mindy Tony

11
It takes about an hour of normal classroom instruction for 180 days to make up each year a student is behind.

12
Behind: 1 year 60 minutes x 180 days 2 years minutes x 180 days 3 years 120 minutes x 180 days

13
Mindy Tony Understanding the Bands REDO +2 yrs +1 yrs -1 yrs - 2 yrs
Grade level -1 yrs - 2 yrs -3 yrs K

14
2 ¼ years 3 ½ years 4 ½ years 5 ¾ years 7 years Math achievement from the beginning of second grade through beginning of 10th grade. Arrows show how many years earlier the upper band achieved the 10th grade math levels of each lower band.

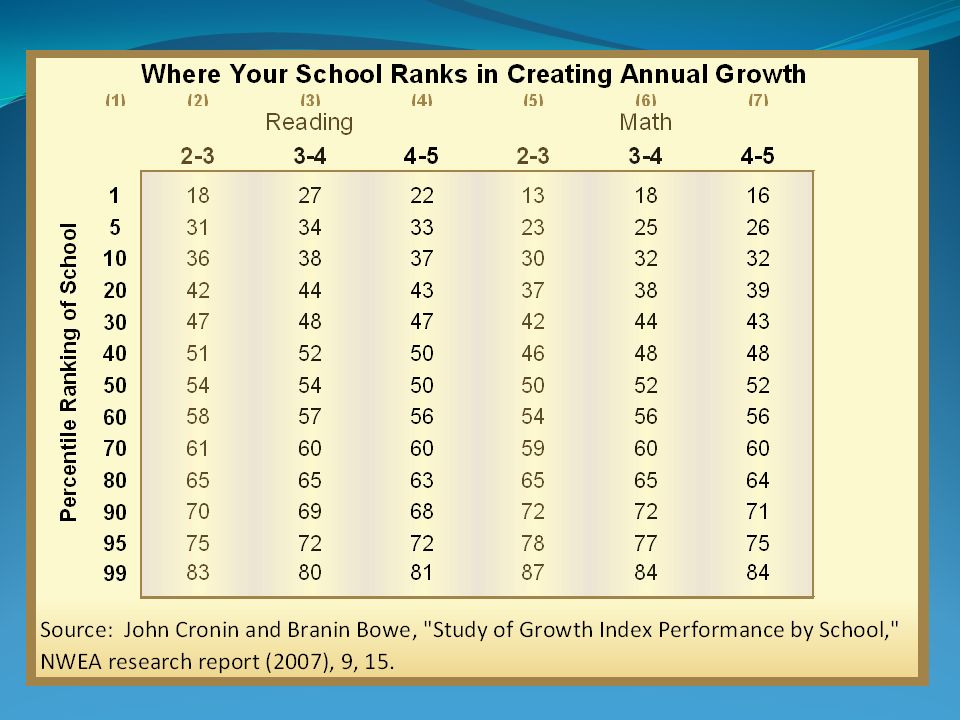
15
This chart was derived from copyrighted data provided by NWEA from 7,520 students whose reading scores and 8,842 students who’s math scores were available during both at the end of third grade and the end of eighth grade in reading and math. © 2009 Northwest Evaluation Association. This chart was derived from copyrighted data provided by NWEA from 7,520 students whose reading scores and 8,842 students who’s math scores were available during both at the end of third grade and the end of eighth grade in reading and math. © 2009 Northwest Evaluation Association.

16
National odds at birth of enrolling in a four-year university directly out of high school
Total number of freshman seats available at four-year universities 1,277,700 Number of students at each grade level ,752,200 Odds at birth of your child enrolling as a freshman in a four-year university One in three (1:3)
")
17
Alaska odds at birth of enrolling in a four-year university directly out of high school
Total number of freshman seats available at Alaska four-year universities ,325 Number of students at each grade level ,866 Odds at birth of your child enrolling as a freshman in a four-year university One in five (1:5)
")
19
98% 63% 44% 25% 12% -0%

20
54% to 63% of dropouts

21
Community College Completion Rates
Typical annual enrollment at all community colleges 10,133,874 Less non-degree/non-certificate-seeking attendees (12%) -1,216,065 Certificate- or degree-seeking students ,917,809 Full-time two-year equivalent students ,458,904 Associate degrees awarded annually ,293/4,458,904 = Certificates awarded annually: Less than one year ,249 One to two years ,724 More than two, less than four ,026 Annual certificates awarded ,999/4,458,904 = Total AA and certificates awarded annually ,292 / 4,458,904 = 11% 5% 16%
 -1,216,065. Certificate- or degree-seeking students 8,917,809. Full-time two-year equivalent students 4,458,904. Associate degrees awarded annually 486,293/4,458,904 = Certificates awarded annually: Less than one year 133,249. One to two years 94,724. More than two, less than four 8,026. Annual certificates awarded 235,999/4,458,904 = Total AA and certificates awarded annually 722,292 / 4,458,904 = 11% 5% 16%")
23
Summary: Everything here is common sense
5 year range by kindergarten caused results at home Annual growth keeps 70%+ students in the band they start in. With catch-up growth and differences in teaching and motivation 30% of students move bands. Predictable post secondary outcomes by high/low bands. Spending billions maintaining this predictable pattern.

24
B. Changing Cradle to Kindergarten

25
25

26
26

27
A question you might ask is, “Where do you want. your child or
A question you might ask is, “Where do you want your child or your grand-child or the children in this community to start?” 27

29
Children’s Reading Foundation
Local affiliates 14 local affiliates serving 758,000 students in 127 districts Simple repetitive message: The most important 20 minutes of your day Read to a child. $1 a student-locally funded, locally operated Nancy Kerr (509)
")
30
Your current structure, resource allocation and beliefs are perfectly designed to create your current results.

31
Targets, training and tools for parents
Three 90 minute lessons per year per age level Kennewick alone: 22,000 parent/lessons served 78% of students whose parents attended entered with at or above grade level skills. $135 per parent per year plus local delivery costs. Created more “buzz” than a state championship. readyforkindergarten.org

32
How would entering kindergarten knowing very few basic skills affect a child’s success in school? Thrive by Five Washington Survey 64% of parents believe: “Child will catch up to other children within a year or two.” 27% of parents believe: “Child will be behind other children throughout school years.” 9% of parents: “Not sure”. The single most cost effective thing is to change this perception of parents.

33
C. Changing Kindergarten
to College

34
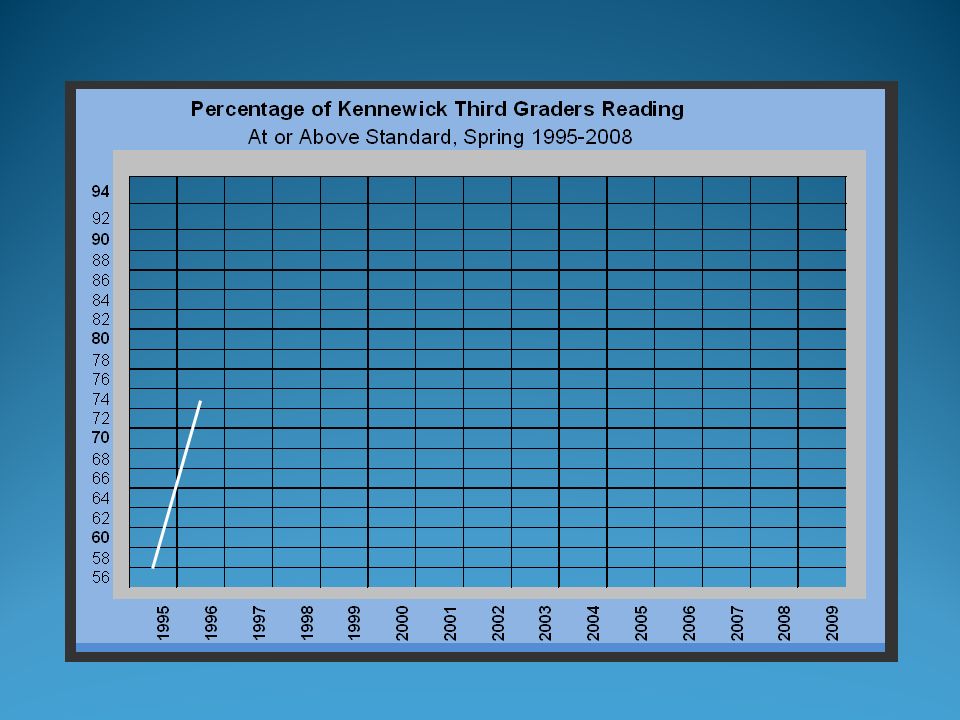
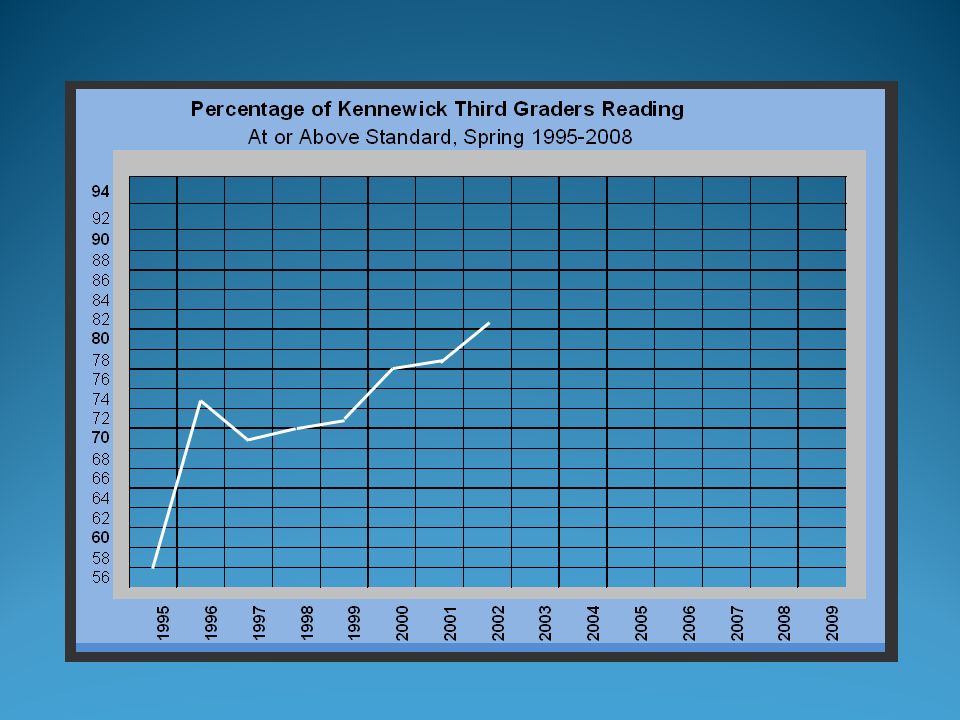
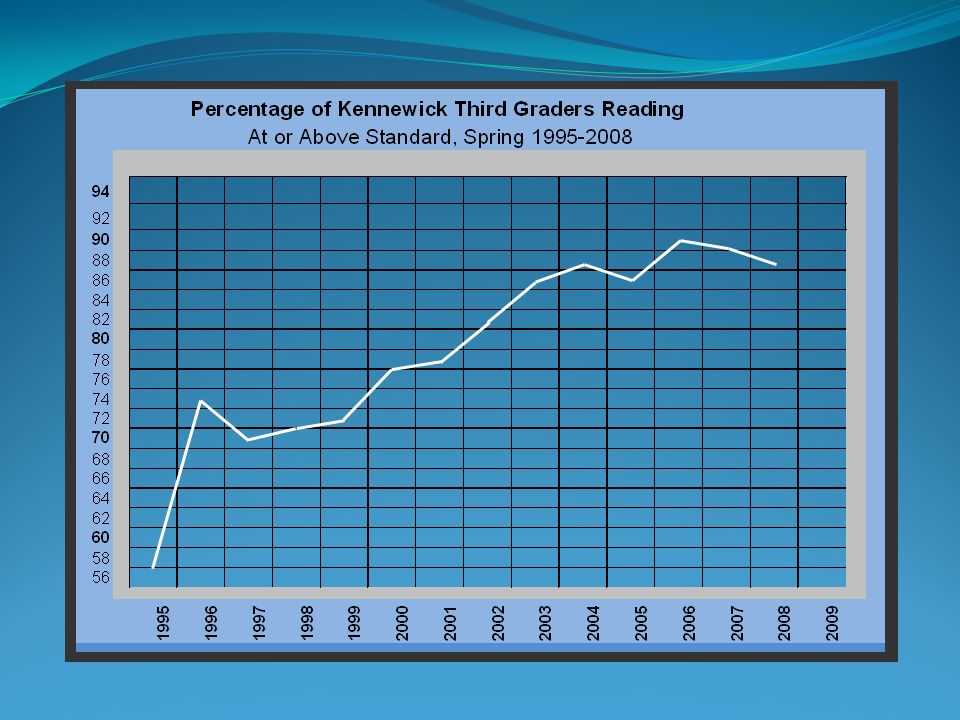
A Clear Measurable Reading Goal
The highly visible 90% Reading Goal created a clear line of sight from where we were to where we need to go. White paper-basis for subsequent change (page 239) Coming to grips with disparity between what we believed and what we lead our community to believe
 Coming to grips with disparity between what we believed and what we lead our community to believe.")
35
“We thought the board was crazy.” - David Montague, Principal, 1996
“Ten years ago, we had little idea what to do. Now we know what to do. The challenge is getting people to do it.” David Montague, Principal 2006 National Distinguished Principal of the Year-Washington State

36
Annual Growth: Curriculum
Created by solid reading programs emphasizing accuracy, fluency, comprehension, phonemic awareness and explicit phonics. “In primary grades, a minimum of 2 …hours of instruction is recommended.” CORE Sourcebook 22.6

37
Annual Growth-Instruction
Eye-ball to eye ball Perhaps twice as effective at Washington than ten years before District instructional conferences Instruction is our craft Impact on “talk”- “media stars”

38
Annual Growth: Time “In primary grades, a minimum of 2 …hours of instruction is recommended.” CORE Sourcebook 22.6 “120 minutes of eyeball to eyeball instruction Kennewick practice

40
“Annual growth” for all students is hard to achieve.
Yet a year of growth each year merely perpetuates the gap between the four quartiles. Catch-up growth is required to close it.

41
Catch-up Growth (Targeted Accelerated Growth –TAG)
Diagnostic testing to determine the deficient sub-skills of those behind Proportional increases in direct instruction time Teaching to the deficient sub-skill Retesting to assure that adequate catch-up growth actually occurred

42
Catch-up Growth When students leave kindergarten three years behind in reading, they must make six years of growth in three years to catch-up by 3rd grade. This means they must make one year of annual growth and one year of catch-up growth each year. Or, said another way, two years of growth in each 1st, 2nd, and 3rd grades to catch up.

43
Diagnostic testing Use of additional tests by leading schools
Use of sub-skill data in existing tests NWEA testing to look at sub skills. See page Annual Growth page 74 for other specific (10) diagnostic tests
 diagnostic tests.")
44
“In God we trust. Everyone else shows their data.” -unknown
Diagnostic testing and data “In God we trust. Everyone else shows their data.” unknown

45
Diagnostic testing and data
“You can either fight assessment or embrace it. However, you cannot be a high-performance school without embracing assessment.” Dave Montague

46
Diagnostic testing and data
“There is no point in testing if you don’t look at the data, don’t understand it, and don’t change.” -Chuck Watson, Principal-Vista Elem., Kennewick, WA

47
Proportional increases in instructional time for those who are behind.
Students who are behind do not learn faster than those who are ahead. Catch-up growth is driven primarily by proportional increases in direct instruction time. Catch-up growth is so difficult to achieve that it can be the product only of quality of instruction in great quantity.

48
Individual Student 3rd Grade Scores at Thirteen Kennewick Elementary Schools, Fall 2002
Canyon View Sunset View Washington Hawthorne Ridge View Southgate Westgate Amistad Cascade Eastgate Edison Lincoln Vista Page 42

49
Increased time: a real life problem
Tony has just scored at the 11th percentile on the spring 2nd grade reading test. His state set their reading standard at the 50th percentile. How much direct reading instruction does Tony need during 3rd and 4th grade to assure he will reach the state standard by the end of 4th grade?

50
Increased time: real life problem continued
State Standard in percentiles is…….. Percentile Tony’s 2nd grade status in percentiles Percentile Difference is……………………………………………… Points Rough rule of thumb is 13 percentile points = 1 year of growth In elementary school the normal reading period has been minutes d. Divide the gap in points by 13 points to convert the gap into instructional years……… 3rd th Annual Growth minutes Catch-up Growth 1 extra year 1/2 extra year Total Minutes 50 11 39 3 years 70 70 70 70 35 35 175 175

51
Standard Reading Block Plus Intervention Block Minutes Kennewick Elementary Schools by School by Grade for

52
Retesting to assure that adequete increases in growth occurred.
Adult change when it does not.

54
D. The Kennewick Experience

57
1999 Insight When we actually said out loud:
“We do not know how to do this.” Very liberating—As long as you know what to do, the issue is just working harder at what you have always done. Telling the truth is always very difficult in this process.

58
Belief Sets Believe follows achievement.
Must learn to hold impossible beliefs to achieve impossible things.

59
“We like to think we follow our beliefs
“We like to think we follow our beliefs. In reality, our beliefs follow our experience.” Paul Rosier

60
“There is no use trying,” said Alice;
“one can’t believe impossible things.” “I dare say you haven’t had much practice,” said the Queen. “When I was your age, I always did it for half an hour a day. Why, sometimes I’ve believed as many as six impossible things before breakfast”. –Lewis Carroll

61
Data and use of data Could not see what was happening in kindergarten, first and second grade. Adding of district tests at K, 1 and 2 Adding of diagnostic tests by the buildings Modeled use of data at each level.

63
Length of Instruction Locke-Bergeson story Mansfield story
Girls championship basketball story. Labor day versus November 1

65
The Implementation Years

66
Teachers Reading is now their priority Trained Teach the curriculum
Knew where all the kids were Cooks knew where the kids were Unheard of levels of teaming

67
Teaming Movement of kids within remediation Sharing para-pros.

68
Fluid, Flexible Teaming

69
Principals Became reading experts
Attended all the staff reading training Knew where all the kids were (data) Knew the research Were in classrooms, not in the office Established look-fors (inspect your expectations)
 Knew the research. Were in classrooms, not in the office. Established look-fors (inspect your expectations)")
71
Endure: Dealing with the Emotional Pain of Leadership
In entrenched low performing schools, teachers will hate and despise you. Principals whom you replace and their friends will despise you for high achievement. You must learn to be the sole holder of impossible beliefs to achieve impossible things until performance provides proof.

73
in the same way we’ve always done it
If we know we have to improve, yet continue to do what we’ve always done in the same way we’ve always done it and continue to get the same results… Who really are the slow learners?

75
Over arching concept today:
These are pretty ordinary guys. Kennewick is a pretty ordinary district. If they can achieve these kinds of results, we should be able to.

Similar presentations


 in Primary Grades>")


