Download presentation
Presentation is loading. Please wait.

1
Child Nutrition

2
Child Nutrition | MGIMS, Sewagram | 31 st Oct 2012 Clinical assessment –Obvious wasting, Edema Anthropometric measurements Biochemical assessment –Blood tests Dietary assessment –Survey of food eaten http://www.globalaware.org/Images/MLW112sm.jpg Measuring undernutrition

3
Child Nutrition | MGIMS, Sewagram | 31 st Oct 2012 Weight Height Mid-upper Arm Circumference Head circumference Chest circumference Skinfold thicknesses Comparisons made to reference population Anthropometric measurements

4
Child Nutrition | MGIMS, Sewagram | 31 st Oct 2012 Stunting –Low height for age Underweight –Low weight for age Wasting –Low weight for height Same age girls Anthropometric indicators

5
Child Nutrition | MGIMS, Sewagram | 31 st Oct 2012 Normal Curve

6
Child Nutrition | MGIMS, Sewagram | 31 st Oct 2012 Stunting: low height for age Over 200 million children are stunted –40% of all preschool children in developing countries http://lh3.ggpht.com/_B9ewHcmqIAA/RpwXq1CfJ1I/AAAAAAAAA ss/V145foIlbcw/Kenya+2007+1401.jpg Stunting

7
Child Nutrition | MGIMS, Sewagram | 31 st Oct 2012 http://www.theglobaleducationproject.org/earth/images/final-images/stunting-map.gif Stunting

8
Child Nutrition | MGIMS, Sewagram | 31 st Oct 2012 Low weight for age –150 million children are underweight 26% of world’s children http://www.squidoo.com/make_a_difference Underweight

9
Child Nutrition | MGIMS, Sewagram | 31 st Oct 2012 Underweight http://www.msf.org.za/MalnutritionCampaign/pics/map_hotspots_large.jpg

10
Child Nutrition | MGIMS, Sewagram | 31 st Oct 2012 Wasted Below normal weight for height 52 million children are wasted Two thirds of these live in Asia –half in South Asia http://www.sfgate.com/c/pictures/2006/03/30/mn_africa26_032_mac.jpg

11
Child Nutrition | MGIMS, Sewagram | 31 st Oct 2012 Mid Upper Arm Circumference (MUAC) Easy way to determine undernutrition in preschool children –upper arm circumference doesn’t change much Normal –Over 13.5 cm Severely Acute Malnutrition –Under 11.5 cm http://www.cooler-marketing.com/img/MUAC31.jpg
 Easy way to determine undernutrition in preschool children –upper arm circumference doesn’t change much Normal –Over 13.5 cm Severely Acute Malnutrition –Under 11.5 cm")
12
Child Nutrition | MGIMS, Sewagram | 31 st Oct 2012 Body Mass Index (BMI) ● The BMI is defined as weight in kilograms divided by height in metres squared (kg/m2). ● A cut-off point of 18.5 is used to define thinness or acute undernutrition and a BMI of 25 or above indicates overweight or obesity. A BMI of 17.0-18.4 refers to mildly thin and <17.0, refers to moderately/severely thin. A BMI of over 30.0 refers to obesity. ● The BMI data discussed excludes women who were pregnant at the time of the survey and women who gave birth during the two months preceding the survey.

13
Child Nutrition | MGIMS, Sewagram | 31 st Oct 2012 Undernutrition About 55% of the 11 million deaths among under-five children each year in the developing world are associated with undernutrition http://www.unicef.org/sowc98/figure1.gif

14
Child Nutrition | MGIMS, Sewagram | 31 st Oct 2012 Global - Causes of Under five Mortality

15
Child Nutrition | MGIMS, Sewagram | 31 st Oct 2012 Percent Undernutrition in Children under Age 3 Years

16
Child Nutrition | MGIMS, Sewagram | 31 st Oct 2012 Percent Undernutrition in Children under Age 3 years

17
Child Nutrition | MGIMS, Sewagram | 31 st Oct 2012

18
Children’s Nutritional Status Varies by State

19
Child Nutrition | MGIMS, Sewagram | 31 st Oct 2012 Stunted Wasted Under weight Target Population for Nutrition Interventions Nearly 30% of the children start at a disadvantage at birth with Low birth weight The proportion of underweight and stunted children rises from 6 moths onwards plateaus at 24 months Window of Opportunity: -9 to +24 months

20
Child Nutrition | MGIMS, Sewagram | 31 st Oct 2012 Target population for Nutrition Interventions Key Points: Target group for nutrition programmes Under five Children with a focus on under twos Women during pregnancy and lactation Adolescents (10-19 years)
")
21
Child Nutrition | MGIMS, Sewagram | 31 st Oct 2012 Mother and Child Protection Card Unified Mother and Child protection card as a tool for growth monitoring and counseling Wt/age (underweight) measured at the field level in AWC and VHNDs Ht/Age and Wt/Ht (wasting) to be measured at health facility level Use of new WHO Child Growth Standards – use of separate charts for girls and boys and use of Z score
 measured at the field level in AWC and VHNDs Ht/Age and Wt/Ht (wasting) to be measured at health facility level Use of new WHO Child Growth Standards – use of separate charts for girls and boys and use of Z score")
22
Child Nutrition | MGIMS, Sewagram | 31 st Oct 2012 Demistifying ECD – Age appropriate Play and Communication activities

23
Child Nutrition | MGIMS, Sewagram | 31 st Oct 2012

24
What is Growth Monitoring Growth monitoring comprises a package of activities: –regularly measuring the weight of children; –plotting the information on a growth chart to make abnormal growth visible; –if growth is abnormal (usually faltering), the health worker does something, in concert with the mother; –as a result of these actions, the child's nutrition improves, the child receives appropriate social or medical support, or doctors are able to diagnose early serious disease.
, the health worker does something, in concert with the mother; –as a result of these actions, the child s nutrition improves, the child receives appropriate social or medical support, or doctors are able to diagnose early serious disease.")
25
Child Nutrition | MGIMS, Sewagram | 31 st Oct 2012 Growth Monitoring An opportunity for health promotion. –Discussion around feeding, hygiene, and other aspects of the child's health and behaviour. –A way of reassuring parents, and convincing them of the value of good nutrition. –Adds value as far as the parents are concerned to existing child activities in clinics

26
Child Nutrition | MGIMS, Sewagram | 31 st Oct 2012 More in rural(71.5) as compared to urban (63) areas Varies from 76% in lowest wealth index to 52% in highest No sex differentials Anemia in children 6 – 59 months No Anemia Severe Anemia Moderate Anemia Mild Anemia
 as compared to urban (63) areas Varies from 76% in lowest wealth index to 52% in highest No sex differentials Anemia in children 6 – 59 months No Anemia Severe Anemia Moderate Anemia Mild Anemia")
28
Relationship Between Child Mortality & Weight-for-Age (WA) as a Percentage of International Median
 as a Percentage of International Median")
29
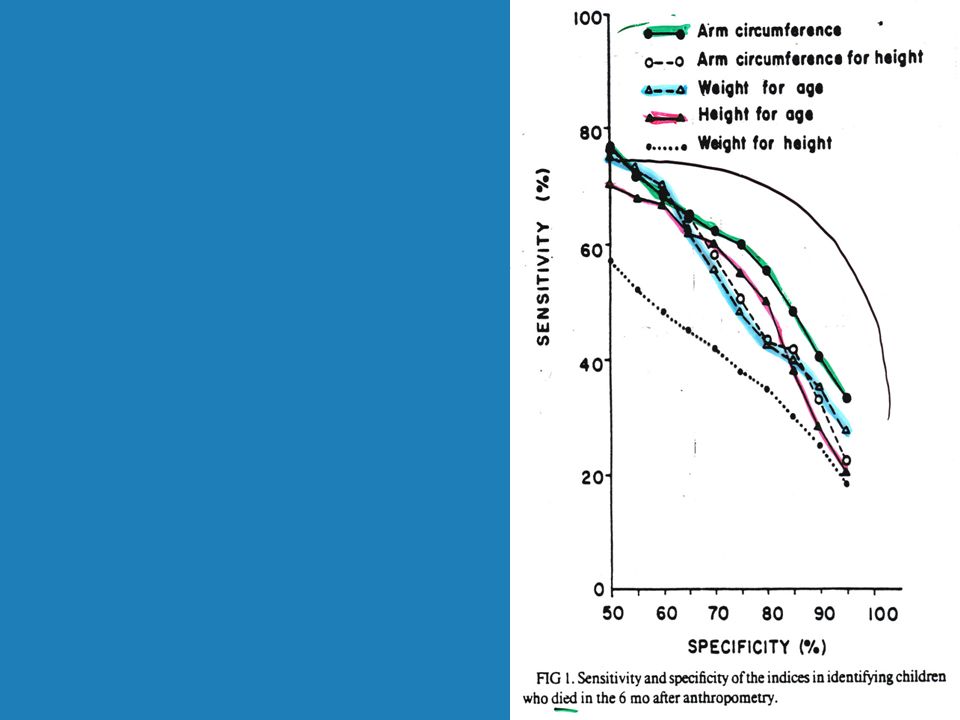
Relationship Between Child Mortality & Mid-Upper Arm Circumference (MUAC)
")
Similar presentations


 and understand its scope and effects Share who some of the.>")


 Adult Nutrition.>")
, or Quetelet index, is a measure for human body shape based on an individual's weight and height.>")


