Download presentation
Presentation is loading. Please wait.

7
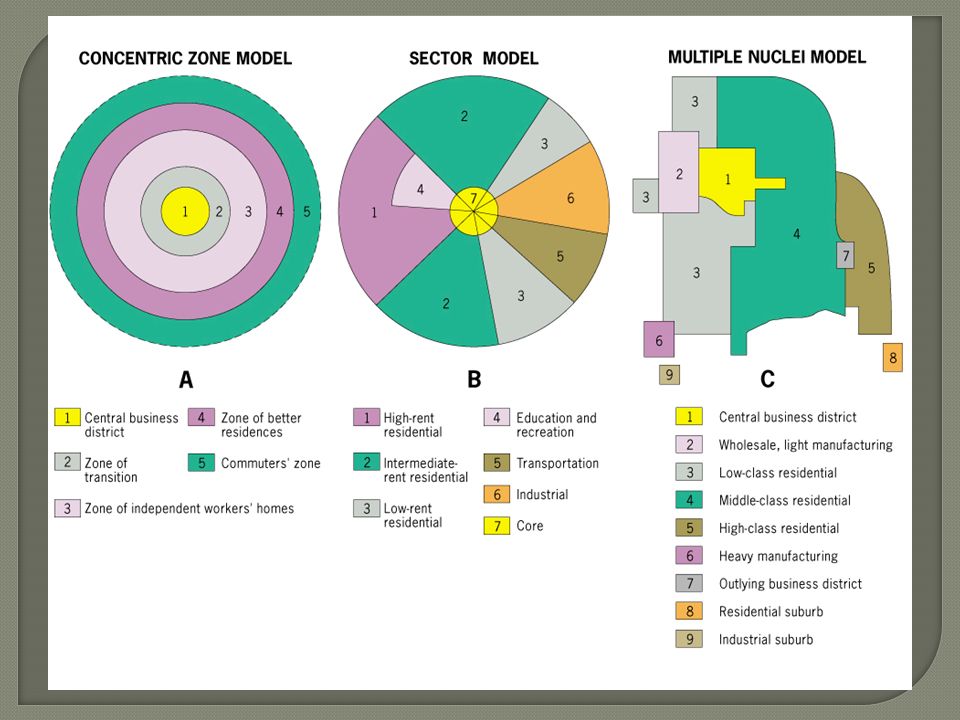
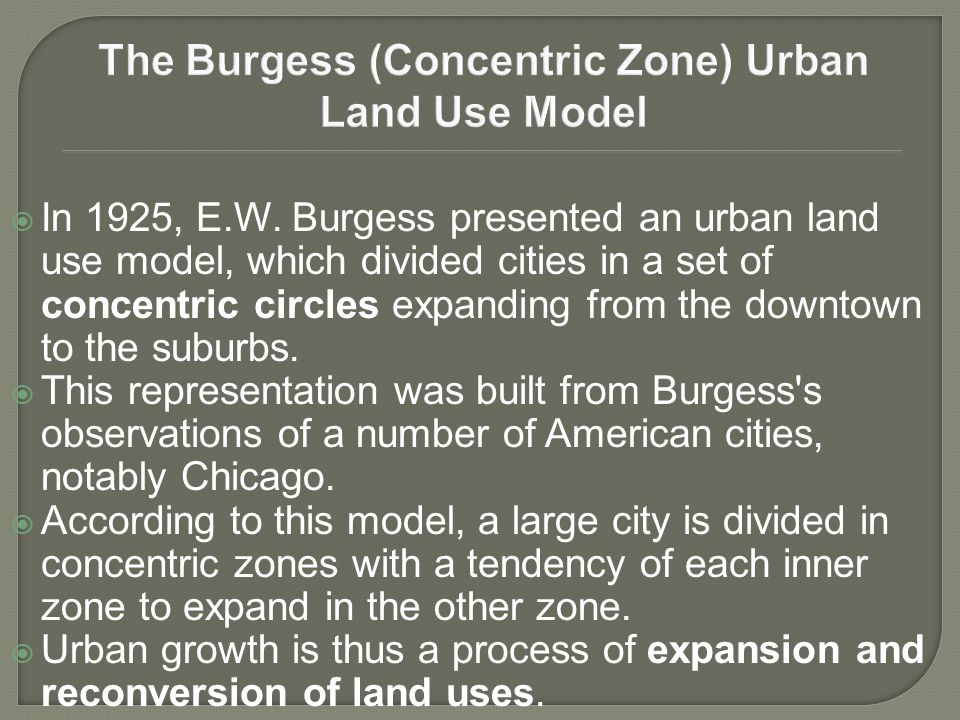
In 1925, E.W. Burgess presented an urban land use model, which divided cities in a set of concentric circles expanding from the downtown to the suburbs. This representation was built from Burgess's observations of a number of American cities, notably Chicago. According to this model, a large city is divided in concentric zones with a tendency of each inner zone to expand in the other zone. Urban growth is thus a process of expansion and reconversion of land uses.

8
The model is too simple and limited in historical and cultural applications The model was developed for a specific era in the US American cities were growing very fast in demographic terms when individual transportation was still uncommon. This concept cannot be applied in a contemporary context where highways have enabled urban development to escape the reconversion process and settle in the suburbs. The model was developed for American cities and has limited applicability elsewhere. The concentric model assumed a spatial separation of place of work and place of residence, which was not true until the twentieth century.

9
A study done in 1939 by Homer Hoyt Land use pattern was not a random distribution, Not sharply defined rectangular areas or concentric circles BUT rather, sectors. Communication axes are mainly responsible for the creation of sectors, thus transport has directional effect on land uses.

10
C.D. Harris and E.L. Ullman (1945) introduced the Multiple Nuceli model Many towns and nearly all large cities do not grow from around one CBD, but are formed by the progressive integration of a number of separate nuclei in the urban pattern. These nodes become specialized and differentiated in the growth process and are not located in relation to any distance attribute, but are bound by a number of attributes: (see next slide)
 introduced the Multiple Nuceli model Many towns and nearly all large cities do not grow from around one CBD, but are formed by the progressive integration of a number of separate nuclei in the urban pattern. These nodes become specialized and differentiated in the growth process and are not located in relation to any distance attribute, but are bound by a number of attributes: (see next slide).")
11
Differential accessibility. Some activities require specialized facilities such as port and rail terminals. Land use compatibility. Similar activities group together since proximity implies improved interactions. Service activities such as banks, insurance companies etc. Land use incompatibility. Some activities are repelling each-other such as high quality residential and heavy industrial. This may be defined as centrifugal forces. Location suitability. Some activities cannot afford the rent of the optimal site for their location. They are thus locating at cheaper places, which are not optimal, but suitable for these activities.

12
PLACE THEORY More small places than big places Big places farther apart than small places Ratio of big places to small places relatively constant

13
PLACE A settlement whose livelihood depends on the sale of goods and services to people in the surrounding area

14
Hamlet Village Town City Metropolis

15
Grocery Stores Gas Stations Jewelry Stores Book Stores Hair Stylists Auto Dealerships Houses of Worship Schools Doctors Dentists Museums Concert Halls

16
Stock Exchange Sports Stadium Regional Shopping Mall Major Department Store Income Tax Service Convenience Store Gas Station

17
Threshold: the minimum number of people needed to support a central place function With fewer customers a store cannot afford to stay in business. Range: the maximum distance beyond which a person will not travel to purchase a good or service Beyond a certain distance people cannot afford the travel costs.

18
A new hospital? A new high school? A new mall? A new café? A new grocery store? A new Starbucks? A new McDonalds? A new baseball team?

19
“If all the settlements of a country are ranked according to population size, the sizes of the settlements will be inversely proportional to their rank” Zipf The primate city is commonly at least twice as large as the next largest city and more than twice as significant. Mark Jefferson, 1939

20
FACTOIDS Capital city of for more than 200 years One of the world's populated cities Registered population of over 5.5 million (Estimated actual population of up to 8 million) 1,568 sqkm area Recently has seen explosive growth of urbanization Growth started recently, in the fifties and sixties
 1,568 sqkm area Recently has seen explosive growth of urbanization Growth started recently, in the fifties and sixties")
21
Urban Primacy - where the largest city is a many times larger than the second city. A huge dichotomy exists between Bangkok (5.9 million) and Thailand's second city, Nakhon Ratchasima (278,000).
 and Thailand s second city, Nakhon Ratchasima (278,000)..")
22
France UK Mexico Thailand

24
FFavourable initial advantages for site AAdvantages maintained and enhanced MMagnetic attraction for businesses, services and people (cumulative effect) DDisproportionate growth increases attractiveness HHas a parasitic effect, sucking wealth, natural and human resources.
 DDisproportionate growth increases attractiveness HHas a parasitic effect, sucking wealth, natural and human resources.")
25
FOR They attract overseas investment and benefits that will eventually benefit the whole country AGAINST They are unstoppable monsters that create serious problems, shortages and escalating land prices that make them less attractive places to live in.

26
FFlooding RRefuse TTransport RRecreation PPollution PPoor Planning FFinance CConflicting demands RRapid urbanization

27
India U.S.A. China Canada Australia Brazil

28
If all cities in a country are placed in order from the largest to the smallest, each one will have a population half the size of the preceding city.

29
George Zipf – 1949 “The second and subsequently smaller cities represent a proportion of the largest city”. (Explains the size cities in a country)
.")
31
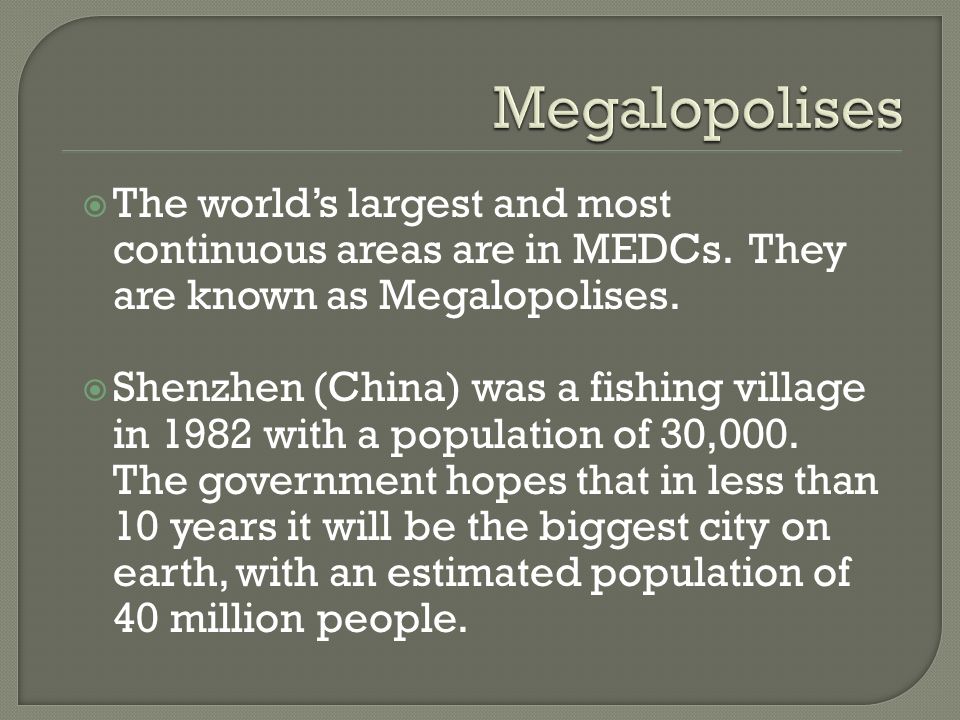
The world’s largest and most continuous areas are in MEDCs. They are known as Megalopolises. Shenzhen (China) was a fishing village in 1982 with a population of 30,000. The government hopes that in less than 10 years it will be the biggest city on earth, with an estimated population of 40 million people.
 was a fishing village in 1982 with a population of 30,000. The government hopes that in less than 10 years it will be the biggest city on earth, with an estimated population of 40 million people..")
Similar presentations


>")

