Download presentation
Presentation is loading. Please wait.

1
David Cook, P.E. State Maintenance Engineer, SCDOT

2
Three sign production facilities 3 sign shop supervisors 2 sign delivery drivers 25 total employees Long wait time for signs (over 100 days) Large inventories in county sign shops
 Large inventories in county sign shops")
3
One facility – The State Sign Shop 1 Shop Supervisor 8 production workers Up to 500 signs per day Free Shipping! Signs made in 30 days or less Reduced production costs by over $500,000 per year

4
BeforeAfter 3 Manufacturing facilities 3 Sign Shop Supervisors 2 Delivery Trucks 25 Total Employees Long wait time (up to 100 days) 1 Manufacturing facility 1 Sign Shop Supervisor Free Shipping! 9 Total Employees Orders filled in 30 days or less Reduced production cost by over $500,000 per year

5
Production Analysis Production Goals Staffing Estimates SMART Goals Monitor Performance

6
Time Studies - Employees were observed performing tasks. Prep time and volume was considered A reliable maximum production value was identified

7
Screen Printing Rolling and Trimming Large investment in set-up time is for setting up screen printer, making screens, & clean-up

8
100 screened signs 65 minutes

9
100 signs should take a little more than an hour.

11
Hand laid sign production was more difficult to quantify Assumptions and estimates were used We used a 24”x 72” sign for an average size Made allowances for the unique nature of these types of signs

12
From our production study we determined maximum production values Observed maximum production was modified to expected daily production ◦ Safety meetings, training, ancillary duties, facility maintenance, etc. This value was further adjusted with yearly realistic reductions ◦ Annual leave, sick leave, holidays, special projects, equipment down time

13
Holidays Sick days Special projects Equipment down time Four day weeks inspections Equipment Down Time 13 days 5 days 26 days 3 days 10 days 62 days

14
750,000 signs in South Carolina 10 year replacement schedule 12.5% additional for new and damaged signs. About 84,000 signs per year

15
52 weeks X 4 days = 208 days/year Holidays = 13 days/year Sick days = 8 days/year Annual leave = 12 days/year Special projects = 3 days/year Inventory = 5 days/year Annual average work days = 167 Required production 84,000/167 = ~ 500/day

16
1-Supervisor 1-Screen Printer 2-Roll and Trim 2-Hand laid signs 1-Admin 1-Shipping/receiving

17
SMART production goals are part of the position description Production is monitored daily Coaching and counseling is used for underperforming employees All current employees are meeting or surpassing required production goals

18
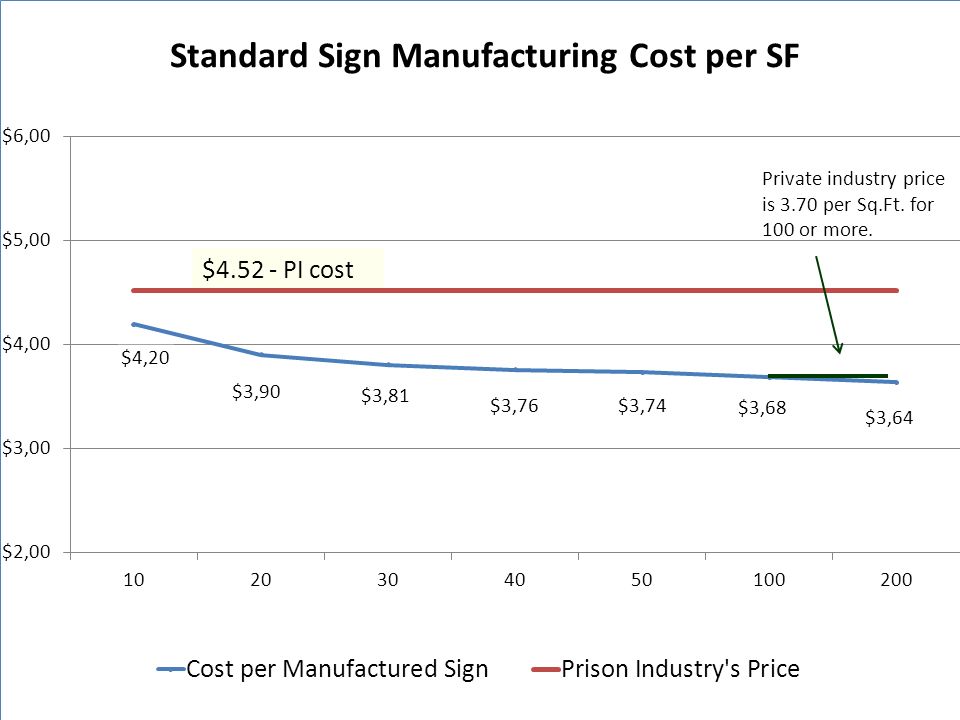
Costs were compared to measure efficiency of new sign production process Private vendors were queried but would only give verbal estimates SCDC Prison Industries produces signs and has a current contract for various types of signs SCDOT production costs encourage in- house sign production

22
In 2003, SCDOT implemented HMMS Need to inventory assets to know what needed to be managed Sign Inventory ◦ Barcode signs and assemblies

23
Sign ◦ Manufacturing Process Manufacture Date Sign Type Sheeting Type Sign Legend ◦ Installation Process Install date Directional Information Linked assembly

24
Assembly ◦ Installation Process ◦ Location County, Route, Milepoint GPS ◦ Associated signs

25
All barcode information was manually recorded and entered into HMMS ◦ Paperwork Lost ◦ Entry Delay ◦ Entry Errors ◦ Inefficient ◦ ….Inaccurate database IT Presentation – Barcode Readers and Tablet PCs

26
Retroreflectivity – Minimum standards ◦ 23 CFR Part 655 ◦ 2009 MUTCD ◦ Regulatory, Warning, and Ground Mounted Guide by January 22, 2015 ◦ Overhead Guide by January 22, 2018 Management Method ◦ “Blanket Replacement Method” ◦ “Expected Life Method”

27
Scanners for Sign Manufacturing Shop iPads and Bluetooth Scanners for Sign Crews

29
200056

36
90 sign trucks statewide 15 signs per day per truck – (avg. daily prod) Reduction of data collection and entry by 2 minutes per sign Results in a savings of 45 hours per day Average loaded rate of $21.75 /hour and 217 actual days worked per year. Total Annual Savings: $213,000 Additional benefits: ◦ Real time data ◦ Accurate data
 Reduction of data collection and entry by 2 minutes per sign Results in a savings of 45 hours per day Average loaded rate of $21.75 /hour and 217 actual days worked per year. Total Annual Savings: $213,000 Additional benefits: ◦ Real time data ◦ Accurate data.")
37
Need to have sense of ownership from IT Need to cache data so it isn’t dependent on cellular service

38
Research Project – Life Expectancy ◦ Develop more specific replacement schedules Sheeting color Direction Sheeting type …? Remove unnecessary signs

Similar presentations


 Presented by Joe.>")


 Model Eyal Cohen APM Annual International Partners Conference May 4, 2011.>")

