Download presentation
Presentation is loading. Please wait.

1
by Dr. Ghulam Rasul Chief Meteorologist Pakistan Meteorological Department rasulpmd@gmail.com Flood Management and Climatic Impacts on Water Resources in Pakistan LEAD Pakistan Leadership Develop Programme (LDP)-Cohort 18 3 rd Learning Session on Climatic Impacts and Disaster in Water 1-5 June 2015, Regent Plaza Hotel & Convention Centre, Karachi
-Cohort 18 3 rd Learning Session on Climatic Impacts and Disaster in Water 1-5 June 2015, Regent Plaza Hotel & Convention Centre, Karachi.")
2
PMD Seismology Meteorology Hydrology

3
LINKAGE TO OTHER MINISTRIES AVIATION METEOROLOGICAL SERVICES AVIATION DIVISION FLOOD FORECASTING SERVICES MINISTRY OF WATER & POWER AGROMETEOROLOGICAL SERVICES MINISTRY OF FOOD SECURITY & RESEARCH NEW MOON PREDICTION & ASTRONOMICAL DATA ANALYSIS MINISTRY OF RELIGIOUS AFFAIRS R & D /RENEWABLE ENERGY RESOURCES MINISTRY OF SCIENCE & TECHNOLOGY FORECASTING & CLIMATOLOGY CLIMATE CHANGE DIVISION & DISASTER MITIGATION ORGANIZATIONS

4
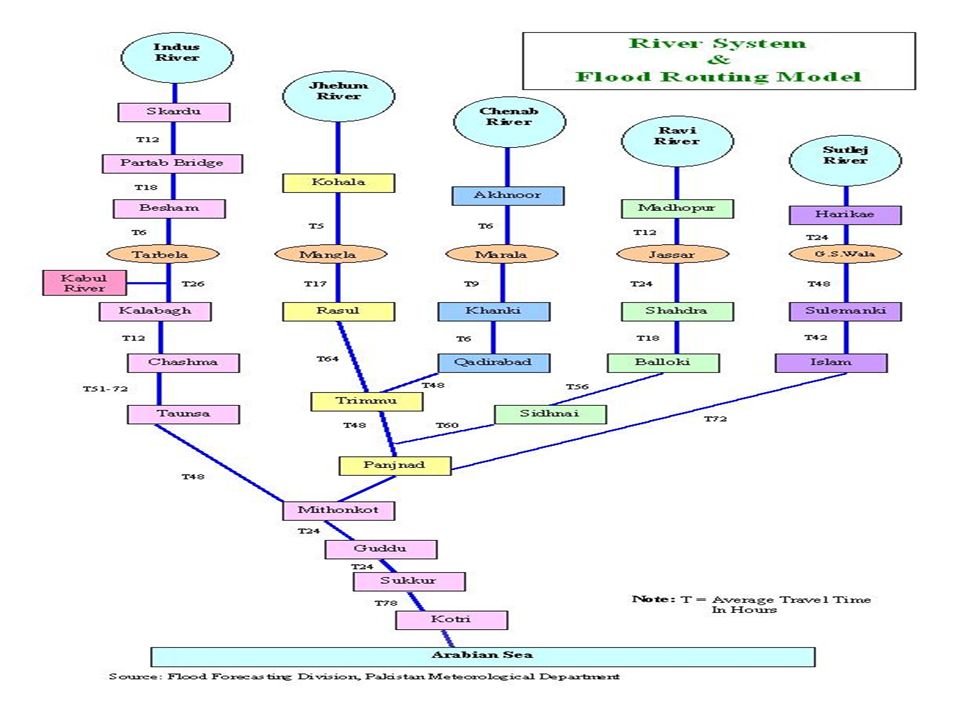
Islamabad Karachi Lahore Multan Peshawar Quetta Regional Forecasting Centres Flood Forecasting Division

5
Total 39 Rain Gauges Total 57 Rain Gauges Total 70 Rain GaugesTotal 120 Rain Gauges

6
Islamabad Karachi Lahore Mangla Sialkot R.Y.Khan Radar Network of PMD

7
RADAR NETWORK OF PMD 5 cm radar at Islamabad 10 cm radar at FFD Lahore Area covered by Doppler radar at Lahore DIK IBD RHK KHI LHR

8
ISLAMABAD RADAR OUTPUT ACCESSIBLE THROUGH PMD WEBSITE (Updated after every 10 minutes)
")
9
NATIONWIDE RADAR NETORK OUTPUT ACCESSIBLE THROUGH PMD WEBSITE (Half hourly update)
")
10
PAKISTANPAKISTAN INDIAINDIA AFGHANISTANAFGHANISTAN INDUS

11
Chenab Jhelum Beas Sutlej Ravi

12
Pakistan’s Cryospheric Assets Number of Glaciers Area of Glaciers (km2) Volume of Ice (km3) Ranges 7259117802066HKH
 Volume of Ice (km3) Ranges HKH")
13
Cryosphere Monitoring Network of Pakistan

14
Glimpses of Glacier Monitoring Stations in Northern Pakistan Askoli, Shigar Valley 2015 m a.s.l Passu Ghar, Passu Glacier 3200 m a.s.l Urdukas, Baltoro Glacier 3926 m a.s.l Patundas, Passu Glacier 4335 m a.s.l,

15
EXISTING TELEMETRIC RAIN & RIVER STATIONS (METEORBURST COMMUNICATION)
")
16
Flood/Tsunami/Tropical Cyclone Forecasting Models IFAS Model- developed in collaboration with Japanese ICHARMIFAS Model- developed in collaboration with Japanese ICHARM FEWS Model- Adopted from NESPAKFEWS Model- Adopted from NESPAK WEB-DHMS Model- Tokyo UniversityWEB-DHMS Model- Tokyo University Storm Track Model- CSIRO AustraliaStorm Track Model- CSIRO Australia Wave Model- MRI JapanWave Model- MRI Japan WRF & COSMO Model- for research on α, β, γ meso-scale phenomenaWRF & COSMO Model- for research on α, β, γ meso-scale phenomena

18
1. Federal Minister, Water & Power, Islamabad. 2. Governor (All Provinces). 3. Chairman NDMA, Islamabad. 4. Chief Minister (All Provinces). 5. Secretary, Aviation Division, Islamabad. 6. Secretary, Ministry of Water & Power, Islamabad. 7. Secretary, Ministry of Information, Islamabad. 8. Chairman NHA, Islamabad. 9. Chief Secretary (All Provinces & AJK). 10. PDMA’S (D.G’S, All Provinces & AJK). 11. Administrator & Chief Secretary, Gilgit-Baltistan. 12. Chairman, Indus River System Authority, Islamabad. 13. Chairman, Federal Flood Commission, Islamabad. 14. Relief Commissioner, (All Provinces & A.J.K). 15. The Secretary General, Red Crescent, Islamabad. 16. Secretary, Irrigation Department, (All Provinces). 17. D.G. Engineers, Eng. Directorate GHQ, Rawalpindi 18. D.G. Relief, (All Provinces). 19. D.G. Emergency Relief Cell, Cabinet Division, Islamabad. 20. Chief Engineer, Mangla/Tarbela/Chashma. 21. Chief Engineer, Irrigation (All Provinces). 22. Chief Engineer, (All Barrages). 23. Chief Engineer, C.D.O. (Muzaffarabad). 24. Commissioner for Indus Waters, Lahore. 25. All other concerned. Flood Warning Dissemination
. 3. Chairman NDMA, Islamabad. 4. Chief Minister (All Provinces). 5. Secretary, Aviation Division, Islamabad. 6. Secretary, Ministry of Water & Power, Islamabad. 7. Secretary, Ministry of Information, Islamabad. 8. Chairman NHA, Islamabad. 9. Chief Secretary (All Provinces & AJK). 10. PDMA’S (D.G’S, All Provinces & AJK). 11. Administrator & Chief Secretary, Gilgit-Baltistan. 12. Chairman, Indus River System Authority, Islamabad. 13. Chairman, Federal Flood Commission, Islamabad. 14. Relief Commissioner, (All Provinces & A.J.K). 15. The Secretary General, Red Crescent, Islamabad. 16. Secretary, Irrigation Department, (All Provinces). 17. D.G. Engineers, Eng. Directorate GHQ, Rawalpindi 18. D.G. Relief, (All Provinces). 19. D.G. Emergency Relief Cell, Cabinet Division, Islamabad. 20. Chief Engineer, Mangla/Tarbela/Chashma. 21. Chief Engineer, Irrigation (All Provinces). 22. Chief Engineer, (All Barrages). 23. Chief Engineer, C.D.O. (Muzaffarabad). 24. Commissioner for Indus Waters, Lahore. 25. All other concerned. Flood Warning Dissemination.")
19
Managing Climate Extremes and Disasters in Asia: IPCC SREX Report Number of Disasters and damages due to weather and climate in recent past history

20
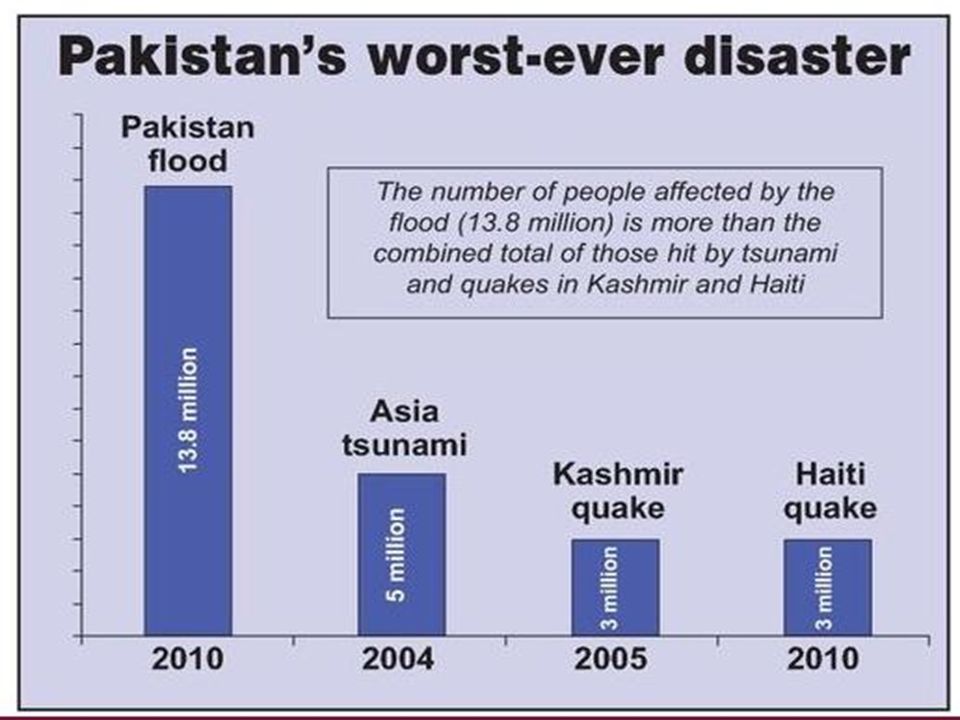
History of Climate related Disasters in Pakistan Pakistan Floods (1950, 1956, 1957, 1973, 1976, 1978, 1988, 1992, 1994, 2001, 2003, 2004, 2005, 2007, 2010, 2011, 2012, 2013, and 2014)Pakistan Floods (1950, 1956, 1957, 1973, 1976, 1978, 1988, 1992, 1994, 2001, 2003, 2004, 2005, 2007, 2010, 2011, 2012, 2013, and 2014) Pakistan Floods 2010: (Around 2000 people died and over 20 million affected)Pakistan Floods 2010: (Around 2000 people died and over 20 million affected) 2007 Cyclone Yemyin July 2007: 730 people died, some 350,000 people were displaced, 1.5m affected and more than 2 m livestock perished.2007 Cyclone Yemyin July 2007: 730 people died, some 350,000 people were displaced, 1.5m affected and more than 2 m livestock perished. Tropical cyclone Gonu (2007), Phet 2010, also proved devastating in the recent past history of PakistanTropical cyclone Gonu (2007), Phet 2010, also proved devastating in the recent past history of Pakistan 1998-2002 Drought: At least 1.2 million people in Balochistan were affected by drought, and over hundreds of people died, mostly because of dehydration, Millions of animals perished.1998-2002 Drought: At least 1.2 million people in Balochistan were affected by drought, and over hundreds of people died, mostly because of dehydration, Millions of animals perished.
, Phet 2010, also proved devastating in the recent past history of PakistanTropical cyclone Gonu (2007), Phet 2010, also proved devastating in the recent past history of Pakistan Drought: At least 1.2 million people in Balochistan were affected by drought, and over hundreds of people died, mostly because of dehydration, Millions of animals perished Drought: At least 1.2 million people in Balochistan were affected by drought, and over hundreds of people died, mostly because of dehydration, Millions of animals perished..")
21
Images of Pakistan Floods 2010-2014 Sindh:2011 KP 2010 Sindh 2011 Punjab 2012 Balochistan 2013 Punjab 2014

23
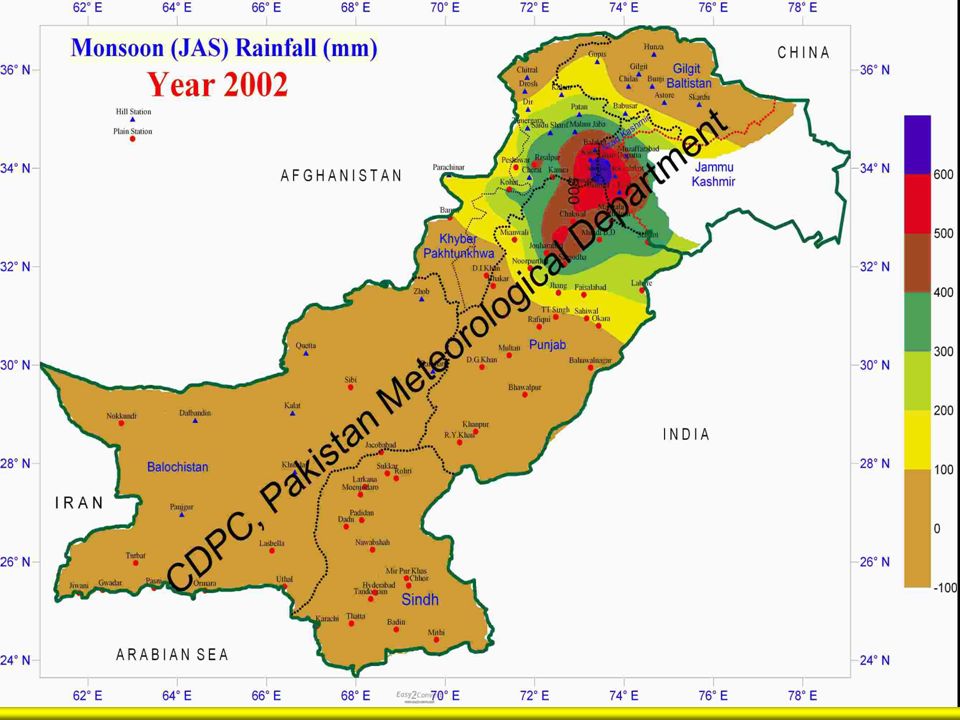
Extent of Monsoon Currents Moisture Flux

25
25 Pakistan’s Water Resources - Facts IRS Inflows (1976 to 2010) Reservoir Capacity (Mangla + Chashma + Tarbela) Original : 18.4 MAF(≈ 12.6 % of Average Annual Flows) Year 2001: 14.1 MAF(≈ 9.6 % of Average Annual Flows) Present : 15.45 MAF(≈ 10.53 % of Average Annual Flows) Relative Storage Capacity of some countries Pakistan30 Days (after Mangla Raising) India120 (1980s)-325 Days Egypt700 Days USA 900 Days AnnualIn Kharif ( Apr-Sep) In Rabi ( Oct-Mar) Average (1976 to 2010) 146.64 MAF82%18% Maximum (in 2010)248.45 MAF Minimum (in 2001-02) 98.51 MAF
 Reservoir Capacity (Mangla + Chashma + Tarbela) Original : 18.4 MAF(≈ 12.6 % of Average Annual Flows) Year 2001: 14.1 MAF(≈ 9.6 % of Average Annual Flows) Present : MAF(≈ % of Average Annual Flows) Relative Storage Capacity of some countries Pakistan30 Days (after Mangla Raising) India120 (1980s)-325 Days Egypt700 Days USA 900 Days AnnualIn Kharif ( Apr-Sep) In Rabi ( Oct-Mar) Average (1976 to 2010) MAF82%18% Maximum (in 2010) MAF Minimum (in ) MAF")
26
Pakistan has second highest Risk factor regarding floods after Bangladesh

27
CYCLONE - Another Threat THREATS by Changing Climate Climate Change - Seasonal Shifts - Glaciers Melting - Sea Level Rise - Drought - Extreme Weather Events Frequency/Intensity of Heat/Cold Waves Torrential Rains/Landslides Tropical Cyclones Societal Impacts Agriculture Energy Water Health Climate Change, caused by Natural and Human Activities, is now widely recognized as the major environmental problem facing the Planet Earth

28
Regions/Tracks of TC/Hurricanes/Typhoons 1901-2010 TyphoonsHurricanes Tropical Cyclones 80% NH 20% SH Equator

29
Frequency of Tropical Cyclones in Indian Ocean MayJunSepOctNov Bay of Bengal Cyclonic Storm 59354089114 Severe Cyc. Storm 425163863 Arabian Sea Cyclonic Storm 293542420 Severe Cyc. Storm 232721115

31
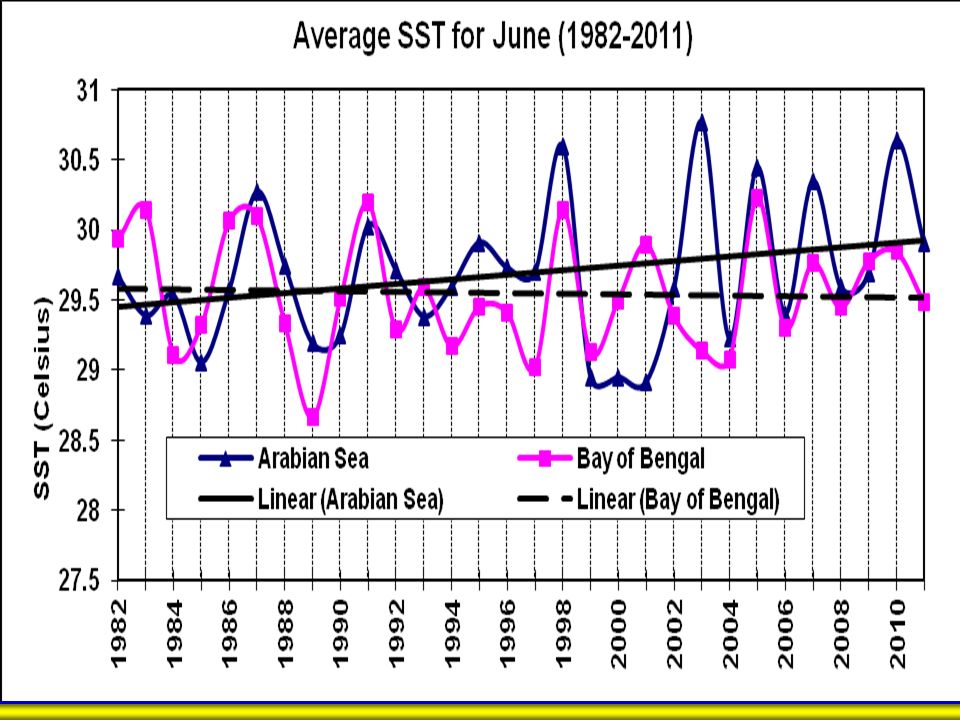
Comparison of Sea Surface Temperature for Bay of Bengal and Arabian Sea (2000 - 2014) Arabian sea is showing higher SST values compared to Bay of Bengal since 2000 BOB Arb Sea Frequency of Tropical Storms in Arabian Sea
 Arabian sea is showing higher SST values compared to Bay of Bengal since 2000 BOB Arb Sea Frequency of Tropical Storms in Arabian Sea")
32
Average Physical Exposure to Tropical Cyclones, assuming constant hazard, in thousand of people per year IPCC SREX Report’s Findings (Tropical Cyclones)
")
34
Jan Feb Snow Maxima is shifting towards February Snow Residency Period is Shrinking

35
Black Carbon Name of Glacier Length (km) AspectCarbon (ng/m2) Diameter (micron) Hinarchi17S224131 Hisper53NW161212 Minapin16N192401 Gutumi14W105203 Bualtar20NW63116
 AspectCarbon (ng/m2) Diameter (micron) Hinarchi17S Hisper53NW Minapin16N Gutumi14W Bualtar20NW63116")
36
Historical GLOF floods in Gilgit-Baltistan YearDateGlacierRiver 1929?Chung KhumdanShyok 1932?Chung KhumdanShyok 1973?BaturaHunza 1974?BaturaHunza 1977?Balt BareHunza 1978SeptemberDarkot/BaradosGilgit 19996-AugKhalti/GupisGilgit 200010-JunShimshalHunza 200027-JulKand/HusheIndus 20075-AprGhulkinHunza 20086-JanPassuHunza 20082-AprGhulkinHunza 200822-MayGhulkinHunza 200824-MayGhulkinHunza 200814/15 JuneGhulkinHunza 200926-MarGhulkinHunza David Archer GTZ/WAPDA August 2001, UNDP Report 2007, NARC Report 2008, Focus Humanitarian Assistance and Pamir times

37
Climate Projections for 21 st Century

38
Decadal Mean Precipitation (mm) Change RCP 4.5 Decadal Mean Precipitation (mm) Change RCP 4.5
 Change RCP 4.5 Decadal Mean Precipitation (mm) Change RCP 4.5")
39
Expected Change in Mean annual cycle of monthly temperature ( ◦ C) and rainfall (mm/day) compared with 1981-2010 Average
 and rainfall (mm/day) compared with Average")
40
CONCLUSION All indicators suggest that water cycle variability will be the greatest challenge in changing climate Too much water and too little water

41
Way Forward Improvement of Observation NetworkImprovement of Observation Network Forests can reverse the climate change process even under global warmingForests can reverse the climate change process even under global warming Enhance water storageEnhance water storage Coordination among Research GroupsCoordination among Research Groups Establishment of Water Environment ForumEstablishment of Water Environment Forum Scientific research on future of water resources must become part of policy formulationScientific research on future of water resources must become part of policy formulation Mobilization of AcademiaMobilization of Academia

42
Thank You

Similar presentations


 Beijing, China 08-10 April,2013.>")


 in Pakistan & Super Flood in Pakistan-2010.>")
 The annual mean rainfall exhibits increasing trends in Bangladesh. Decadal rain anomalies are above long term averages since.>")


