Download presentation
Presentation is loading. Please wait.

2
Ocean Productivity

3
Kelp Forest Macroalgae: 3% of Ocean Photosynthesis www.underwaterplanet.com

4
Phytoplankton Phytoplankton: 97% of Ocean Photosynthesis

5
Phytoplankton spines: increase in surface for higher floatability Silicoflagellates

6
Ecosystem Productivity (Annual net productivity)
")
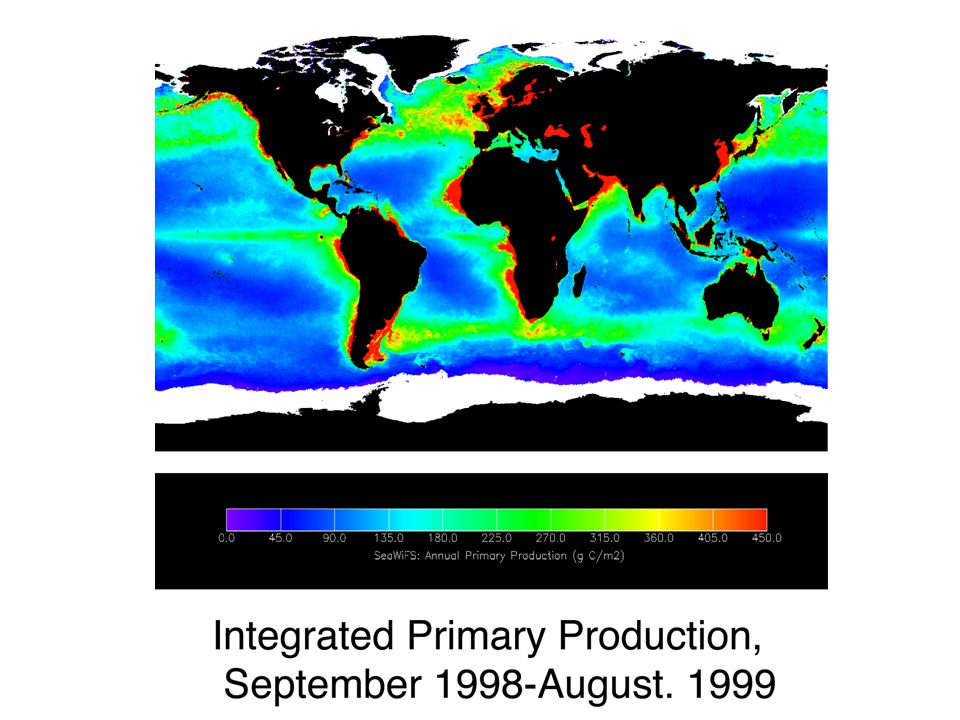
7
Ocean primary productivity

8
The Microbial Revolution – 1970s Discovery of tiny photosynthetic microbes - Gyres Cyanobacteria (Blue Green Algae) - e.g. Prochlorococcus Source of Incredible Marine Natural Products - Make up ½ of phytoplankton in Oceans! – A Microbial Revolution Annually new discoveries of Microbes Alter the way We – Think about Ocean/systems

9
Major Types of Plankton Pico phytoplankton ≤ 2 uM - Cyanobacteria (prochlorococcus,chlorophyll-b) (synechococcus, chlorophyll-a) Nano phytoplankton ≤ 20 uM – Small Diatoms, cocolithophores Micro phytoplankton ≤ 200 uM - Large Diatoms, dinoflagellates, foraminifera, radiolarians.
 (synechococcus, chlorophyll-a) Nano phytoplankton ≤ 20 uM – Small Diatoms, cocolithophores Micro phytoplankton ≤ 200 uM - Large Diatoms, dinoflagellates, foraminifera, radiolarians.")
10
Major Types of Plankton Absorb UV light at different Wavelengths

11
– What is Primary Production? The rate of production of Organic matter by phytoplankton or photo autotrophs What are some examples of algae producers besides phytoplankton (aka macro algae)? – Macroalgae (Kelp) – Zooxanthellae (Coral) – True Marine Plants » Mangroves » Seagrass » Marsh Plants
. – Macroalgae (Kelp) – Zooxanthellae (Coral) – True Marine Plants » Mangroves » Seagrass » Marsh Plants.")
12
Primary Production(aka - a Bloom) – Light Reactions (Sunlight) -Photosynthesis – Dark Reactions (convert E from light w/ CO2 sugars) – CO 2 + H 2 O + light C 6 H 12 O + H 2 O + O 2 – 106 CO 2 + 122 H 2 O + 16 HNO 3 + 1 H 3 PO 4 106 C 6 H 12 O + H 2 O 16 NH 3 + 1 H 3 PO 4 + 138 O 2 – THE REVERSE (grazing) RESPIRATION Zooplakton, Fish, Whales, Humans Eat e.g.Sugar spit out CO 2 (Sugar/Carbs)
 – Light Reactions (Sunlight) -Photosynthesis – Dark Reactions (convert E from light w/ CO2 sugars) – CO 2 + H 2 O + light C 6 H 12 O + H 2 O + O 2 – 106 CO H 2 O + 16 HNO H 3 PO 4 106 C 6 H 12 O + H 2 O 16 NH H 3 PO O 2 – THE REVERSE (grazing) RESPIRATION Zooplakton, Fish, Whales, Humans Eat e.g.Sugar spit out CO 2 (Sugar/Carbs)")
13
From Studying Cell Counts to Satellites – Many ways exist to estimate primary production

14
Plant Biomass – How much phytoplankton is there (mg Chl/m 3 ) or (μg Chl/liter) Productivity – A rate of how much carbon is produced per time g Carbon / m 3 / day – GROSS Productivity = Carbon fixed through Photosynthesis per time – NET Productivity = Gross Prod - Respiration Measuring Productivity
 or (μg Chl/liter) Productivity – A rate of how much carbon is produced per time g Carbon / m 3 / day – GROSS Productivity = Carbon fixed through Photosynthesis per time – NET Productivity = Gross Prod - Respiration Measuring Productivity")
15
Standing Crop: Plant Biomass

16
Grass clippings after 1 week: Productivity

17
Light and Dark Bottle Method; Measure dissolved oxygen in the Bottles (before and after “incubation”)
")
18
Productivity measurements with DEPTH

19
– Redfield Ratio The optimum ratio of Macronutrients for Phytoplankton to bloom: – What is the ratio?Carbon Nitrogen Phosphorous – C 106 N 16 P 1

20
Fig. 13.3

22
Figure 13.8

23
Vertical distribution of Nutrients

24
Atlantic & Pacific nutrient distribution

25
Controls on Primary Production Light Nutrients Zooplankton grazing Other?

26
Controls of Primary Production – Photosynthetic Light Limitation

27
Controls of Primary Production – Dissolved Inorganic Nutrients

28
Controls of Primary Production – Marine Bacteria and Nutrients Reminerilization (recycling)
")
30
Productivity and depth

31
Photic Zone and Compensation Depth

32
Controls of Primary Production –Vertical Mixing c c

Similar presentations


 of phytoplankton can be measured directly by O.>")


 –Photosynthesis –Chemosynthesis CO.>")


 Gross (total) production = total C fixed Net production = C remaining after respiration Standing.>")


