Download presentation
Presentation is loading. Please wait.

1
Production visibility: KPI’s in Real-time BASF – The Chemical Company
Thank you for joining me today. I am Sharon Brown from Wonderware and am presenting a client in the Eastern Cape that was unfortunately called away to important meetings and could not join us. The study is about PROODUCTION VISIBILITY BY PROVIDING Real-time Key Performance Indicators to the users. Sharon Brown Wonderware S.A.

2
Introduction BASF - The Chemical Company “We were able to reduce scrap, downtime and smoothed change-overs by the increase in total visibility of our production process” Quote “We were able to reduce scrap, downtime and smoothed change-overs by the increase in total visibility of our production process” from BASF:

3
Introduction Agenda Project Solution Benefits Considerations Summary
Agenda - Introduction

4
BASF – Chemical Company
International Company Diversified foot print around the world Chemicals are it main business In South Africa, it includes plastics, polyurethanes, agricultural, leather, chemical and automotive sectors. BASF Port Elizabeth Catalytic converter industry One of the highest users of precious metals for the automotive sector Roughly 39% market share, which represents roughly 5.5 million parts in 2008. Foot print Chemicals are it main business BASF Port Elizabeth Catalytic converter industry A petrol converter consistent of a single converter, as the main aim is to “catch” the carbon emissions. A diesel converter Mixing slurry and coating process Process involved is a top down process, beginning with slurry manufacturing on-site. Involves mixing various acids, precious metals, di waters and various stabilisers, in order to make the mix required by each customer. Each customer has different specifications for their parts. Roughly 300 slurry types. Mixing of slurry and subsequent QC and QA testing and approval occurs before production coating can commence. Reason is primarily weighted in the favour of managing waste, and ensuring the slurries are correctly made, as waste of precious metal is expensive! Production is done on the bottom level, where various types of machines are used depending on the technology which is being coated. BASF is one of the highest users of precious metals for the automotive sector BASF has roughly 39% amount of market share, which represents roughly 5.5 million parts in 2008 4. roughly 39% amount of market

5
Process Background Slurry Manufacturing Q/A Production Mixing
Customer / Part Specific Slurry are mixed Q/A Quality checks Manage waste Production Coating lines Various machines – client chosen technology SLURRY AREA MIXING AREA LABORATORY / QA Slurry manufacturing on-site. This involves mixing various acids, precious metals, di waters and various stabilisers, in order to make the mix required by each customer. Each customer has different specifications for their parts, and varies in pm content, volume etc. Roughly 300 slurry types exist. Mixing of slurry and subsequent QC and QA testing and approval occurs before production coating can commence. Reason is primarily weighted in the favour of managing waste, and ensuring the slurries are correctly made, as waste of precious metal is expensive! Production is done on the bottom level, where various types of machines are used depending on the technology which is being coated. For instance, the catalyst for a Renault, compared to diesel 4x4 varies in both coating technique, to physical size, and emission type, and thus the type of machine used can be very different. A petrol converter consistent of a single converter, as the main aim is to “catch” the carbon emissions. A diesel converter has two components, the first being similar to a petrol catalyst, to catch the emissions, the second converter being much larger, to catch the soot emissions. The soot converter flushes itself with the back burn process. COATING LINES PRODUCTION AREA

6
Introduction Agenda Project Solution Benefits Considerations Summary

7
Topology - Before new installation
Network TCP/IP (LAN) MIXING AREA PRODUCTION AREA SLURRY AREA LAB / QA InTouch SCADA LIMS – ORACLE DB MS SQL Server InTouch 22 Stations Appr I/O 25 K Historian 10 A/F Clients Siemens (S7) on Ethernet Topology
 MIXING AREA. PRODUCTION AREA. SLURRY AREA. LAB / QA. InTouch SCADA. LIMS – ORACLE DB. MS SQL Server. InTouch. 22 Stations. Appr I/O. 25 K Historian. 10 A/F Clients. Siemens (S7) on. Ethernet. Topology.")
8
No real-time visibility of the process.
Key Requirements No real-time visibility of the process. Equipment Status Process Status Maintenance Status Lack of communication between production and maintenance staff due to lack of information. No access to key performance indicators Production variables Production Rate / Figures key requirements No real-time visibility of the process. Equipment Status – Downtime of equipment Process Status – where are they in the production process Maintenance Status Lack of communication between production and maintenance staff due to lack of information. No access to key performance indicators Production variables Production Rate / Figures

9
Key Requirements More central monitoring of production flow
The information was only available at SCADA level at the machine Required access to production reports by management More central monitoring of production flow The information was only available at SCADA level at the machine It was only the operator that had access to production and machine statusses, alarms etc. Data availability to both maintenance and production Any problems occurring on the lines, had to be carried over by the operators on the line Always after-the-fact and unclear who’s responsibility it is. Required access to production reports by management There were no reporting automatic reporting structure in place. No summarized data on a production run that included both production, Q&A and maintenance related figures.

10
Project Goals - Technical
Install a central repository of real-time data that links the current SCADA’s, production databases and LIMS data. Capitalize on already available infrastructure of Wonderware SCADA and Historian Make the operation more visually representative to all involved using a Web interface Install a central repository of real-time data that links the current SCADA’s, production databases and LIMS data. Capitalize on already available infrastructure of Wonderware SCADA and Historian Make the operation more visually representative to all involved using a Web interface

11
Project Goals - Business
Due to the nature of the business, the raw material are of extreme high value i.e. precious metals – platinum Main goal is to keep scrap levels as low as possible and minimize rework and production cost. How? Due to the nature of the business, the raw material are of extreme high value i.e. precious metals – platinum Main goal is to keep minimize rework, scrap levels as low as possible and minimize production cost. How?

12
How to realize these Goals
Need to reduce downtime Anticipate production problems Departments to take joint responsibility for critical dependencies Reduce change-over times Improve overall coating rate Need to reduce downtime Re-act quicker to problems Anticipate production problems Departments to take joint responsibility for critical dependencies i.e. make it more visible in terms of responsibility Reduce change over time

13
Existing Wonderware install base.
Why Wonderware Existing Wonderware install base. InTouch SCADA network of appr I/O Wonderware Historian 2K5 and Active Factory clients BASF wanted to utilise their present investment Scalability of the Wonderware solution

14
Why Wonderware Information Server from Wonderware (WIS) provided a solution Good working relationship has been built up with the supplier Top quality training is provided

15
Project Solution Solution aimed at making the information more centrally accessible Control Room environment Web Clients for managers Displaying the coating, slurry and operation information Production Data Downtime Machine and process Status Bringing maintenance, production and process engineering closer in terms of their separate operations

16
Implementation - Prerequisites
First step Involve production and maintenance resources to determine the information needed Made each person Responsible for the availability of the data by Training Do own modifications on the SCADA Involvement Determine the information needed, how to display it, where to get it from Responsible availability of the data by providing them with training let them make the changes on the SCADA themselves. Taking ownership of the system

17
How it was implemented Installed the Wonderware Information Server (WIS) Gather data from various systems in the plant Both Wonderware and other sources. Control room set up with multiple large LCD displays Both production and maintenance used. Build web based reports for management Project took 3 months Wonderware Portal was not yet installed Data was sources from InTouch, LIMS (Oracle DB), a number of MS SQL databases where was logged from InTouch as well as data from the Historian The control room provides a holistic picture of the complete plant Accept for the real-time information, reports were built using Reporting Services and published using WIS From start to finish. The most consuming part was deciding what data we want to see and modifications had to be made to PLC’s, SCADA and the Historian to make it possible. Each plant section was responsible for their own data.
, a number of MS SQL databases where was logged from InTouch as well as data from the Historian. The control room provides a holistic picture of the complete plant. Accept for the real-time information, reports were built using Reporting Services and published using WIS. From start to finish. The most consuming part was deciding what data we want to see and modifications had to be made to PLC’s, SCADA and the Historian to make it possible. Each plant section was responsible for their own data.")
18
Data acquired – Multiple Sources
ACTIVE FACTORY / WE CLIENTS LIMS Oracle DB SCADA Systems InTouch Historian / Information Server Schematic on Data flow SLURRY MANUFACTURING MS SQL Server 2005 COATING LINES MS SQL Server 2005 CONTROL ROOM

19
Topology Network TCP/IP (LAN) Active Factory Clients SLURRY AREA
CONTROL ROOM Wonderware Historian MS SQL Server Web Portal – Information Server WIS Clients Active Factory Clients SLURRY AREA InTouch SCADA Plant PLC’s MS SQL Server MIXING AREA LAB / QA InTouch SCADA LIMS – ORACLE DB Plant PLC’s Topology PRODUCTION AREA InTouch SCADA Plant PLC’s

20
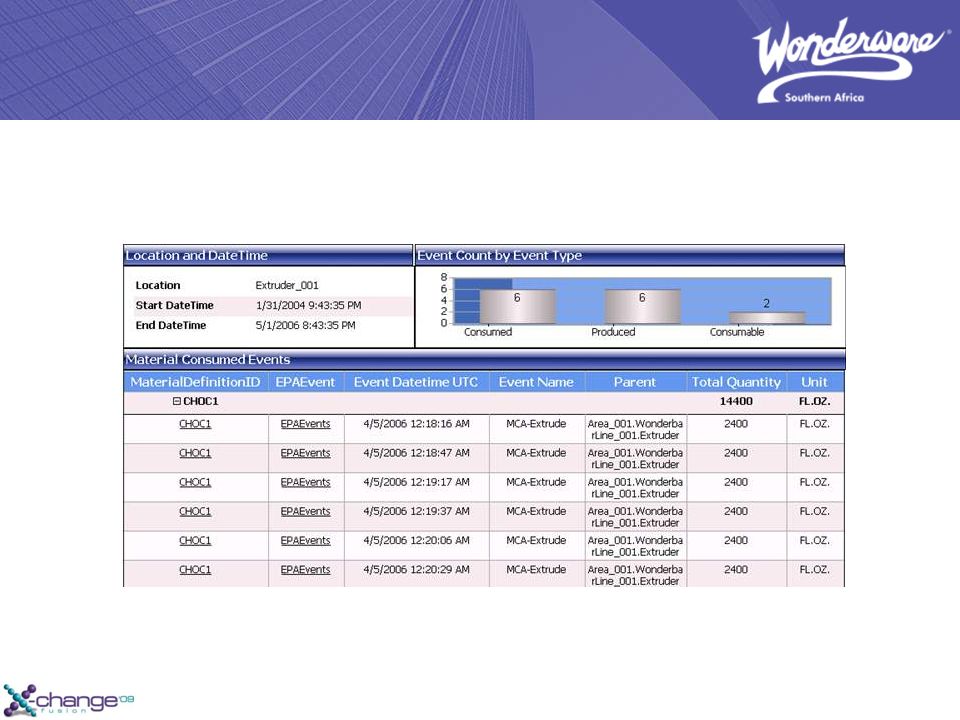
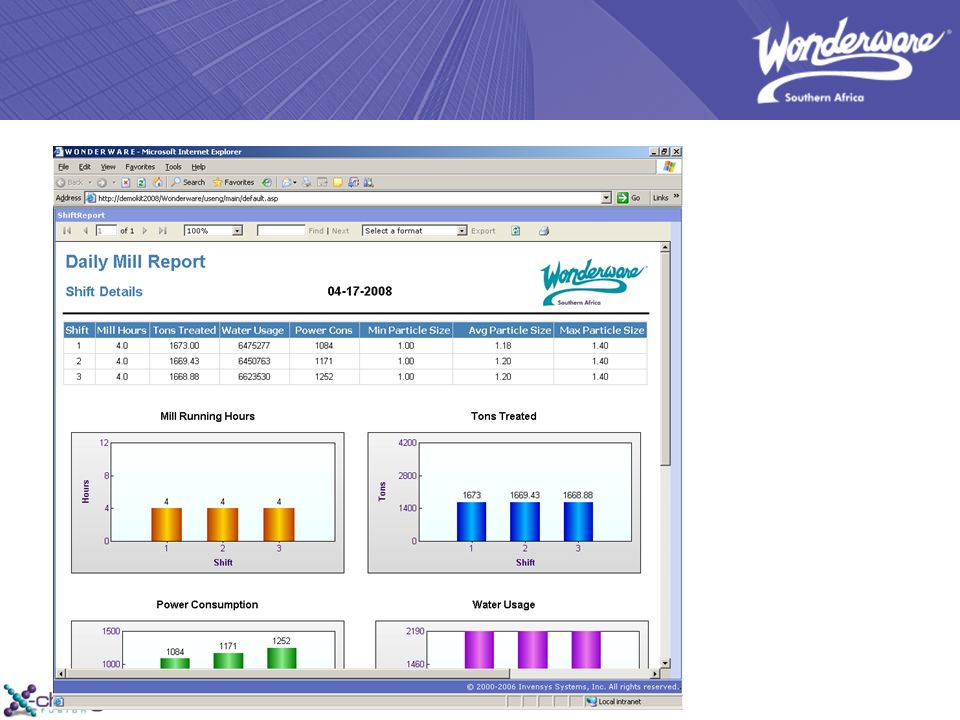
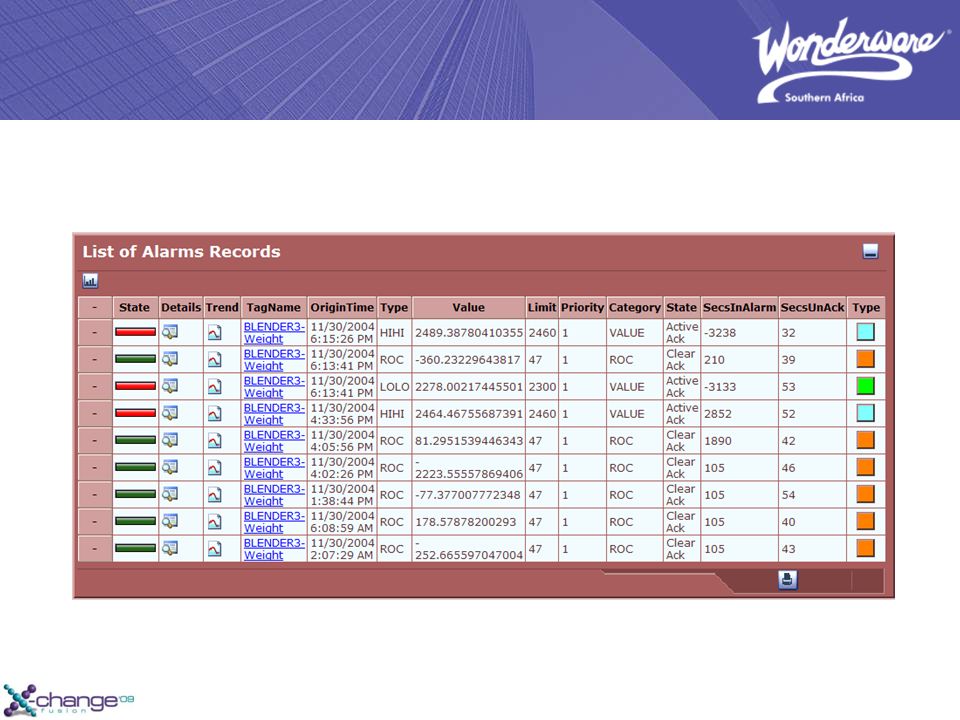
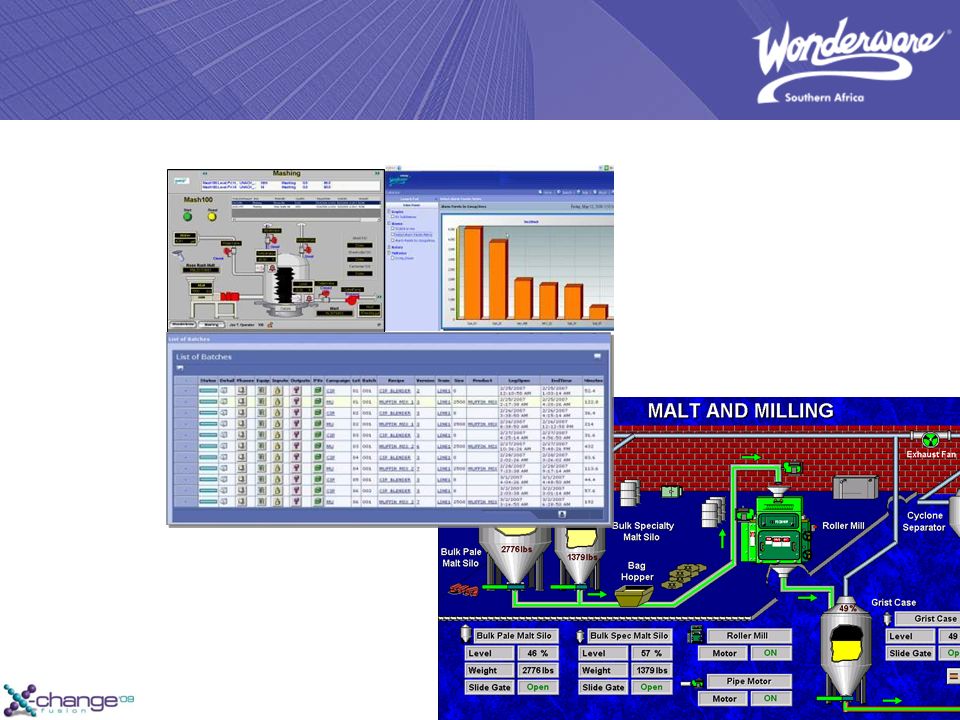
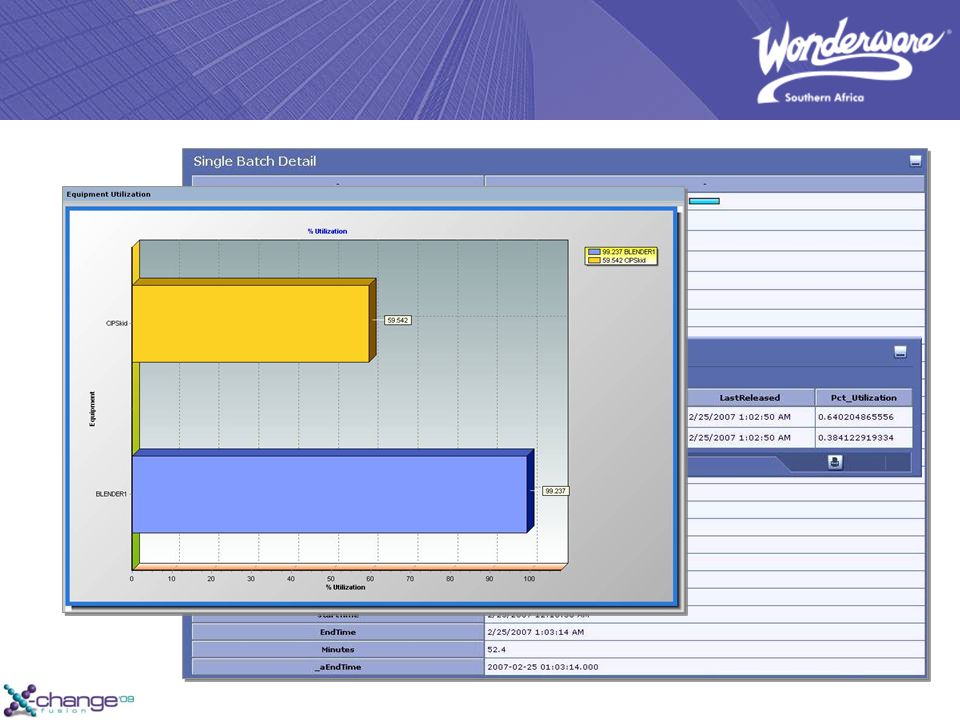
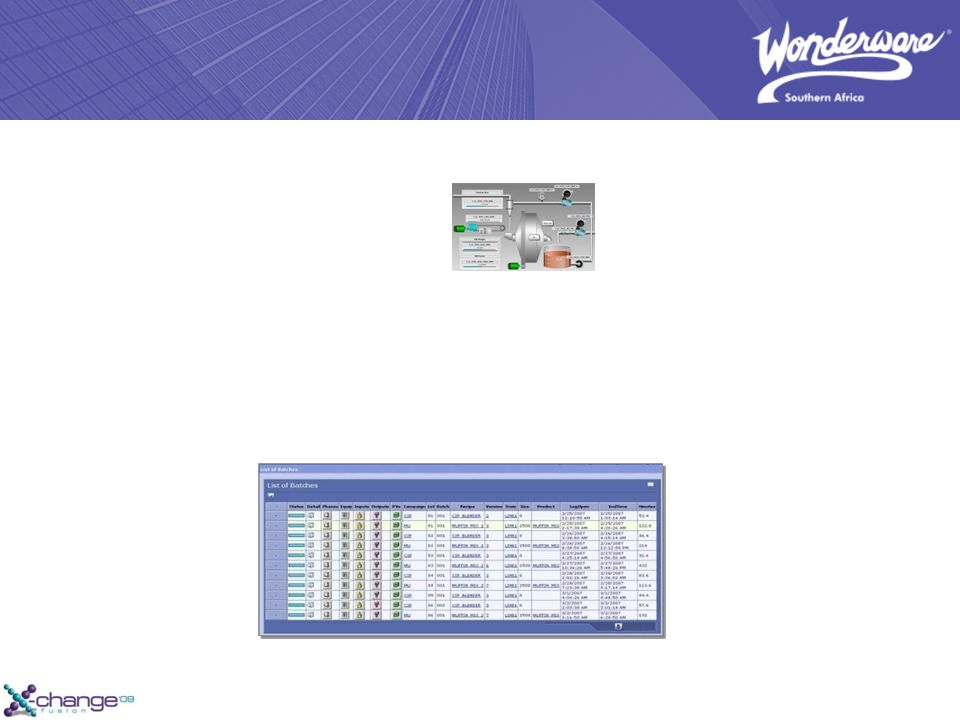
Control Room Wonderware Information Server (WIS) Clients Multi Views
Trends and Charts Historian Average rates of the coating. Real-time Graphics InTouch KPI’s Downtime Status Alarm Conditions Data charting Table Weaver - Interactive, drill through data tables Drill-down Reports Table Weaver Collaborating Data from different sources

21
Introduction Agenda Project Solution Benefits Considerations Summary
Agenda - Benefits

22
Benefits / Goals Achieved
Initial Goal Comment Central Repository of real-time data Control Room with real-time data display from various system Capitalize on existing Wonderware installation No additional cost for software was incurred Provide value to all plant sections to improve production/maintenance Factory sections took ownership – previously under utilized SCADA network has become a crucial resource and tool. Reduce downtime, scrap levels and as a result production cost Reduction of 2,5 hours downtime per week as a result less scrap and an increase in production Improve Average Coating Rate Coating rates have improved – no percentage improvement available yet due to changes in processes. Busy analyzing new average rates. Initial Goal End Result Central repository of real-time data Control Room with real-time data display from various system Capitalize on already available Wonderware installation No additional cost for software was incurred Let all plant sections utilize the system to improve production/maintenance Production and maintenance took ownership – previously under utilized SCADA network has become a crucial resource and tool. Reduce downtime, scrap levels and as a result production cost Reduction of 2,5 hours downtime per week as a result less scrap and an increase in production

23
Introduction Agenda Project Solution Benefits Considerations Summary
Agenda - Considerations

24
We started by doing training first
Considerations Infrastructure (PLC network and LAN) was in place which made it easier to gather the data We started by doing training first Involving maintenance, production and process engineering made the project run smoother Infrastructure (PLC network and LAN) was in place which made it easier to gather the data We started by doing training first Good decision Can maintain and make changes ourselves Involving maintenance, production and process engineering made the project run smoother Correct information was made available from the beginning
 was in place which made it easier to gather the data. We started by doing training first. Involving maintenance, production and process engineering made the project run smoother. Infrastructure (PLC network and LAN) was in place which made it easier to gather the data. We started by doing training first. Good decision. Can maintain and make changes ourselves. Involving maintenance, production and process engineering made the project run smoother. Correct information was made available from the beginning.")
25
Introduction Agenda Project Solution Benefits Considerations Summary
Agenda - Summary

26
In Conclusion Richard Mangold Service Platform Manager “ The Wonderware package is very broad, the more training and awareness, the more it can be utilized becomes a true asset to the company.” “Attend more sessions, breakfasts and road shows – the benefits are there!” Richard Mangold Service Platform Manager “ The Wonderware package is very broad, the more training and awareness you can get from the distributors, the more it can be utilized to become a true asset to the company.” Attend more sessions, breakfasts and roadshows – the benefits are there!”

27
Thank you for attending
Questions Thank you for attending Thank you for attending

28
Graphics Library

Similar presentations


 Ltd.>")


 Overall Equipment Effectivity.>")


