Download presentation
Presentation is loading. Please wait.

1
Disruptive Demographics: Challenges and Opportunities for the Philanthropic Community October 2012

2
OVERVIEW Demographic Trends Challenges & Opportunities Discussion October 20122

3
what October 2012 CENSUS 2010 will REVEAL October 20123

4
6 DISRUPTIVE TRENDS The South Rises – Again The Browning of America Marrying Out is “In” The Silver Tsunami is About Hit The End of Men? Cooling Water from Grandma’s Well… and Grandpa’s Too! October 20124

5
The South Continues To Rise The South Continues To Rise...Again! October 20125

6
South’s Share of U.S. Net Population Growth, Selected Years, 1910-2010 YearsU.S. Absolute Population Change South’s Absolute Population Change South’s Share of Change 1910-193030,974,129 8,468,30327% 1930-195028,123,138 9,339,45533% 1950-197051,886,12815,598,27930% 1970-199045,497,94722,650,56350% 1990-201060,035,66529,104,81449%

7
U.S. POPULATION CHANGE BY REGION, 2000-2010 Region 2010 Population Absolute Population Change, 2000-2010 Percent Population Change, 2000-2010 U.S.309,050,81626,884,9729.5% Northeast55,417,3111,753,9783.3% Midwest66,972,8872,480,9983.0% South114,555,74414,318,92414.3% West72,256,1838,774,85213.8% North Carolina9,535,4831,486,17018.5%

8
SHARES OF NET POPULATION GROWTH BY REGION, 2000-2010 Region Absolute Population ChangePercent of Total UNITED STATES26,884,972100.0 NORTHEAST1,753,978 6.0 MIDWEST2,480,998 9.0 SOUTH14,318,92453.0 WEST8,774,85232.0

9
NET MIGRATION TRENDS, 2000-2008 NortheastMidwestSouthWest Total-1,032-2,008+2,287+46 Black-346-71+376+41 Hispanic-292-109+520-117 Elderly-115+42+97-27 Foreign born -147-3+145+3 October 20129 = Net Import= Net Export

10
GROSS AND NET MIGRATION FOR THE SOUTH, 2004-2010 The Region DomesticForeign YearsInOutNetInOutNet 2004-20074,125,0963,470,431654,665268,619132,382136,237 2007-20103,874,4143,477,899396,525232,501132,201100,300 Florida DomesticForeign YearsInOutNetInOutNet 2004-2007812,053630,051182,00241,74524,10817,637 2007-2010654,931668,087-13,15633,09532,0941,001

11
State Share of South’s Net Growth, 2000-2010 Region/StateAbsolute ChangeState’s Share The South14,318,924100.0% Texas 4,293,741 30.0% Florida 2,818,932 19.7% Georgia 1,501,200 10.5% North Carolina 1,486,170 10.4% Other Southern States 4,218,881 29.4% October 201211

12
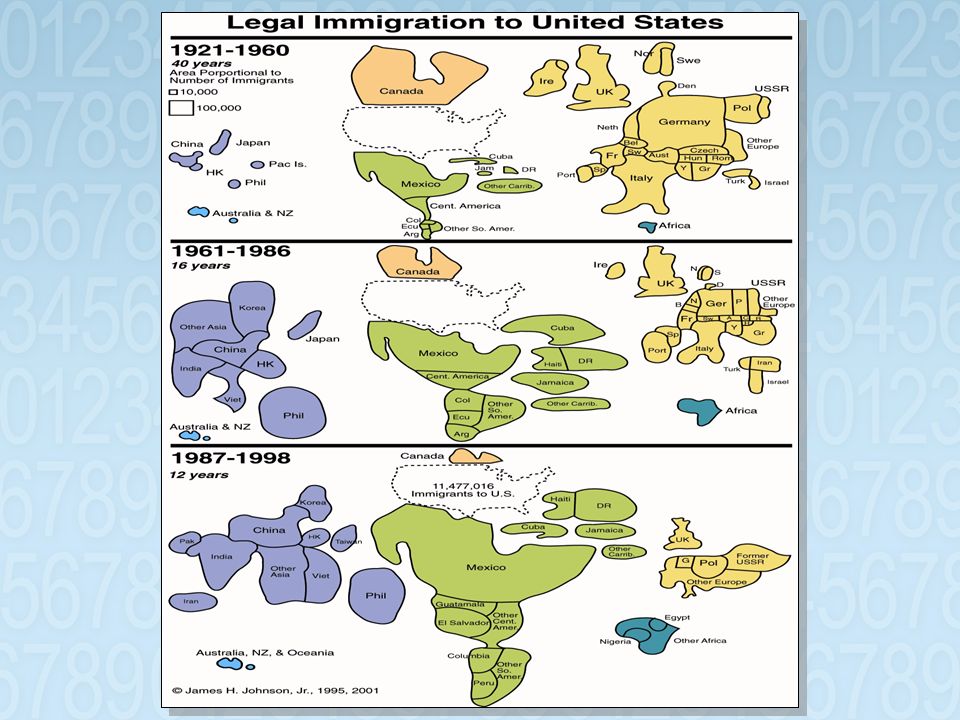
THE “BROWNING” OF AMERICA October 201212

14
THE NUMBERS Legal Immigrants: 1920-1961: 206,000 annually 1961-1992: 561,000 annually 1993-1998: 800,654 annually 1999-2004: 879,400 annually 2005-2008: 1,137,000 annually Refugees, Parolees, Asylees 1961-1993: 2.1 million (65,000 annually) 1994-1998: 428,361 (85,672 annually) 1999-2004: 487,386 (81,231 annually) 2005-2008: 203,642 (75,661 annually) Illegal Immigrants: 300,000 to 400,000 annually over the past two decades Three million granted amnesty in 1986 2.7 million illegal immigrants remained in U.S. after 1986 reforms October 1996: INS estimated that there were 5 million illegal immigrants in the U.S. August 2005: Illegal population range from 7 to 15 million.

15
NON-IMMIGRANTS ADMITTED TO UNITED STATES, SELECTED YEARS, 1981-2008 YearAll ClassesExchange Visitors Academic & Vocational Students 198111,756,903108,023 (1%)271,861 (2%) 19859,539,880141,213 (1%)285,496 (3%) 199017,574,055214,644 (1%)355,207 (2%) 199522,640,540241,364 (1%)395,480 (2%) 200033,690,082351,743 (1%)699,953 (2%) 200132,824,088389,435 (1%)741,921 (2%) 200227,907,139370,176 (1%)687,506 (2%) 200430,781,330360,777(1%)656,373(2%) 200839,381,928506,138 (1%)917,373(2%)
271,861 (2%) 19859,539,880141,213 (1%)285,496 (3%) ,574,055214,644 (1%)355,207 (2%) ,640,540241,364 (1%)395,480 (2%) ,690,082351,743 (1%)699,953 (2%) ,824,088389,435 (1%)741,921 (2%) ,907,139370,176 (1%)687,506 (2%) ,781,330360,777(1%)656,373(2%) ,381,928506,138 (1%)917,373(2%)")
17
IMMIGRATION POPULATION, 1900-2007 Source: Center for Immigration Studies; U.S. Census Bureau, Current Population Survey

18
U.S. POPULATION CHANGE BY RACE & ETHNICITY, 2000-2009 Race 2009 Population Absolute Change 2000 – 2009 Percentage Change 2000 - 2009 Total307,806,55024,834,5398.8 Non-Hispanic258,587,22612,057,6484.9 White199,851,2404,088,4482.1 Black37,681,5443,276,6619.5 AI/AN2,360,807256,56412.2 Asian Asian13,686,0833,233,41730.9 NH/PI NH/PI448,51079,26021.5 2 or More Races 2 or More Races4,559,0421,123,29832.7 Hispanic48,419,32412,776,94535.8 October 201218

19
SHARES OF NET POPULATION GROWTH, 2000-2009 Race Absolute Change 2000 - 2009 Percent of Total Total24,834,539100 Non-Hispanic12,057,64848.6 White4,088,44816.5 Black3,276,66113.4 American Indian256,5641.0 Asian Asian3,233,41713.0 Native Hawaiian Native Hawaiian79,2600.3 Two or More Races Two or More Races1,123,2984.5 Hispanic12,776,94551.4 October 201219

20
MEDIAN AGE OF U.S. POPULATION BY RACE, HISPANIC ORIGIN & GENDER, 2009 RaceTotalMaleFemale United States36.835.438.2 White Alone38.337.039.6 White, Non-Hispanic41.239.942.6 Black Alone31.329.433.3 AI/AN Alone29.529.030.2 Asian Alone 33.632.634.6 NH/PI Alone 29.929.530.3 Two or More Races 19.718.920.5 Hispanic27.4 27.5 October 201220

21
TOTAL FERTILITY RATES OF U.S. WOMEN BY RACE/ETHNICITY, 2007 Race/EthnicityTotal Fertility Rate Hispanic2.99 Non-Hispanic White1.87 Blacks2.13 Asian2.04 Native American1.86 October 201221 Source: Johnson and Lichter (2010)
.")
22
RELATIVE DISTRIBUTION OF U.S. BIRTHS BY RACE / ETHNICITY Race/Ethnicity199020082011 White66%50%49.6% Blacks17%16%15.0% Hispanics15%26%26.0% Other2%8%9.4% Source: Johnson and Lichter (2010); Tavernise (2011).
; Tavernise (2011)..")
23
RELATIVE DISTRIBUTION OF U.S. POPULATION BY RACE / ETHNICITY Race/Ethnicity20052050 White67%47% Blacks12.8%13% Hispanics14%29% Asian5%9% October 201223 Source: Pew Research Center, 2008 *projected.

24
is “In” Marrying Out October 201224

25
INTERMARRIAGE TREND, 1980-2008 % Married Someone of a Different Race/Ethnicity October 201225

26
EDUCATION & INTERMARRIAGE % of Newlyweds Who Married Someone of a Different Race/Ethnicity, 2008 October 201226

27
INTERMARRIAGE TYPES Newly Married Couples in 2008 October 201227

28
INTERMARRIAGE RATES BY RACE & ETHNICITY % of Newlyweds Who Married Someone of a Different Race/Ethnicity, 2008 October 201228

29
THE SILVER TSUNAMI October 201229

30
U.S. POPULATION CHANGE BY AGE, 2000-2009 Age2009 Absolute Change 2000 - 2009 Percentage Change 2000 - 2009 <25104,960,2505,258,4925.3 25-4484,096,278-1,898,345-2.2 45-6479,379,43916,977,56727.2 65+39,570,5904,496,88612.8 TOTAL307,006,55024,834,5938.8 October 201230

31
U.S. POPULATION TURNING 50, 55, 62, AND 65 YEARS OF AGE, (2007-2015) Age 50 Age 55 Age 62 Age 65 Average Number/Day12,34411,5419,2218,032 Average Number/Minute8.68.06.45.6 October 201231
 Age 50 Age 55 Age 62 Age 65 Average Number/Day12,34411,5419,2218,032 Average Number/Minute October")
32
THE GREYING OF AMERICA U.S. Census Projections October 201232

33
ABSOLUTE AND PERCENT CHANGE IN U.S. POPULATION BY AGE Age20052050% Change Total29643850.0 0-177310239.7 18-6418625537.1 65+3781118.9 October 201233

34
OLDER WORKERS IN U.S. WORKFORCE YEAR Age 65 or Older Age 75 or Older 199811.9%4.7% 200816.8%7.3% October 201234

35
DEPENDENCY RATIOS IN THE AMERICAN SOUTH Source: Census 2010

36
DEPENDENCY RATES FOR SELECTED SOUTHERN STATES, 2006-2010 Dependency Rate Georgia 67.4 Counties with Population Decline (31)100.4 Counties Growing 0.1-10% (44)75.2 Counties Growing 10% or more (84)62.6 Dependency Rate North Carolina 68.7 Tier 1 90.5 Tier 2 71.3 Tier 3 56.6 Dependency Rate Alabama 80.9 5 Counties with Greatest % Loss 152.5 5 Counties with Greatest % Gain 67.1
100.4 Counties Growing % (44)75.2 Counties Growing 10% or more (84)62.6 Dependency Rate North Carolina 68.7 Tier Tier Tier Dependency Rate Alabama Counties with Greatest % Loss Counties with Greatest % Gain 67.1")
37
The End of Men? October 201237

38
FEMALE WORKFORCE REPRESENTATION October 201238

39
The Plight of Men Today, three times as many men of working age do not work at all compared to 1969. Selective male withdrawal from labor market—rising non- employment due largely to skills mismatches, disabilities & incarceration. The percentage of prime-aged men receiving disability insurance doubled between 1970 (2.4%) and 2009 (4.8%). Since 1969 median wage of the American male has declined by almost $13,000 after accounting for inflation. After peaking in 1977, male college completion rates have barely changed over the past 35 years.
 and 2009 (4.8%). Since 1969 median wage of the American male has declined by almost $13,000 after accounting for inflation. After peaking in 1977, male college completion rates have barely changed over the past 35 years..")
40
COLLEGE CLASS OF 2010 DEGREEMALEFEMALEDIFFERENCE Associate’s293,000486,000193,000 Bachelor’s702,000946,000244,000 Master’s257,000391,000134,000 Professional46,80046,400-400 Doctor’s31,50032,9001,400 TOTAL1,330,3001,902,300572,000 October 201240

41
October 201241

42
Jobs Lost/Gained by Gender During 2007 (Q4) – 2009 (Q3) Recession IndustryWomenMen Construction -106,000-1,300,000 Manufacturing -106,000-1,900,000 Healthcare +451,800 +118,100 Government +176,000 +12,000 Total-1,700,000-4,700,000 October 201242
 – 2009 (Q3) Recession IndustryWomenMen Construction -106,000-1,300,000 Manufacturing -106,000-1,900,000 Healthcare +451, ,100 Government +176, ,000 Total-1,700,000-4,700,000 October")
43
Cooling Waters From Grandma’s Well And Grandpa’s Too! October 201243

44
Children Living in Non-Grandparent and Grandparent Households, 2001-2010 Household TypeAbsolute Number 2010 Absolute Change 2001-2010 Percent Change 2001-2010 All74,7182,712 3.8 No Grandparents67,209 917 1.4 Both Grandparents 2,610 77141.9 Grandmother Only 1,922 164 9.3 Grandfather Only 318 7128.7 October 201244

45
Children Living in Non-Grandparent and Grandparent-Headed Households by Presence of Parents, 2010 Household Type All Children (in thousands) Living with Both Parents Living with Mother Only Living with Father Only Living with Neither parent All74,71869.3%23.1%3.4%4.0% No Grandparents 67,20973.4%21.2%3.3%2.1% Both Grandparents 2,61018.1%40.6%5.2%36.1% Grandmother Only 1,92213.8%48.4%4.5%33.2% Grandfather Only 31826.4%45.9%4.4%23.6% October 201245
 Living with Both Parents Living with Mother Only Living with Father Only Living with Neither parent All74, %23.1%3.4%4.0% No Grandparents 67, %21.2%3.3%2.1% Both Grandparents 2, %40.6%5.2%36.1% Grandmother Only 1, %48.4%4.5%33.2% Grandfather Only %45.9%4.4%23.6% October")
46
...but Challenges Abound DIVERSITY RULES October 201246

47
October 201247

48
...but insufficient...but insufficient Education is Necessary October 201248

49
AVERAGE SHARE OF LONG-TERM UNEMPLOYMENT BY EDUCATION Education1990-19932001-2004% Change Less Than High School24.7%23.7% High School Graduate40.6%34.3%-6.3 Some College20.7%24.4%3.7 Bachelor’s Degree or More 14.0%17.6%3.6 October 201249

50
AVERAGE SHARE OF LONG-TERM UNEMPLOYMENT BY OCCUPATION Occupation1990-19932001-2004% Change Blue Collar40.5%31.6%-8.9 Service Occupation14.3%16.7%2.4 White Collar38.5%44.4%5.9 October 201250

51
THE LONG-TERM UNEMPLOYED, 2009 PROFESSION % OF ALL JOBLESS WORKERS Architecture & Engineering41.2 Management39.0 Community & Social Services Occupations36.1 Installation, Maintenance & Repair Work34.9 Production Occupations33.4 October 201251

52
THE COMPETITIVE TOOL KIT Analytical Reasoning Entrepreneurial Acumen Contextual Intelligence Soft Skills/Cultural Elasticity Agility and Flexibility

53
Moving Forward Rebrand communities as a sustainable place to live and do business Improve Male Education Outcomes Augment efforts to recruit plants with strategies to recruit people Embrace immigrants Recognize business development & job creation potential of elder care economy, diverse ethnic markets, & nascent freelance economy.

54
Implications for Workforce Planning and Development Managing transition from the “graying” to the “browning” of America. Competition for talent will be fierce – and global. Successful recruitment and retention will hinge on your ability to effectively manage the full nexus of “diversity” issues. October 201254

55
Implications for Workforce Planning and Development Managing transition from the “graying” to the “browning” of America. Competition for talent will be fierce – and global. Successful recruitment and retention will hinge on your ability to effectively manage the full nexus of “diversity” issues. October 201255

56
IMPLICATIONS FOR BUSINESS Emergence of global care economy Adjustments for aging consumers Succession Planning Female-Dominated Labor Force and Leadership Free Agency Rules January 201256

57
The Elder Care Economy October 201257

58
Age-Related Challenges Mobility Limitations Hearing Loss Vision Impairments Mental Disorders Substance Abuse Issues Chronic Disabilities Economic Constraints

59
The Triple Whammy Aging Boomers Face Mortality Elder Care Responsibilities Raising Grandchildren

60
OPPORTUNITIES Cater products & Labeling to emerging Groups Design & package products with equality in mind January 201260

61
LABELING & PACKAGING Easy to Read Easy to Understand Easy to Carry Easy to Enjoy Safer to Use January 201261

62
DEFINITION OF EASY TO CARRY: CURRENT VS. FUTURE Current PopulationFuture Grey Population Bulky and HeavyMinimal Unit Size and Weight Big-sized cart, shopping cart, car trunkCompact car, Rolling carriage Price SensitiveWeight Sensitive Aesthetics Is More ImportantFunction Is More Important Mostly carry with one handHandle with both hands January 201262

63
SMART SLIPPERS

64
GLOWCAPS

65
SENIOR PLAYGROUNDS

67
The Freelance Economy October 201267

68
DRIVERS Broadband Technology Cloud Computing Other Technological Innovations Disruptive Demographics Global Economic Recession

69
The Online Market Place Guru.com Elance.com Odesk.com Freelancer.com September 201269

70
The Freelancer Economy—Technology Websites & Ecommerce (42,084) Programming and Databases (47,749) Engineering & CAD (10,463) Networking & Telephone Systems (10, 154) ERP & CRM (2,288) September 201270
 Programming and Databases (47,749) Engineering & CAD (10,463) Networking & Telephone Systems (10, 154) ERP & CRM (2,288) September")
71
The Freelancer Economy—Creative Arts Graphic Design & Multimedia (32,289) Writing, Editing, & Translation (45,510) Illustration & Art (11,451) Photography & Videography (7,399) Fashion & Interior Designs (2,746) Broadcasting (4,806) September 201271
 Writing, Editing, & Translation (45,510) Illustration & Art (11,451) Photography & Videography (7,399) Fashion & Interior Designs (2,746) Broadcasting (4,806) September")
72
The Freelancers Economy—Business Administrative Support (36,504) Marketing & Communications (8,187) Sales & Telemarketing (4,167) Business Consulting (11,887) Legal (2,567) Finance & Accounting (4,657) September 201272
 Marketing & Communications (8,187) Sales & Telemarketing (4,167) Business Consulting (11,887) Legal (2,567) Finance & Accounting (4,657) September")
73
Top Freelancer Locations United States (200,619)Australia (3,307) India (60,212)Bangladesh (2,694) United Kingdom (10,387)Romania (2,494) Canada (9,133)Indonesia (2,332) Pakistan (7,731)Russian Federation (2,223) Philippines (5,221)Uruguay (1,847) September 201273
Australia (3,307) India (60,212)Bangladesh (2,694) United Kingdom (10,387)Romania (2,494) Canada (9,133)Indonesia (2,332) Pakistan (7,731)Russian Federation (2,223) Philippines (5,221)Uruguay (1,847) September")
74
DISTRIBUTION OF FREELANCE ENTREPRENEURS

75
Freelancers within 30 mile radius of Zip: 27514 (N= 1,578) Programming & Databases (287) Illustration & Art (50) Writing, Editing & Translation (281) Photography & Videography (41) Administrative Support (217)Sales & Marketing (26) Website & Ecommerce (153)Broadcasting (25) Graphic Design & Multimedia (148) Finance & Accounting (22) Business Consulting (101)Legal (18) Networking & Telephone Systems (76) ERP & CRM (14) Engineering & CAD (57)Fashion & Interior Design (8) Marketing & Communications (54) 75
 Programming & Databases (287) Illustration & Art (50) Writing, Editing & Translation (281) Photography & Videography (41) Administrative Support (217)Sales & Marketing (26) Website & Ecommerce (153)Broadcasting (25) Graphic Design & Multimedia (148) Finance & Accounting (22) Business Consulting (101)Legal (18) Networking & Telephone Systems (76) ERP & CRM (14) Engineering & CAD (57)Fashion & Interior Design (8) Marketing & Communications (54) 75")
76
THE END

77
October 201277

Similar presentations


 981-4076>")


 Demographic Highlights TEXAS is: big. The population.>")


