Download presentation
Presentation is loading. Please wait.

1
Disruptive Demographics: Implications for K-12 Education August 2011

2
OVERVIEW Demographic Trends Challenges & Opportunities Discussion

3
what CENSUS 2010 will REVEAL

4
6 DISRUPTIVE TRENDS The South Rises – Again The Browning of America The Silver Tsunami Marrying Out is “In” The End of Men? Cooling Water from Grandma’s Well… and Grandpa’s Too!

5
The South Continues To Rise The South Continues To Rise...Again!

6
South’s Share of U.S. Net Population Growth, Selected Years, 1910-2010 YearsU.S. Absolute Population Change South’s Absolute Population Change South’s Share of Change 1910-193030,974,129 8,468,30327% 1930-195028,123,138 9,339,45533% 1950-197051,886,12815,598,27930% 1970-199045,497,94722,650,56350% 1990-201060,035,66529,104,81449%

7
U.S. POPULATION CHANGE BY REGION, 2000-2010 Region 2010 Population Absolute Population Change, 2000-2010 Percent Population Change, 2000-2010 U.S.309,050,81626,884,9729.5% Northeast55,417,3111,753,9783.3% Midwest66,972,8872,480,9983.0% South114,404,43513,845,14413.8% West72,256,1838,774,85213.8% Wyoming563,62669,84414.1%

8
SHARES OF NET POPULATION GROWTH BY REGION, 2000-2010 Region Absolute Population ChangePercent of Total UNITED STATES26,884,972100.0 NORTHEAST1,753,9786.0 MIDWEST2,480,9989.0 SOUTH13,845,14451.0 WEST8,774,85232.0

9
NET MIGRATION TRENDS, 2000-2008 NortheastMidwestSouthWest Total-1,032-2,008+2,287+46 Black-346-71+376+41 Hispanic-292-109+520-117 Elderly-115+42+97-27 Foreign born -147-3+145+3 = Net Import= Net Export

10
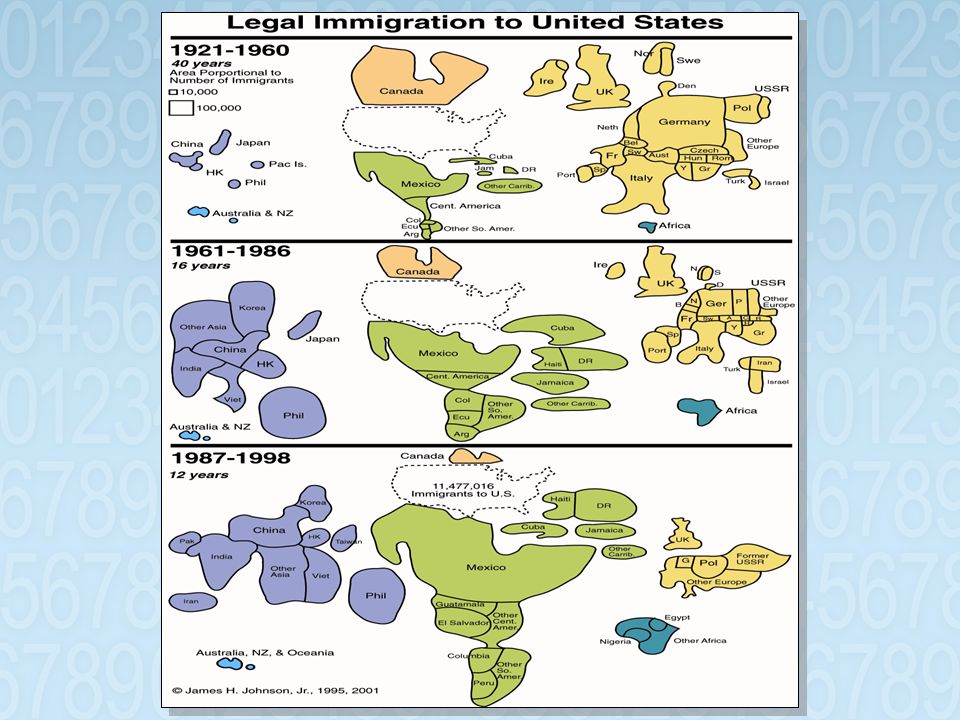
THE “BROWNING” OF AMERICA

12
The Numbers Legal Immigrants: 1920-1961: 206,000 annually 1961-1992: 561,000 annually 1993-1998: 800,654 annually 1999-2004: 879,400 annually 2005-2008: 1,137,000 annually Refugees, Parolees, Asylees 1961-1993: 2.1 million (65,000 annually) 1994-1998: 428,361 (85,672 annually) 1999-2004: 487,386 (81,231 annually) 2005-2008: 203,642 (75,661 annually) Illegal Immigrants: 300,000 to 400,000 annually over the past two decades Three million granted amnesty in 1986 2.7 million illegal immigrants remained in U.S. after 1986 reforms October 1996: INS estimated that there were 5 million illegal immigrants in the U.S. August 2005: Illegal population range from 7 to 15 million.

13
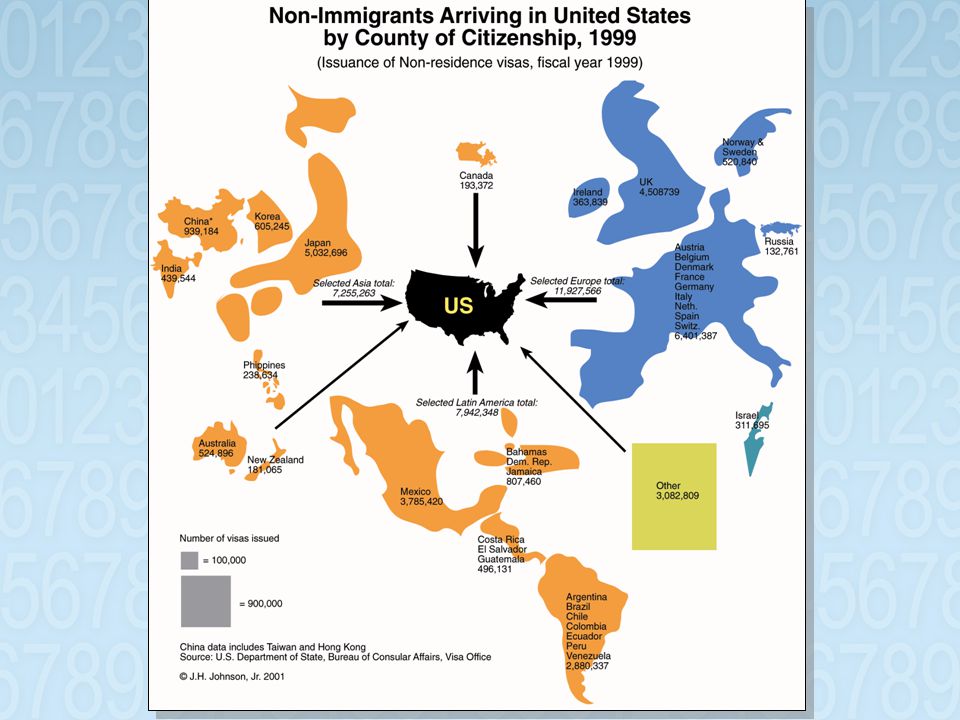
NON-IMMIGRANTS ADMITTED TO UNITED STATES, SELECTED YEARS, 1981-2008 YearAll ClassesExchange Visitors Academic & Vocational Students 198111,756,903108,023 (1%)271,861 (2%) 19859,539,880141,213 (1%)285,496 (3%) 199017,574,055214,644 (1%)355,207 (2%) 199522,640,540241,364 (1%)395,480 (2%) 200033,690,082351,743 (1%)699,953 (2%) 200132,824,088389,435 (1%)741,921 (2%) 200227,907,139370,176 (1%)687,506 (2%) 200430,781,330360,777(1%)656,373(2%) 200839,381,928506,138 (1%)917,373(2%)
271,861 (2%) 19859,539,880141,213 (1%)285,496 (3%) ,574,055214,644 (1%)355,207 (2%) ,640,540241,364 (1%)395,480 (2%) ,690,082351,743 (1%)699,953 (2%) ,824,088389,435 (1%)741,921 (2%) ,907,139370,176 (1%)687,506 (2%) ,781,330360,777(1%)656,373(2%) ,381,928506,138 (1%)917,373(2%)")
15
IMMIGRANT POPULATION, 1900-2007 Source: Center for Immigration Studies; U.S. Census Bureau, Current Population Survey

16
U.S. POPULATION CHANGE BY RACE & ETHNICITY, 2000-2009 Race2009 Population Absolute Change 2000 – 2009 Percentage Change 2000 - 2009 Total307,806,55024,834,5398.8 Non-Hispanic258,587,22612,057,6484.9 White199,851,2404,088,4482.1 Black37,681,5443,276,6619.5 AIAN2,360,807256,56412.2 Asian13,686,0833,233,41730.9 NHPI448,51079,26021.5 Two or More Races4,559,0421,123,29832.7 Hispanic48,419,32412,776,94535.8

17
SHARES OF NET POPULATION GROWTH, 2000-2009 Race Absolute Change 2000 - 2009Percent of Total Total24,834,539100 Non-Hispanic12,057,64848.6 White4,088,44816.5 Black3,276,66113.4 American Indian256,5641.0 Asian3,233,41713.0 Native Hawaiian79,2600.3 Two or More Races1,123,2984.5 Hispanic12,776,94551.4

18
MEDIAN AGE OF U.S. POPULATION BY RACE, HISPANIC ORIGIN & GENDER, 2009 RaceTotalMaleFemale United States36.835.438.2 White Alone38.337.039.6 White, Non-Hispanic41.239.942.6 Black Alone31.329.433.3 AIAN Alone29.529.030.2 Asian Alone33.632.634.6 NHPI Alone29.929.530.3 Two or More Races19.718.920.5 Hispanic27.4 27.5

19
TOTAL FERTILITY RATES OF U.S. WOMEN BY RACE/ETHNICITY, 2007 Race/EthnicityTotal Fertility Rate Hispanic2.99 Non-Hispanic White1.87 Blacks2.13 Asian2.04 Native American1.86 Source: Johnson and Lichter (2010)
.")
20
RELATIVE DISTRIBUTION OF U.S. BIRTHS BY RACE / ETHNICITY Race/Ethnicity19902008 White66%50% Blacks17%16% Hispanics15%26% Other2%8% Source: Johnson and Lichter (2010).
..")
21
RELATIVE DISTRIBUTION OF U.S. POPULATION BY RACE / ETHNICITY Race/Ethnicity20052050 White67%47% Blacks12.8%13% Hispanics14%29% Asian5%9% Source: Pew Research Center, 2008 *projected.

22
THE SILVER TSUNAMI

23
U.S. POPULATION CHANGE BY AGE, 2000-2009 Age2009 Absolute Change 2000 - 2009 Percentage Change 2000 - 2009 <25104,960,2505,258,4925.3 25-4484,096,278-1,898,345-2.2 45-6479,379,43916,977,56727.2 65+39,570,5904,496,88612.8 TOTAL307,006,55024,834,5938.8

24
U.S. POPULATION TURNING 50, 55, 62, AND 65 YEARS OF AGE, (2007-2015) Age 50 Age 55 Age 62 Age 65 Average Number/Day12,34411,5419,2218,032 Average Number/Minute 8.68.06.45.6
 Age 50 Age 55 Age 62 Age 65 Average Number/Day12,34411,5419,2218,032 Average Number/Minute")
25
THE GREYING OF AMERICA U.S. Census Projections

26
ABSOLUTE AND PERCENT CHANGE IN U.S. POPULATION BY AGE Age20052050% Change Total29643850.0 0-177310239.7 18-6418625537.1 65+3781118.9

27
OLDER WORKERS IN U.S. WORKFORCE YEAR Age 65 or Older Age 75 or Older 199811.9%4.7% 200816.8%7.3%

28
is “In” Marrying Out

29
INTERMARRIAGE TREND, 1980-2008 % Married Someone of a Different Race/Ethnicity

30
EDUCATION & INTERMARRIAGE % of Newlyweds Who Married Someone of a Different Race/Ethnicity, 2008

31
INTERMARRIAGE TYPES Newly Married Couples in 2008

32
INTERMARRIAGE RATES BY RACE & ETHNICITY % of Newlyweds Who Married Someone of a Different Race/Ethnicity, 2008

33
The End of Men?

34
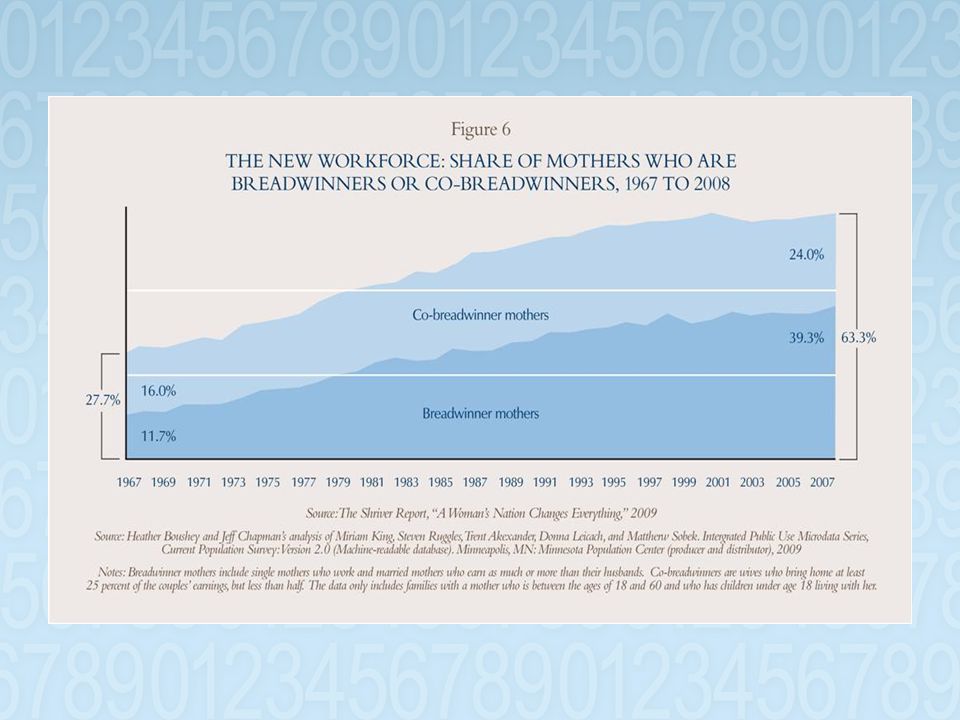
FEMALE WORKFORCE REPRESENTATION

35
COLLEGE CLASS OF 2010 DEGREEMALEFEMALEDIFFERENCE Associate’s293,000486,000193,000 Bachelor’s702,000946,000244,000 Master’s257,000391,000134,000 Professional46,80046,400-400 Doctor’s31,50032,9001,400 TOTAL1,330,3001,902,300572,000

37
JOBS LOST/GAINED BY GENDER DURING 2007 (Q4) – 2009 (Q3) RECESSION IndustryWomenMen Construction -106,000-1,300,000 Manufacturing -106,000-1,900,000 Healthcare +451,800 +118,100 Government +176,000 +12,000 Total-1,700,000-4,700,000
 – 2009 (Q3) RECESSION IndustryWomenMen Construction -106,000-1,300,000 Manufacturing -106,000-1,900,000 Healthcare +451, ,100 Government +176, ,000 Total-1,700,000-4,700,000")
38
Cooling Waters From Grandma’s Well And Grandpa’s Too!

39
CHILDREN LIVING IN NON-GRANDPARENT AND GRANDPARENT HOUSEHOLDS, 2001-2010 Household Type Absolute Number 2010 Absolute Change 2001-2010 Percent Change 2001-2010 All 74,7182,712 3.8 No Grandparents 67,209 917 1.4 Both Grandparents 2,610 77141.9 Grandmother Only 1,922 164 9.3 Grandfather Only 318 7128.7

40
CHILDREN LIVING IN NON-GRANDPARENT AND GRANDPARENT-HEADED HOUSEHOLDS BY PRESENCE OF PARENTS, 2010 Household Type All Children (in thousands) Living with Both Parents Living with Mother Only Living with Father Only Living with Neither parent All74,71869.3%23.1%3.4%4.0% No Grandparents 67,20973.4%21.2%3.3%2.1% Both Grandparents 2,61018.1%40.6%5.2%36.1% Grandmother Only 1,92213.8%48.4%4.5%33.2% Grandfather Only 31826.4%45.9%4.4%23.6%
 Living with Both Parents Living with Mother Only Living with Father Only Living with Neither parent All74, %23.1%3.4%4.0% No Grandparents 67, %21.2%3.3%2.1% Both Grandparents 2, %40.6%5.2%36.1% Grandmother Only 1, %48.4%4.5%33.2% Grandfather Only %45.9%4.4%23.6%")
41
IMPLICATIONS FOR WORKPLACES Managing transition from the “graying” to the “browning” of America. Competition for talent will be fierce – and global. Successful recruitment and retention will hinge on your ability to effectively manage the full nexus of “diversity” issues. Cultural Elasticity will be in great demand.

42
CHANGE IN FOREIGN BORN AND HISPANIC SHARES OF WORKING AGE POPULATION (18-64), 2005 - 2050 Age20052050* Total186 million255 million Hispanic Share14%31% Foreign-born Share15%23%
, Age * Total186 million255 million Hispanic Share14%31% Foreign-born Share15%23%")
43
DEMAND FOR CULTURAL ELASTICITY Linguistic Religious Family Structure Lifestyle Sexual Orientation Generational

44
OLDER WORKERS IN U.S. WORKFORCE 65 or Older 75 or Older 200816.8%7.3% 199811.9%4.7%

45
STRATEGIES TO ATTRACT AND RETAIN OLDER WORKERS Flexible work arrangements (consultant, temporary and part-time assignments) Phased-retirement program Retirement health benefits Prescription drug coverage Superior vision and dental plans Defined benefit pension Long-term care insurance
 Phased-retirement program Retirement health benefits Prescription drug coverage Superior vision and dental plans Defined benefit pension Long-term care insurance")
46
IMPLICATIONS FOR K-12 & HIGHER EDUCATION AND TRAINING

47
...but Challenges Abound DIVERSITY RULES

49
...but insufficient...but insufficient Education is Necessary

50
AVERAGE SHARE OF LONG-TERM UNEMPLOYMENT BY EDUCATION Education1990-19932001-2004% Change Less Than High School24.7%23.7% High School Graduate40.6%34.3%-6.3 Some College20.7%24.4%3.7 Bachelor’s Degree or More 14.0%17.6%3.6

51
AVERAGE SHARE OF LONG-TERM UNEMPLOYMENT BY OCCUPATION Occupation1990-19932001-2004% Change Blue Collar40.5%31.6%-8.9 Service Occupation14.3%16.7%2.4 White Collar38.5%44.4%5.9

52
THE LONG-TERM UNEMPLOYED, 2009 PROFESSION % OF ALL JOBLESS WORKERS Architecture & Engineering41.2 Management39.0 Community & Social Services Occupations36.1 Installation, Maintenance & Repair Work34.9 Production Occupations33.4

53
Survival Skills l Personal branding is paramount l Display entrepreneurial acumen l Develop contextual intelligence l Hone soft skills

54
Personal Branding & Image Marketing l Create an accurate and honest picture of the “impression you make on others” l Explain the end result of what you do – your value add l Develop ‘reputational’ power l Create a personal website to market yourself l Example: KwameJackson.com

55
Entrepreneurial Acumen l Demonstrate a willingness to take incalculable risks and the ability to be agile, flexible, tenacious, and decisive in responding to unanticipated crises and opportunities.

56
Contextual Intelligence l Develop an acute sensitivity to the social, political, technological, economic, and demographic drivers of change that will likely define the future.

57
IMPLICATIONS FOR THE NATION’S HEALTH AND COMPETITIVENESS Create healthy and viable communities Active living by design Health eating by design Infuse health and wellness education throughout K-16 curriculum Strategically re-position health disparities as a competitiveness issue.

Similar presentations


 981-4076>")


