Download presentation
Presentation is loading. Please wait.

1
Disruptive Demographics and North Carolina’s Global Competitiveness Challenge January 2014 James H. Johnson, Jr. Frank Hawkins Kenan Institute of Private Enterprise Kenan-Flagler Business School University of North Carolina at Chapel Hill

2
OVERVIEW Demographic Trends Challenges & Opportunities Discussion

3
what January 2014 CENSUS 2010 will REVEAL

4
6 DISRUPTIVE TRENDS The South Rises – Again The Browning of America Marrying Out is “In” The Silver Tsunami is About to Hit The End of Men? Cooling Water from Grandma’s Well… and Grandpa’s Too!

5
The South Continues To Rise The South Continues To Rise...Again!

6
SOUTH’S SHARE OF U.S. NET POPULATION GROWTH, SELECTED YEARS, 1910-2010 Years U.S. Absolute Population Change South’s Absolute Population Change South’s Share of Change 1910-193030,974,129 8,468,30327% 1930-195028,123,138 9,339,45533% 1950-197051,886,12815,598,27930% 1970-199045,497,94722,650,56350% 1990-201060,035,66529,104,81449%

7
U.S. POPULATION CHANGE BY REGION, 2000-2010 Region 2010 Population Absolute Population Change, 2000-2010 Percent Population Change, 2000-2010 U.S.309,050,81626,884,9729.5% Northeast55,417,3111,753,9783.3% Midwest66,972,8872,480,9983.0% South114,555,74414,318,92414.3% West72,256,1838,774,85213.8% North Carolina9,535,4831,486,17018.5%

8
SHARES OF NET POPULATION GROWTH BY REGION, 2000-2010 Region Absolute Population ChangePercent of Total UNITED STATES26,884,972100.0 NORTHEAST1,753,978 6.0 MIDWEST2,480,998 9.0 SOUTH14,318,92453.0 WEST8,774,85232.0

9
NET MIGRATION TRENDS, 2000-2008 NortheastMidwestSouthWest Total-1,032-2,008+2,287+46 Black-346-71+376 +41 Hispanic-292-109+520-117 Elderly-115+42+97-27 Foreign born-147-3+145+3 = Net Import= Net Export

10
STATE SHARE OF SOUTH’S NET GROWTH, 2000-2010 Region/StateAbsolute ChangeState’s Share The South14,318,924100.0% Texas 4,293,741 30.0% Florida 2,818,932 19.7% Georgia 1,501,200 10.5% North Carolina 1,486,170 10.4% Other Southern States 4,218,881 29.4%

11
NC COUNTIES WITH THE LARGEST ABSOLUTE POPULATION GAINS, 2000-2010

12
NC COUNTIES EXPERIENCING POPULATION DECLINE, 2000-2010

13
Counties with Biologically Declining Populations, 2009

14
GROSS AND NET MIGRATION FOR THE SOUTH, 2004-2010 The Region DomesticForeign YearsInOutNetInOutNet 2004-20074,125,0963,470,431654,665268,619132,382136,237 2007-20103,874,4143,477,899396,525232,501132,201100,300 Florida DomesticForeign YearsInOutNetInOutNet 2004-2007812,053630,051182,00241,74524,10817,637 2007-2010654,931668,087-13,15633,09532,0941,001

15
U.S. POPULATION CHANGE BY REGION, 2010-2013 Region 2013 Population Absolute Population Change, 2010-2013 Percent Population Change, 2010-2013 U.S.316,128,8396,802,5542.2% Northeast55,943,073566,7511.0% Midwest67,547,890571,5690.9% South118,383,4533,525,5543.1% West74,254,4232,138,6703.0% North Carolina9,848,060258,5272.7%

16
SHARES OF NET POPULATION GROWTH BY REGION, 2010-2013 Region Absolute Population ChangePercent of Total UNITED STATES6,802,554100.0 NORTHEAST566,751 8.3 MIDWEST571,569 8.4 SOUTH3,525,55451.8 WEST2,138,67031.4

17
STATE SHARES OF SOUTH’S NET GROWTH, 2010-2013 Region/StateAbsolute ChangeState’s Share The South3,525,554100.0% Texas 1,203,01534.1% Florida736,806 20.9% Georgia 278,919 7.9% North Carolina 258,527 7.3% Virginia235,9886.7% Other Southern States812,299 23.1%

18
NC Biologically Declining Counties, 2010-2012

19
Net Importers and Exporters of Population, 2010-2012

20
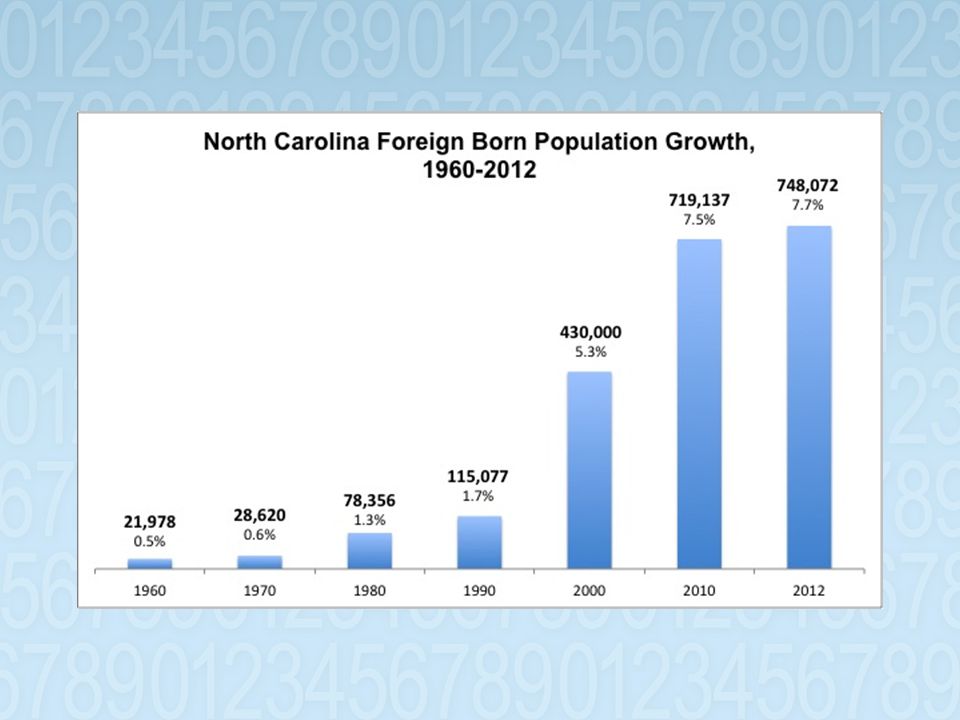
THE “BROWNING” OF NORTH CAROLINA

21
U.S. Immigrant Population, 1900-2011

22
U.S. Foreign Born Population by Race/Ethnicity, 2011 Race/EthnicityForeign PopulationShare of Total (%) Total40,381,574100.0 Hispanic18,788,300 46.5 White Alone, not Hispanic 7,608,236 18.8 Black Alone, not Hispanic 3,130,348 7.8 Asian Alone, not Hispanic 9,988,159 24.7 Other Alone, not Hispanic 866,531 2.1 22
 Total40,381, Hispanic18,788, White Alone, not Hispanic 7,608, Black Alone, not Hispanic 3,130, Asian Alone, not Hispanic 9,988, Other Alone, not Hispanic 866,")
24
NORTH CAROLINA POPULATION GROWTH BY NATIVITY, RACE, AND ETHNICITY, 1990-2007

25
NON-WHITE AND HISPANIC SHARES OF POPULATION GROWTH, 2000-2010 Area Absolute Population Change Non-White Share Hispanic Share US27,323,63291.755.5 South14,318,92479.646.4 Texas4,293,74189.265.0 Florida2,818,93284.954.7 Georgia1,501,20681.027.9 NC1,486,17061.228.3

26
CONTRIBUTIONS OF NON-WHITES & HISPANICS TO NC POPULATION CHANGE, 2000-2010 Area Absolute Population Change Percent Non- White* Percent Hispanic All Counties1,486,17061.228.5 Tier 1 Counties69,36584.151.5 Tier 2 Counties327,85963.234.2 Tier 3 Counties1,088,94659.125.0 Source: Census 2000 and Census 2010. *Non-whites include Blacks, Hispanics, American Indians and Alaskan Natives, Asians, Native Hawaiians & Pacific Islanders, and people of two or more races.

27
is “In” Marrying Out October 201227

28
INTERMARRIAGE TREND, 1980-2008 % Married Someone of a Different Race/Ethnicity October 201228

29
INTERMARRIAGE TYPES Newly Married Couples in 2008 October 201229

30
OUT-MARRIAGE PATTERNS BY RACE AND GENDER, NC 2005-2009 Hispanic Men21.4Hispanic Women21.6Black Men9.4Black Women3.4 White Female18.0White Male16.4White Female6.0White Male0.6 Black Female1.5Black Male3.7Hispanic Female1.4Hispanic Male1.9 Asian Female0.7Asian Male0.2Asian Female0.5Asian Male0.1 Other Female1.2Other Male1.3Other Female1.5Other Male0.9 White Men3.3White Women3.4Asian Men12.3Asian Women31.4 Hispanic Female1.1Hispanic Male1.2White Female10.0Hispanic Male1.5 Black Female0.3Black Male1.1Black Female0.6White Male25.8 Asian Female0.9Asian Male0.2Hispanic Female0.5Black Male2.7 Other Female1.0Other Male0.9Other Female1.2Other Male1.3

31
Median Age and Fertility Rates for Females in North Carolina, 2007-2011 Demographic Group All Females White, Not Hispanic Black American Indian & Alaskan Native Asian Native Hawaiian & Pacific Islander Some other race Two or more races Hispanic Native Born Foreign Born Source: www.census.gov www.census.gov *Women 15 to 50 with births in past 12 months. Median Age 38.7 42.9 35.8 34.6 32.9 26.7 23.7 16.9 23.8 39.0 36.4 Fertility/1000 women* 56 49 60 66 63 103 97 65 99 52 92

32
RELATIVE DISTRIBUTION OF U.S. BIRTHS BY RACE / ETHNICITY Race/Ethnicity199020082011 White66%50%49.6% Blacks17%16%15.0% Hispanics15%26%26.0% Other2%8%9.4% Source: Johnson and Lichter (2010); Tavernise (2011).
; Tavernise (2011)..")
33
CHANGE IN THE RACE/ETHNIC COMPOSITION OF NC PUBLIC SCHOOLS, 2000-2009 Group 2009 Enrollment 2000 Enrollment Absolute Change Percent Change Share of Net Change Total1,427,9601,268,422159,538 12.6100.0% AI/AN 20,378 18,651 1,727 9.6 1.2% Black 444,870 393,712 51,158 13.0 32.1% Asian 35,140 23,576 11,564 49.0 7.2% Hispanic 152,605 56,232 96,373171.4 60.4% White 774,967 776,251- 1,284- 0.2. Source: DPI, The Statistical Profile Online

34
NC’s SILVER TSUNAMI

35
Absolute and Percent Population Change by Age, 2000-2010 Age All Ages <25 United States 27,323,632 (9.7%) 5,416,292 (5.4%) North Carolina 1,486,170 (18.5%) 449,385 (16.2%) 25-44 45-64 65+ -2,905,697 (-3.4%) 19,536,809 (31.5%) 5,276,231 (15.1%) 73,209 (2.9%) 698,545 ( 38.6% ) 265,031 (27.3% )
 5,416,292 (5.4%) North Carolina 1,486,170 (18.5%) 449,385 (16.2%) ,905,697 (-3.4%) 19,536,809 (31.5%) 5,276,231 (15.1%) 73,209 (2.9%) 698,545 ( 38.6% ) 265,031 (27.3% )")
36
U.S. POPULATION TURNING 50, 55, 62, AND 65 YEARS OF AGE, (2007-2015) Age 50 Age 55 Age 62 Age 65 Average Number/Day12,34411,5419,2218,032 Average Number/Minute8.68.06.45.6 October 201236
 Age 50 Age 55 Age 62 Age 65 Average Number/Day12,34411,5419,2218,032 Average Number/Minute October")
37
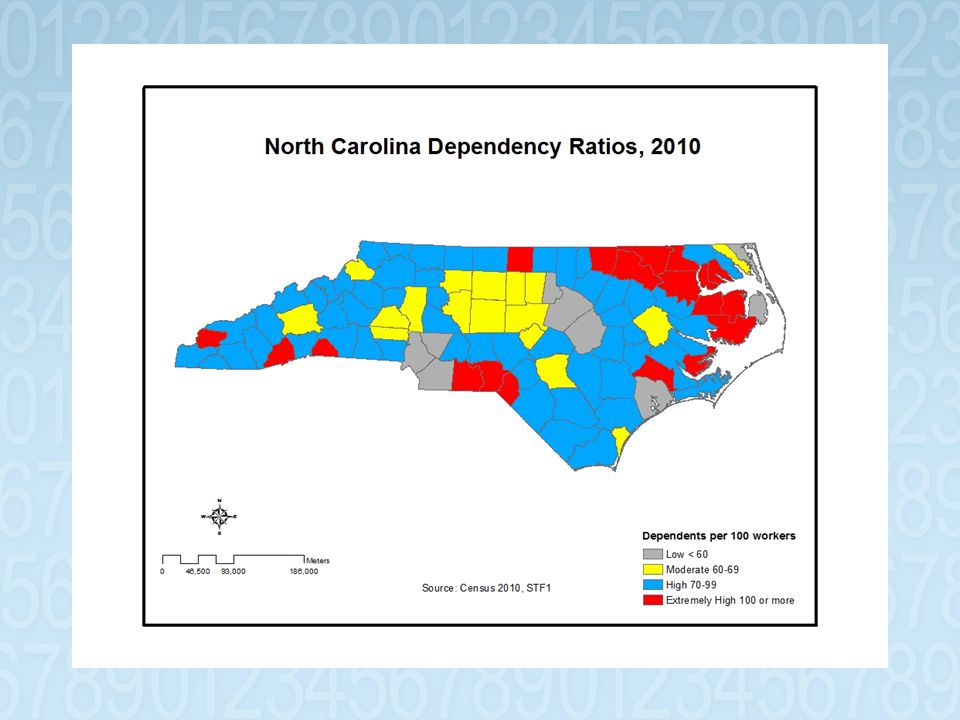
DEPENDENCY RATIOS IN THE AMERICAN SOUTH Source: Census 2010

38
NC ABSOLUTE POPULATION CHANGE BY AGE, 2000-2010 AgeAll Counties Tier 3 Counties Tier 2 Counties Tier 1 Counties All Ages1,486,1701,088,946327,859 69,365 <25 449,385 369,818 85,481- 5,914 25-44 73,209 159,248- 36,139-49,900 45-64 698,545 410,705199,101 88,739 65+ 265,031 149,175 79,416 36,440

39
Dependency Rates for North Carolina and Economic Development Tiers, 2006-2010 Dependency Rate North Carolina 68.7 Tier 1 90.5 Tier 2 71.3 Tier 3 56.6

41
COOLING WATERS FROM GRANDMA’S WELL And Grandpa’s Too!

42
Children Living in Non-Grandparent and Grandparent Households, 2001-2010 Household TypeAbsolute Number 2010 Absolute Change 2001-2010 Percent Change 2001-2010 All74,7182,712 3.8 No Grandparents67,209 917 1.4 Both Grandparents 2,610 77141.9 Grandmother Only 1,922 164 9.3 Grandfather Only 318 7128.7 October 201242

43
Children Living in Non-Grandparent and Grandparent-Headed Households by Presence of Parents, 2010 Household Type All Children (in thousands) Living with Both Parents Living with Mother Only Living with Father Only Living with Neither parent All74,71869.3%23.1%3.4%4.0% No Grandparents 67,20973.4%21.2%3.3%2.1% Both Grandparents 2,61018.1%40.6%5.2%36.1% Grandmother Only 1,92213.8%48.4%4.5%33.2% Grandfather Only 31826.4%45.9%4.4%23.6% October 201243
 Living with Both Parents Living with Mother Only Living with Father Only Living with Neither parent All74, %23.1%3.4%4.0% No Grandparents 67, %21.2%3.3%2.1% Both Grandparents 2, %40.6%5.2%36.1% Grandmother Only 1, %48.4%4.5%33.2% Grandfather Only %45.9%4.4%23.6% October")
44
GRANDPARENTS LIVING WITH GRANDCHILDREN AGES 18 AND YOUNGER IN NORTH CAROLINA 20052010 Percent Change Total Households with Grandparents 146,875175,01919.2 Grandparents Responsible for Grandchildren 84,232109,60230.1 Child's Parents in Household 43,67967,27154.0

45
The End of Men?

46
FEMALE WORKFORCE REPRESENTATION

47
JOBS LOST/GAINED BY GENDER DURING 2007 (Q4) – 2009 (Q3) RECESSION Industry WomenMen Construction -106,000-1,300,000 Manufacturing -106,000-1,900,000 Healthcare +451,800 +118,100 Government +176,000 +12,000 Total -1,700,000-4,700,000
 – 2009 (Q3) RECESSION Industry WomenMen Construction -106,000-1,300,000 Manufacturing -106,000-1,900,000 Healthcare +451, ,100 Government +176, ,000 Total -1,700,000-4,700,000")
48
THE PLIGHT OF MEN Today, three times as many men of working age do not work at all compared to 1969. Selective male withdrawal from labor market—rising non-employment due largely to skills mismatches, disabilities & incarceration. The percentage of prime-aged men receiving disability insurance doubled between 1970 (2.4%) and 2009 (4.8%). Since 1969 median wage of the American male has declined by almost $13,000 after accounting for inflation. After peaking in 1977, male college completion rates have barely changed over the past 35 years.
 and 2009 (4.8%). Since 1969 median wage of the American male has declined by almost $13,000 after accounting for inflation. After peaking in 1977, male college completion rates have barely changed over the past 35 years..")
49
COLLEGE CLASS OF 2010 DEGREEMALEFEMALEDIFFERENCE Associate’s293,000486,000193,000 Bachelor’s702,000946,000244,000 Master’s257,000391,000134,000 Professional46,80046,400-400 Doctor’s31,50032,9001,400 TOTAL1,330,3001,902,300572,000

50
ENROLLMENT IN 2 YEAR COLLEGES, 2009 Area Total Enrollment Full Time Enrollment (%) Male Enrollment (%) Black Enrollment (%) U.S.20,966,826634313 Southeast Region 4,731,356654123 North Carolina 574,135644124 NC- 2 Yr Colleges 253,383434025
 Male Enrollment (%) Black Enrollment (%) U.S.20,966, Southeast Region 4,731, North Carolina 574, NC- 2 Yr Colleges 253,")
51
UNC SYSTEM STUDENT ENROLLMENT BY GENDER AND TYPE OF INSTITUTION, 2010 Type of Institution Total Enrollment Male Enrollment Percent Male UNC System 175,28176,95344 Majority Serving 139,25063,40346 Minority Serving 36,03113,55038 HBUs 29,86511,19137

52
Average EOG Scores Gender scores are averages of 6 LEAs (Bertie, Bladen, Halifax, Duplin, Northampton and Pamlico)
")
53
Average EOG Scores Gender scores are averages of 6 LEAs (Bertie, Bladen, Halifax, Duplin, Northampton and Pamlico)
")
54
Average EOC Scores Gender scores are averages of 6 LEAs (Bertie, Bladen, Halifax, Duplin, Northampton and Pamlico)
")
55
EOC Composite Scores Gender scores are averages of 6 LEAs (Bertie, Bladen, Halifax, Duplin, Northampton and Pamlico)
")
56
Male-Female Presence Disparity Graph shows total number of male and female students tested of 6 LEAs (Bertie, Bladen, Duplin, Halifax, Northampton, and Pamlico)
")
57
High School Graduation Rates Avg. graduation rates of 6 LEAs (Bertie, Bladen, Halifax, Duplin, Northampton and Pamlico)
.")
58
The Minority Male Challenge

59
Third Grade EOG Reading Test Pass Rates For Males by Race/Ethnicity

60
Third Grade EOG Math Test Pass Rates for Males by Race/Ethnicity

61
Eighth Grade EOG Reading Test Pass Rates for Males by Race/Ethnicity

62
Eighth Grade EOG Math Test Pass Rates for Males by Race/Ethnicity

63
...but Challenges Abound DIVERSITY RULES September 201263

64
September 201264

65
Percent of High School Graduates Requiring Remedial Course Work

66
...but insufficient...but insufficient Education is Necessary

67
AVERAGE SHARE OF LONG-TERM UNEMPLOYMENT BY EDUCATION Education1990-19932001-2004% Change Less Than High School24.7%23.7% High School Graduate40.6%34.3%-6.3 Some College20.7%24.4%3.7 Bachelor’s Degree or More 14.0%17.6%3.6

68
AVERAGE SHARE OF LONG-TERM UNEMPLOYMENT BY OCCUPATION Occupation1990-19932001-2004% Change Blue Collar40.5%31.6%-8.9 Service Occupation14.3%16.7%2.4 White Collar38.5%44.4%5.9

69
THE LONG-TERM UNEMPLOYED, 2009 PROFESSION % OF ALL JOBLESS WORKERS Architecture & Engineering41.2 Management39.0 Community & Social Services Occupations36.1 Installation, Maintenance & Repair Work34.9 Production Occupations33.4

70
BACHELOR’S DEGREE HOLDERS (UNDER AGE 25) WHO WERE JOBLESS OR UNDEREMPLOYED YearPercent 200041.0 201153.6
 WHO WERE JOBLESS OR UNDEREMPLOYED YearPercent")
71
CHANGE IN INCIDENCE OF POVERTY BY EDUCATIONAL ATTAINMENT IN NC, 2005-2007, 2008-2010 Educational Attainment 2005-20072008-2010 Percent Change Less than High School 253,304276,757 9.3% High School Graduate 216,667234,371 8.2% Some College, Associate Degree 136,185186,83437.2% Bachelor’s degree or higher 49,082 57,91918.0% Source: American Community Survey

72
THE COMPETITIVE TOOL KIT Analytical Reasoning Entrepreneurial Acumen Contextual Intelligence Soft Skills/Cultural Elasticity Agility and Flexibility

73
Implications for Workforce Planning and Development Managing transition from the “graying” to the “browning” of America. Competition for talent will be fierce – and global. Successful recruitment and retention will hinge on your ability to effectively manage the full nexus of “diversity” issues. September 201273

74
MOVING FORWARD Higher Education must become more actively engaged in K-12 Education. Improve Male Education Outcomes. Embrace immigrants. Develop effective strategies to address childhood hunger Establish stronger ties with business to ensure that students graduate with the requisite skills to compete in an ever-changing global economy. Prepare students for the freelance economy.

Similar presentations


 981-4076>")


