Download presentation
Presentation is loading. Please wait.

1
Hungarian statistics of renewable energy sources

3
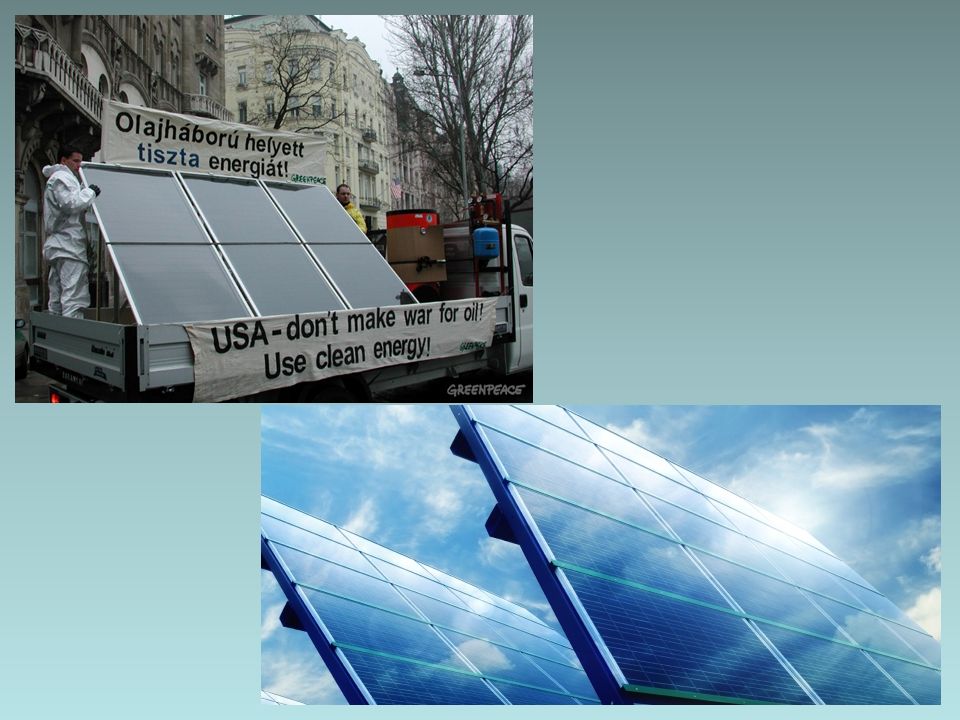
Solar Energy Great potential for the use of solar energy Lack of financial governmental support The target by 2010 was : 20,000 roof with solar collectors Realized : 150,000 m 2 Annual efficiency : 35 – 45 % Average produced thermal energy : 480-620 kWh/m 2

4
The number of sunny hours is between 1900 - 2200 per year

5
The size of the new year completed solar systems in Hungary

7
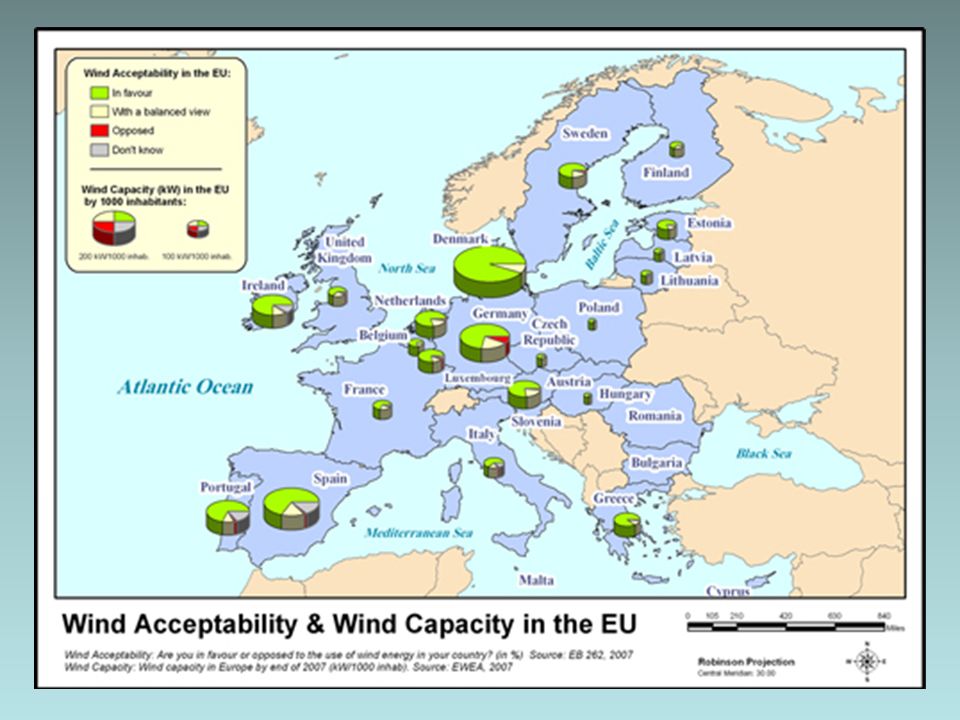
Wind Energy 43% of the country’s area is suitable for the economical utilization of wind power The opportunities are even more promising in higher altitudes

9
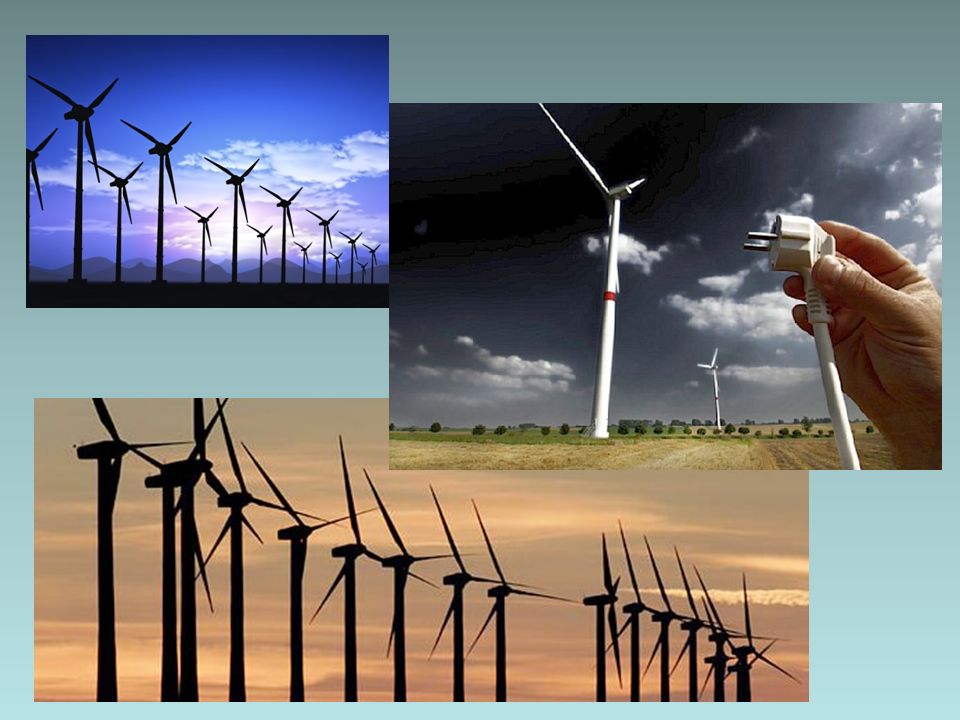
Wind Energy 2010 the share of electricity 7,56% The participation of large-scale wind turbines from Hungarian installed power plant capacity was approximately 3,2% At present 10 operating turbines 1 – 2 operating wind farm in the economy The first 250-kW generator : at Inota in 2000 After 6 months from its opening, a new 600- kW wind-generator at Kulcs in June The national target for 2020 : receiving wind energy up to an approximate total output of 740 MWe

10
2012 : more than 733,000 MWh electricity Per Month : 61,000 MWh Most productive month : January with 100,000 MWh

11
Wind farms in Hungary Inota / Várpalota1 Kulcs1 Mosonszolnok2 Mosonmagyaróvár1 Bükkaranyos1 Erk1 Újrónaf ő 1 Szápár1 Vép1 Mosonmagyaróvár5 Mez ő túr1 Törökszentmiklós1 Mosonmagyaróvár5 Fels ő zsolca1 Csetény2 Ostffyasszonyfa1 Mosonszolnok – Levél12 Mosonszolnok1 Csorna1 Mecsér1

13
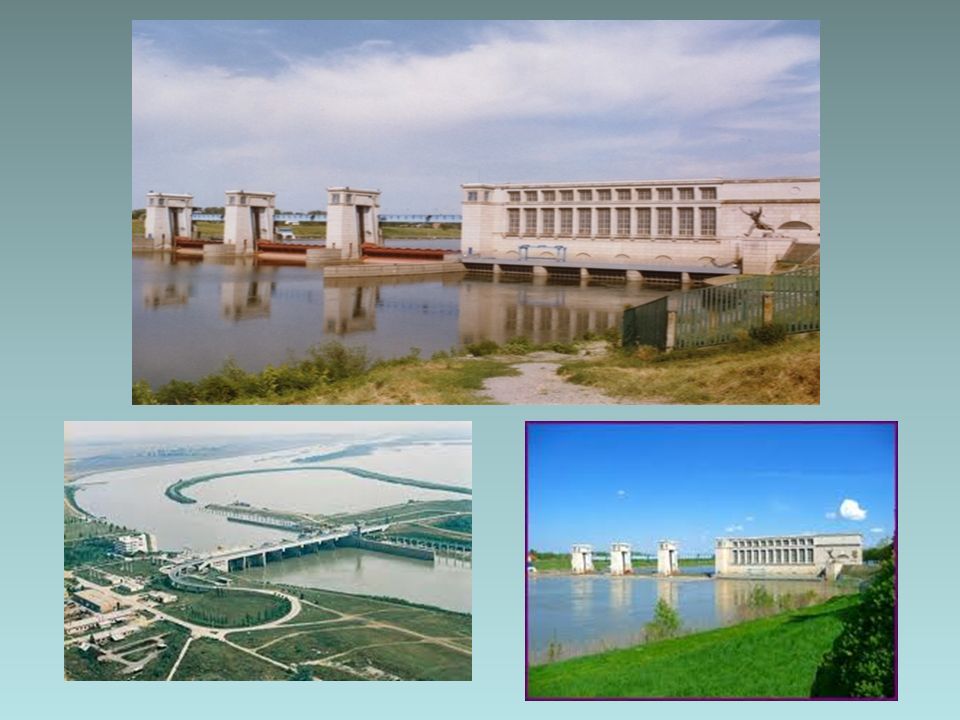
Hydro - power 5 bigger, 32 smaller power plants Distribution of all Hungarian hydroelectric power plants : –Danube 66% –Tisa 10% –Tributaries 24% Output : 50 MW Annual energy production : 200 GWh

14
Hydroelectric power plants in Hungary Tiszalök Kisköre Hernád Kesznyét Gibárt Felsődobsza Ikervár

17
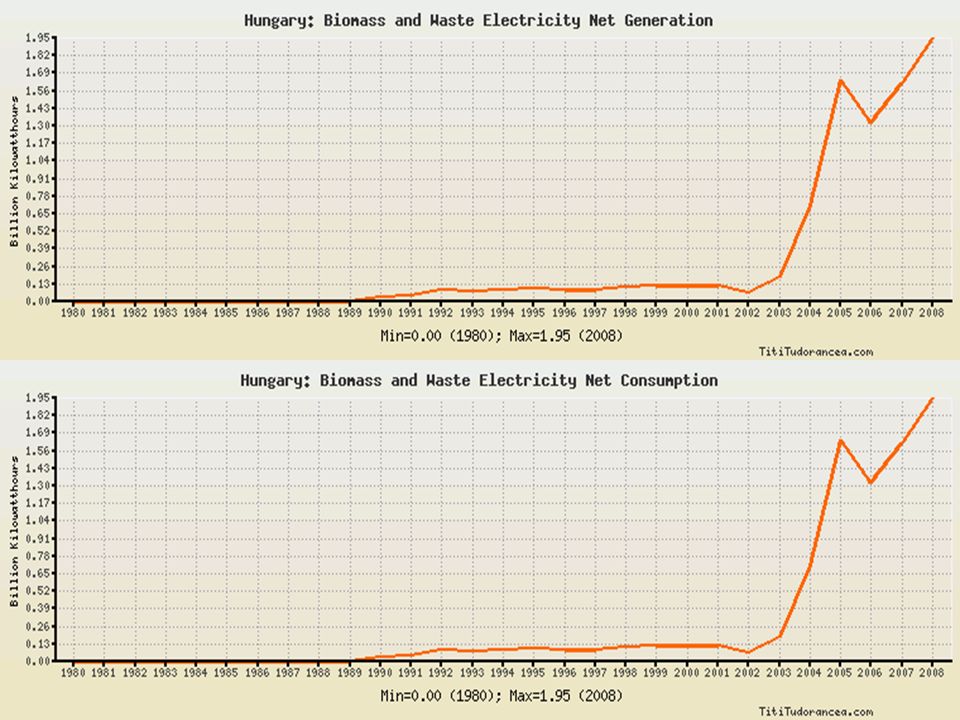
Biomass The largest and expandable energy base Good endowments to use biomass Per year : 9 million m3 could be produced from the national forests Effective production : 7 million m3 timber Utilized timber : 5.5 million m3

19
Biomass heating and power stations in Hungary Szigetvár Mátészalka Körmend Szombathely Sárospatak Tata Szentendre Balassagyarmat Papkeszi Pécs Kazincbarcika Ajka

20
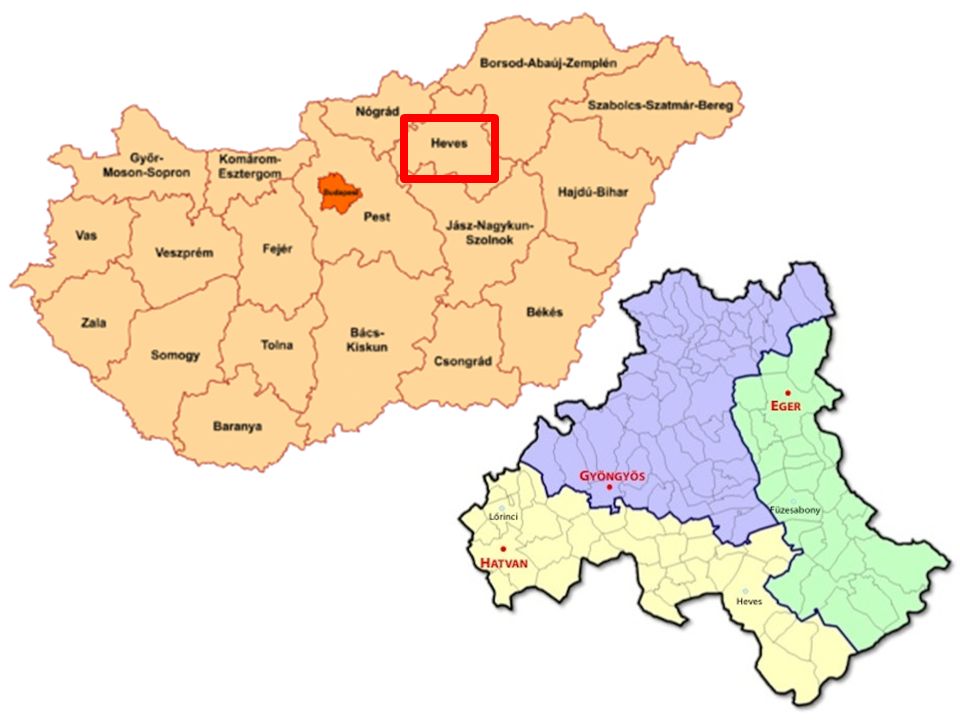
The aggregate biomass potential of the Micro-region of Eger Energy Potential ( GJ ) Vine - branch80.000 Cuttings of fruit - trees5.500 Field crops115.000 In total250.000
 Vine - branch Cuttings of fruit - trees5.500 Field crops In total")
21
The present use of biomass in the County of Heves Mátra Power Plant –Have been using biomass for 5 years to generate electricity Semi-plant biomass central heating plant at Gyöngyös for research purposes –To study semi-plant sized facilities with a capacity of 1 MW ( 400 kW and 600 kW furnaces )
")
23
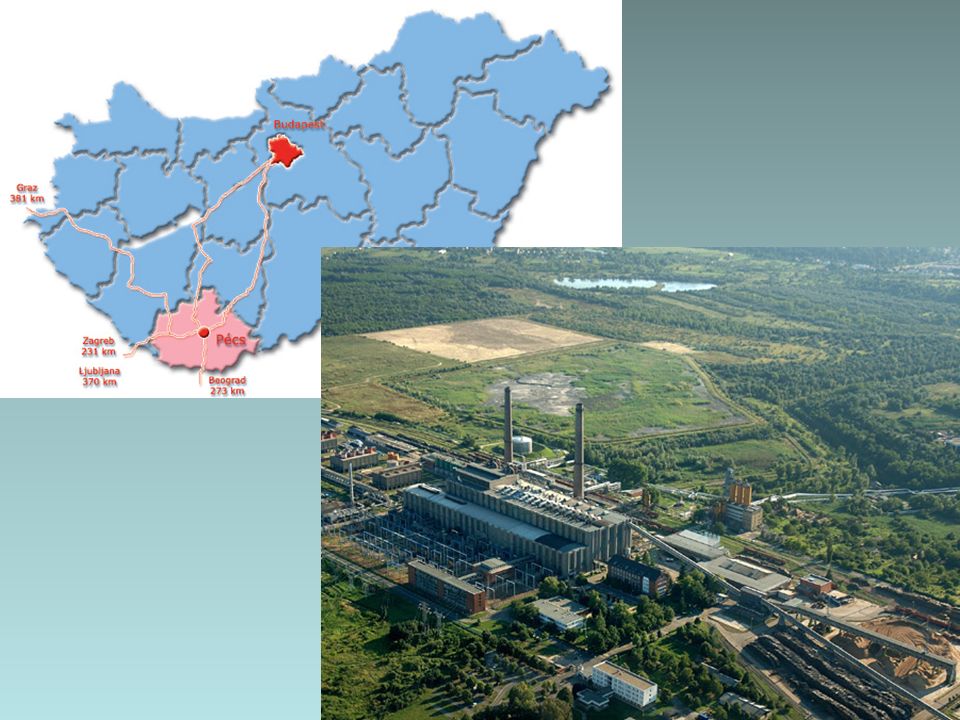
„The city of Pécs in South Western Hungary will become the greenest city in Hungary thanks to the installation of a new biomass-fueled heat and power.” On the 7 th November in 2013 Dalkia Energia inaugurated a new biomass unit in the Southwest Hungarian city of Pécs purchasing 240 thousand tons of mostly straw per year

25
This innovative solution in terms of energy will help create 170 local new jobs in the collection and delivery of agricultural side products This project decreases Hungary's energy dependence by reducing the import of natural gas by 80 million cubic meters a year

27
Geothermal energy 2010 : 9 % 4,23 PJ Ground Heat Pumps 2010 : 0 % 0,25 PJ 2020 : 17 % 16,43 PJ 2020 : 6% 5,99 PJ

28
Geothermal energy Location : large sedimentary basin Excellent geothermal features Geothermal heat utilization –2010 : 4,23 PJ –2020 : 16,43 PJ

29
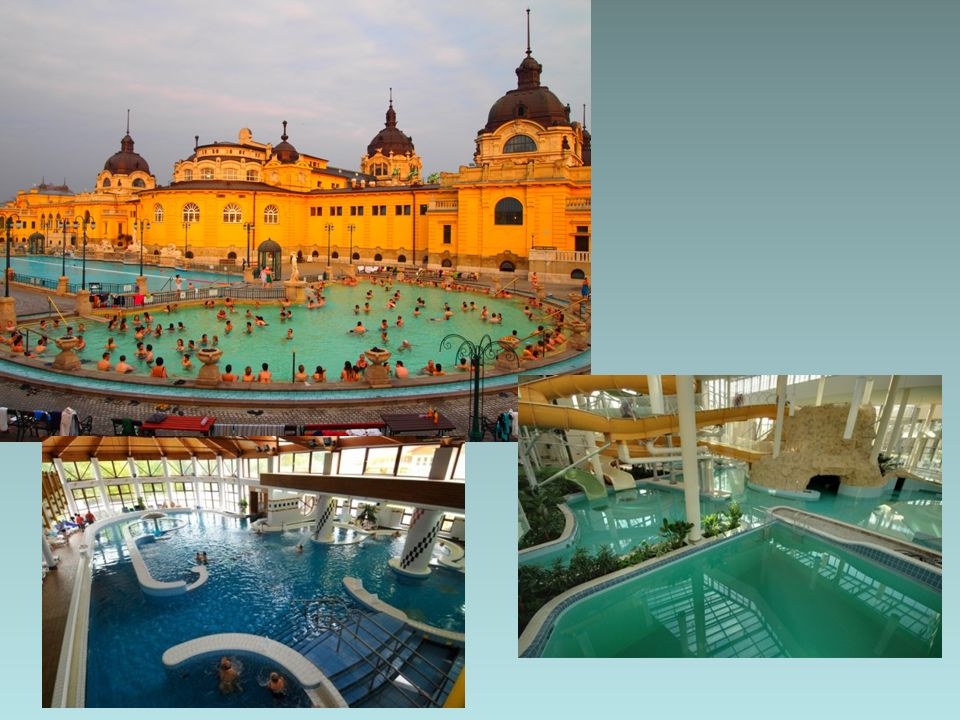
Geothermal energy Hungary is known to be reach in thermal waters –About 500Mrd m 3 total supply, from 50 Mrd m 3 thermal water could be used There are around 1400 thermal water wells 788 are using 450 Mrd m 3 water per year

31
Geothermal energy Utilization of thermal waters Balneology 35 % Drinking water 29 % Agriculture 27 % Communal heating 5 % Industry 4 %

32
Thank you for your attention!

Similar presentations


 Embassy of India Washington DC, 20008.>")


