Download presentation
Presentation is loading. Please wait.

1
2009 On-Farm Renewable Energy Production Survey February 25, 2011

2
Background The first survey conducted by USDA’s National Agricultural Statistics Service (NASS) to focus on the production of renewable energy on America’s farms and ranches.
 to focus on the production of renewable energy on America’s farms and ranches.")
3
Wind turbines Solar panels Methane digesters

4
2007 Census of Agriculture Screening Question At any time during 2007, did this operation generate energy or electricity on the farm using wind or solar technology, methane digester etc.?

6
Percent of U.S. Wind Turbines, Solar Panels, and Methane Digesters by Year of Installation

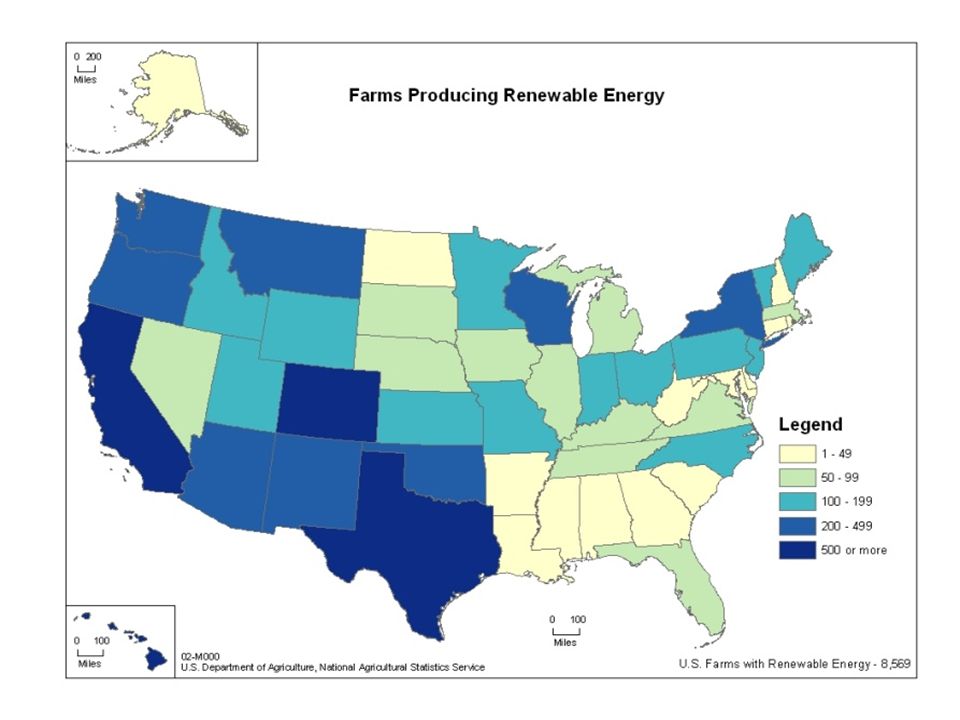
7
Wind Turbines 1,420 Operations in the United States 1,845 Turbines 1,406 Small Turbines (<100 kW) 1831 Wind Turbines 6 kW Average Generating Capacity $12,972 Average Installation Cost 14 Large Turbines (>100 kW) 14 Wind Turbines 1035 kW Average Generating Capacity $1,339,143 Average Installation Cost
 1831 Wind Turbines 6 kW Average Generating Capacity $12,972 Average Installation Cost 14 Large Turbines (>100 kW) 14 Wind Turbines 1035 kW Average Generating Capacity $1,339,143 Average Installation Cost")
8
Wind Turbines: Number of Farms Select States (2009)
")
9
Solar Panels 7,968 Farms Reporting Solar Panels Average Generating Capacity = 4,449 W Average Installation Cost = $31,947

10
Solar Panels: Number of Farms Top 5 States (2009)
")
11
Methane Digesters 121 operations in the U.S. had methane digesters 140 methane digesters across the nation Average installation cost was $1,718,562 Average digester produced 30.5 million cubic feet of methane

12
Questions ?

Similar presentations


 Homes Farms Remote Application Intermediate (10-250 kW) Village Power Hybrid Systems Distributed Power Large.>")


 Grants and Loans Guarantees & Renewable Energy Feasibility Studies June 5, 2009.>")