Download presentation
Presentation is loading. Please wait.

1
Distribution of World Population Growth Increases and Decreases
Natural Increase Fertility Mortality Population -increases in places where many more people are born than die -increases slowly in places where the number of births exceeds the number of deaths by only a small margin -declines in places where death outnumber births

2
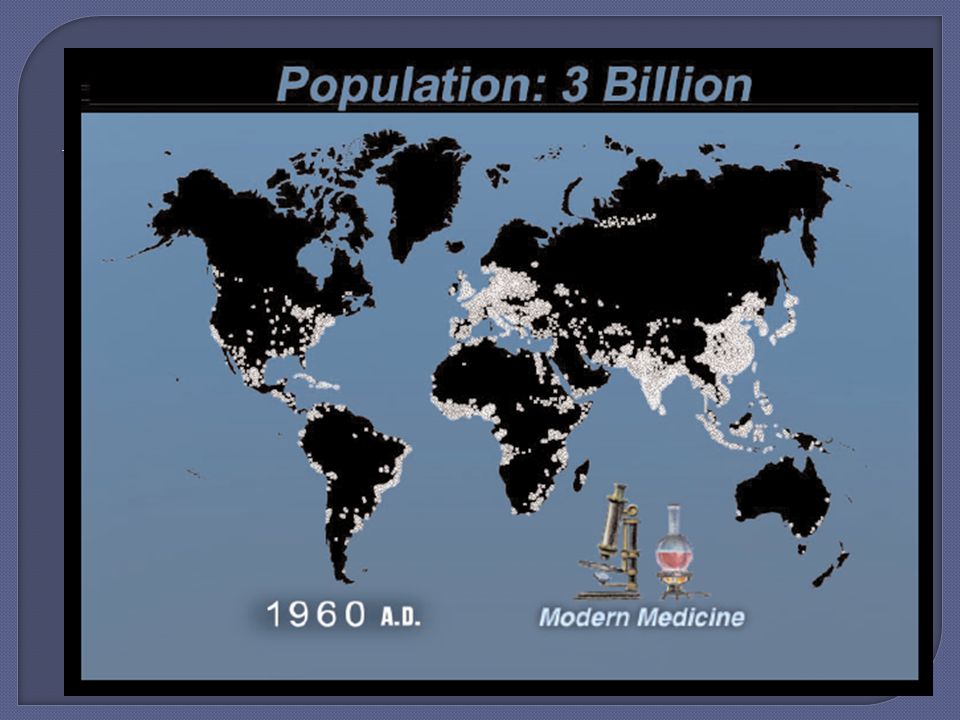
It took over 3,011,800 years for the world to reach its first 1 billion people
- 130 years to add another 1 billion ( ) -30 years to add another 1 billion ( ) -App. 15 years to add another 1 billion ( ) -App. 12 years to add another 1 billion ( ) - IS beginning to slow overall- about 2.5 million added over the last 10 years (growth rate of about 1.3% which is a slower rate of natural increase than which was about 2.2%)– about 80 million more each year Present estimates are for the population to reach 8-12 billion before the end of the 21st century.
 -30 years to add another 1 billion ( ) -App. 15 years to add another 1 billion ( ) -App. 12 years to add another 1 billion ( ) - IS beginning to slow overall- about 2.5 million added over the last 10 years (growth rate of about 1.3% which is a slower rate of natural increase than which was about 2.2%)– about 80 million more each year. Present estimates are for the population to reach 8-12 billion before the end of the 21st century.")
12
Natural Increase Rates
Small changes in the NIR% have a large impact – even a 1% change is huge considering the base population Doubling time – how long it takes for the population to double If we had continued at 2.2% world pop in 2100 would be 15 billion 100% of increase is in LDCs exceeds 2% in Asia, Africa, Middle East and Latin America but is negative in Europe Fig. 2-7: The natural increase rate (NIR) is the percentage growth or decline in the population of a country per year (not including net migration). Countries in Africa and Southwest Asia have the highest current rates, while Russia and some European countries have negative rates.
 is the percentage growth or decline in the population of a country per year (not including net migration). Countries in Africa and Southwest Asia have the highest current rates, while Russia and some European countries have negative rates.")
13
Crude Birth Rates Highest crude birth rates are in subsaharan africa lowest in europe Total fertility rate (TFR) number of births in a society avg # of children per woman TFR is about 2.6 Fig. 2-8: The crude birth rate (CBR) is the total number of births in a country per 1000 population per year. The lowest rates are in Europe, and the highest rates are in Africa and several Asian countries.
 number of births in a society avg # of children per woman. TFR is about 2.6. Fig. 2-8: The crude birth rate (CBR) is the total number of births in a country per 1000 population per year. The lowest rates are in Europe, and the highest rates are in Africa and several Asian countries.")
14
Total Births

15
Recall from yesterday’s lecture the major concentration centers and how they play a larger role in the Natural Increase of the world’s population.

16
World Population Growth 1950 - 2005
The percentage by which the population grew (NIR) declined during the late 20th century from its historic peak in the 1960s– the number of people added each year did not, however, decline. Fig. 2-6: Total world population increased from 2.5 to over 6 billion in slightly over 50 years. The natural increase rate peaked in the early 1960s and has declined since, but the number of people added each year did not peak until 1990.
 declined during the late 20th century from its historic peak in the 1960s– the number of people added each year did not, however, decline. Fig. 2-6: Total world population increased from 2.5 to over 6 billion in slightly over 50 years. The natural increase rate peaked in the early 1960s and has declined since, but the number of people added each year did not peak until")
17
Rates of Natural Increase
Crude Birth Rate (CBR)- Total # of live births per year for every 1,000 people alive CBR of 20 means that for every 1,000 people, 20 are born over a one year period Crude Death Rate (CDR)- Total # of deaths a year for every 1,000 people alive Natural Increase Rate (NIR) is the % by which a population grows in a year Subtract CDR% from CBR% Population may still be increasing despite a decreasing NIR Does not take into account migration into a country/region Crude – concerned with the whole rather than individuals or groups CBR - # of live births per year for every 1,000 CDR # of deaths per 1,000 Natural increase = cbr-cdr Logically, as the pop base increases, the easier it becomes to increase overall pop
- Total # of live births per year for every 1,000 people alive. CBR of 20 means that for every 1,000 people, 20 are born over a one year period. Crude Death Rate (CDR)- Total # of deaths a year for every 1,000 people alive. Natural Increase Rate (NIR) is the % by which a population grows in a year. Subtract CDR% from CBR% Population may still be increasing despite a decreasing NIR. Does not take into account migration into a country/region. Crude – concerned with the whole rather than individuals or groups. CBR - # of live births per year for every 1,000. CDR # of deaths per 1,000. Natural increase = cbr-cdr. Logically, as the pop base increases, the easier it becomes to increase overall pop.")
18
Practice: Country A CBR of 45/1,000 CDR of 21/1,000 %NIR? Country B CBR of 13/1,000 CDR of 23/1,000 %NIR? 4.5% 1.3% 2.1% 2.3% 2.4% -1%

19
Natural Increase Rates
Small changes in the NIR% have a large impact – even a 1% change is huge considering the base population (the difference between 1 and 2% could be the difference between adding 66 million or 132 million a year! Doubling time – how long it takes for the population to double If we had continued at 2.2% world pop in 2100 would be 15 billion Impact of Small changes on the NIR - even a 1% change is huge considering the base population (the difference between 1 and 2% could be the difference between adding 66 million or 132 million a year! Doubling Time- how long it takes for the population to double If we had continued at 2.2% world pop in 2100 would be 15 billion Fig. 2-7: The natural increase rate (NIR) is the percentage growth or decline in the population of a country per year (not including net migration). Countries in Africa and Southwest Asia have the highest current rates, while Russia and some European countries have negative rates.
 is the percentage growth or decline in the population of a country per year (not including net migration). Countries in Africa and Southwest Asia have the highest current rates, while Russia and some European countries have negative rates.")
20
World Population Growth, 1950–2050
Source: United Nations Population Division, World Population Prospects, The 2008 Revision. Almost 100% of the natural increase of the world population is in LDCs -NIR exceeds 2% in Asia, Africa, Middle East and Latin America but is negative in Europe… many African countries have CBRs over 40 where much of Europe average around 10 -U.S. currently around 1% NIR (1.10% in the 90s, project .5% by 2050) -Regional differences in the NIRs mean that most of the world’s additional people live in countries that are least able to maintain them
 -Regional differences in the NIRs mean that most of the world’s additional people live in countries that are least able to maintain them.")
21
Crude Birth Rates and Total Fertility Rates (TFR)
Total fertility rate (TFR) refers to the average number of children a woman will have throughout her child bearing years (15-49) Highest crude birth rates are in Sub-Saharan Africa lowest in Europe Total fertility rate (TFR) refers to the average number of children will have throughout her child bearing years (15-49) -TFR attempts to predict the future behavior of individual women depending on the degree of cultural change in a particular society Fig. 2-8: The crude birth rate (CBR) is the total number of births in a country per 1000 population per year. The lowest rates are in Europe, and the highest rates are in Africa and several Asian countries.
 refers to the average number of children a woman will have throughout her child bearing years (15-49) Highest crude birth rates are in Sub-Saharan Africa lowest in Europe. Total fertility rate (TFR) refers to the average number of children will have throughout her child bearing years (15-49) -TFR attempts to predict the future behavior of individual women depending on the degree of cultural change in a particular society. Fig. 2-8: The crude birth rate (CBR) is the total number of births in a country per 1000 population per year. The lowest rates are in Europe, and the highest rates are in Africa and several Asian countries.")
22
Infant Mortality Rates
Infant mortality rate (IMR) is the annual number of deaths of infants under 1 year of age per 1,000 live births - Highest rates are the poorest countries -IMR in Africa exceeds 10% - reflects a country’s healthcare system (lowest rates in Western Europe) - Lower IMRs = better doctors - US IMR is on the rise as is the maternal death rate – subgroups – African Americans and other minorities (i.e. Mexican/Latin American immigrants) have twice as high IMR – comparable to levels in Latin America and Asia because of lack of equal access to healthcare Fig. 2-10: The infant mortality rate is the number of infant deaths per 1000 live births per year. The highest infant mortality rates are found in some of the poorest countries of Africa and Asia. Infant mortality rate (IMR) is the annual number of deaths of infants under 1 year of age per 1,000 live births
 is the annual number of deaths of infants under 1 year of age per 1,000 live births. - Highest rates are the poorest countries. -IMR in Africa exceeds 10% - reflects a country’s healthcare system (lowest rates in Western Europe) - Lower IMRs = better doctors. - US IMR is on the rise as is the maternal death rate – subgroups – African Americans and other minorities (i.e. Mexican/Latin American immigrants) have twice as high IMR – comparable to levels in Latin America and Asia because of lack of equal access to healthcare. Fig. 2-10: The infant mortality rate is the number of infant deaths per 1000 live births per year. The highest infant mortality rates are found in some of the poorest countries of Africa and Asia. Infant mortality rate (IMR) is the annual number of deaths of infants under 1 year of age per 1,000 live births.")
23
Life Expectancy at birth
Life Expectancy at birth measures the average number of years a newborn infant can expect to live at current mortality levels -Same regional differences as in other slides (i.e. africa, europe) Life Expectancy at birth measures the average number of years a newborn infant can expect to live at current mortality levels Fig. 2-11: Life expectancy at birth is the average number of years a newborn infant can expect to live. The highest life expectancies are generally in the wealthiest countries, and the lowest in the poorest countries. World Life Expectancies
 Life Expectancy at birth measures the average number of years a newborn infant can expect to live at current mortality levels. Fig. 2-11: Life expectancy at birth is the average number of years a newborn infant can expect to live. The highest life expectancies are generally in the wealthiest countries, and the lowest in the poorest countries. World Life Expectancies.")
24
Crude Death Rates CDR does not fluctuate as much as the others. Lowest is 1/1,000 highest 19/1000, also doesn’t follow the usual pattern with many Asian countries having similar rates to the west – look at East Europe – Sub-Saharan Africa That is because each of these countries are in different stages of the demographic transition (discussed tomorrow!) Fig. 2-12: The crude death rate (CDR) is the total number of deaths in a country per 1000 population per year. Because wealthy countries are in a late stage of the Demographic Transition, they often have a higher CDR than poorer countries.
 Fig. 2-12: The crude death rate (CDR) is the total number of deaths in a country per 1000 population per year. Because wealthy countries are in a late stage of the Demographic Transition, they often have a higher CDR than poorer countries.")
Similar presentations


 CRUDE DEATH RATE (CDR)>")
 Total Fertility Rate (TFR) Crude Death Rate (CDR) Infant Mortality.>")


