Download presentation
Presentation is loading. Please wait.

1
Topic: Calculating Population Aim: In What Ways Can Demographers Measure Population?

4
Population Density: can be computed in up to three ways for a place.
Arithmetic Density Total number of objects in an area Computation: Divide the population by the land area Physiological Density Number of people supported by a unit area of arable land Computation: Divide the population by the arable land area Agricultural Density Ratio of the number of farmers to amount of arable land Computation: Divide the population of farmers by the arable land area Physiological density provides insights into the relation between the size of a population and the availability of resources in a region. Developed countries have lower agricultural densities, because technology and finance allow a few people to farm extensive land areas and feed many people.

5
Arithmetic (Population) Density:
Total number of people divided by total land area- used to compare conditions in different countries I.E. - For the United States, we would divide 300 million (# of people) by 3.7 million square miles. The result shows the that U.S. has an arithmetic (or population) density of 80 persons per square mile.
 by 3.7 million square miles. The result shows the that U.S. has an arithmetic (or population) density of 80 persons per square mile.")
6
A street in Hong Kong, one of the most densely-populated places in the world.

7
A street in Ulan Bator, Mongolia - the least densely-populated country in the world

8
FIGURE 2-5 ARITHMETIC DENSITY Geographers rely on the arithmetic density to compare conditions in different countries because the two pieces of information–total population and total land area–are easy to obtain. The highest arithmetic densities are found in Asia, Europe, and Central America. The lowest are in North and South America and South Pacific. ARITHMETIC DENSITY Geographers rely on the arithmetic density to compare conditions in different countries because the two pieces of information–total population and total land area–are easy to obtain. The highest arithmetic densities are found in Asia, Europe, and Central America. The lowest are in North and South America and South Pacific.

9
Physiological Density:
The number of people supported by a unit area of arable (farmable) land. The higher the physiological density, the greater the pressure on the land to produce sufficient food Reveals the relationship between size of a population and the availability of resources in a region.
 land. The higher the physiological density, the greater the pressure on the land to produce sufficient food. Reveals the relationship between size of a population and the availability of resources in a region.")
10
FIGURE 2-6 PHYSIOLOGICAL DENSITY Physiological density provides insights into the relationship between the size of a population and the availability of resources in a region. The relatively large physiological densities of Egypt and the Netherlands demonstrates that crops grown on a hectare of land in these two countries must feed far more people than in the United States or Canada, which have much lower physiological densities. The highest physiological densities are found in Asia, sub-Saharan Africa, and South America. The lowest are in North America, Europe, and South Pacific. PHYSIOLOGICAL DENSITY Physiological density provides insights into the relationship between the size of a population and the availability of resources in a region. The relatively large physiological densities of Egypt and the Netherlands demonstrates that crops grown on a hectare of land in these two countries must feed far more people than in the United States or Canada, which have much lower physiological densities. The highest physiological densities are found in Asia, sub-Saharan Africa, and South America. The lowest are in North America, Europe, and South Pacific.

11
Physiologic Population Density
Luxor, Egypt Egypt’s arable lands are along the Nile River Valley. Moving away from the river a few blocks, the land becomes sandy and wind-sculpted.

12
Agricultural Density:
Two countries can have similar physiological densities, but they may produce significantly different amounts of food because of different economic conditions. Agricultural density is the ratio of the number of farmers to the amount of arable land. The Netherlands has a much higher physiological density than does India but a much lower agricultural density.

13
FIGURE 2-7 AGRICULTURAL DENSITY The highest agricultural densities are found in Asia and sub-Saharan Africa. The lowest are in North America, Europe, and South Pacific. AGRICULTURAL DENSITY The highest agricultural densities are found in Asia and sub-Saharan Africa. The lowest are in North America, Europe, and South Pacific.

14
Components of Population Growth

15
Why Is Global Population Increasing?
Components of Population Growth Natural Increase About 82 million people are added to the population of the world annually. Rate of natural increase affects the doubling time– number of years needed to double the population, assuming a constant rate of natural increase. Twenty-First Century Rate (1.2 percent): 54 years Global population in 2100 would reach 24 billion. 1963 (2.2): 35 years Global population in 2010 would have been 10 billion instead of nearly 7 billion. More than 95 percent of the natural increase is clustered in developing countries.
: 54 years. Global population in 2100 would reach 24 billion (2.2): 35 years. Global population in 2010 would have been 10 billion instead of nearly 7 billion. More than 95 percent of the natural increase is clustered in developing countries.")
16
Crude Birth Rate: Crude Birth Rate (CBR) is the annual number of live births per 1000 people in a population.
 is the annual number of live births per 1000 people in a population.")
17
Figure: 02-08 Title: Crude birth rate (CBR). Caption: The crude birth rate is the total number of live births in a year for every 1,000 people alive in the society. The global distribution of crude birth rates parallels that of natural increase rates. Again, the highest crude birth rates are found in sub-Saharan Africa and the Middle East, whereas the lowest are in Europe. The crude birth rate is the total number of live births in a year for every 1,000 people alive in the society. The global distribution of crude birth rates parallels that of natural increase rates. Again, the highest crude birth rates are found in sub-Saharan Africa and the Middle East, whereas the lowest are in Europe.

18
CDR/NIR: Crude Death Rate: Total # of deaths in a year for every 1,000 people alive Natural Increase Rate: % by which a population grows per year. Compute by subtracting CDR from CBR (in percentage) CBR is 20, CDR is 5 (per thousand), the NIR is 15 per 1,000, or 1.5% Mortality Rate by Country
 CBR is 20, CDR is 5 (per thousand), the NIR is 15 per 1,000, or 1.5% Mortality Rate by Country.")
19
Figure: 02-12 Title: Crude death rate (CDR). Caption: Crude death rate is the total number of deaths in a year for every 1,000 people alive in the society. The global pattern of crude death rates varies from those for the other demographic variables already mapped in this chapter. First, although Europe has the lowest natural increase, crude birth, and infant mortality rates, it has relatively high crude death rates. Second, the variance between the highest and lowest crude death rates is much lower than was the case for the crude birth rates. The concept of the demographic transition helps to explain the distinctive distribution of crude death rates. Crude death rate is the total number of deaths in a year for every 1,000 people alive in the society. The global pattern of crude death rates varies from those for the other demographic variables. First, although Europe has the lowest natural increase, crude birth, and infant mortality rates, it has relatively high crude death rates. Second, the variance between the highest and lowest crude death rates is much lower than was the case for the crude birth rates. The concept of the demographic transition helps to explain the distinctive distribution of crude death rates.

20
FIGURE 2-10 NATURAL INCREASE RATE The world average is currently about 1.2 percent. The countries with the highest NIRs are concentrated in Africa and Southwest Asia. NATURAL INCREASE RATE The world average is currently about 1.2 percent. The countries with the highest NIRs are concentrated in Africa and Southwest Asia.

21
Zero Population Growth (ZPG): If the CDR is the same as the CBR
Zero Population Growth (ZPG): If the CDR is the same as the CBR. True of most developed regions (North America, Japan, Europe, etc.). Therefore, any increase in population of these countries is due to what? Negative NIR: If the CDR is higher than the CBR Demographic equation: the global difference between births and deaths
: If the CDR is the same as the CBR. True of most developed regions (North America, Japan, Europe, etc.). Therefore, any increase in population of these countries is due to what Negative NIR: If the CDR is higher than the CBR. Demographic equation: the global difference between births and deaths.")
22
6 Factors that Affect NIR Discussion:
Economic Development: Education Gender Empowerment Healthcare Cultural Traditions Public Policy Explain how each of the aforementioned factors might affect the Natural Increase Rate of a country. Be specific.

23
6 Factors That Affect NIR?
Economic Development: affects available healthcare, employment, nutrition, etc. Generally, increases in economic development lead to decreases in fertility and growth rate Education: affects fertility, use of contraception (birth control), etc. Better education leads to lower fertility rates and lower rates of natural increase Gender Empowerment: opportunities available to women. When women have more economic and political access, power, and education, fertility drops.
, etc. Better education leads to lower fertility rates and lower rates of natural increase. Gender Empowerment: opportunities available to women. When women have more economic and political access, power, and education, fertility drops.")
24
6 Factors That Affect NIR?
Healthcare: has contradictory effects. Improved healthcare in less-developed countries has decreased infant mortality and increased life expectancy, thus contributing to population growth Cultural Traditions: can encourage high fertility rates by limiting female employment outside the home and discouraging use of contraception Public Policy: governmental programs, like China’s ‘One Child Policy’ of 1979, provides economic incentives for people having few children and penalties for those who have more than one.

25
Doubling Time: The amount of time it takes the world to double it’s population- in the 1960’s & 70’s the doubling time was about 35 years Major regional differences in rates of growth. NIR exceeds 3% in many parts of Africa, while some of Western Europe experiences negative population growth.

26
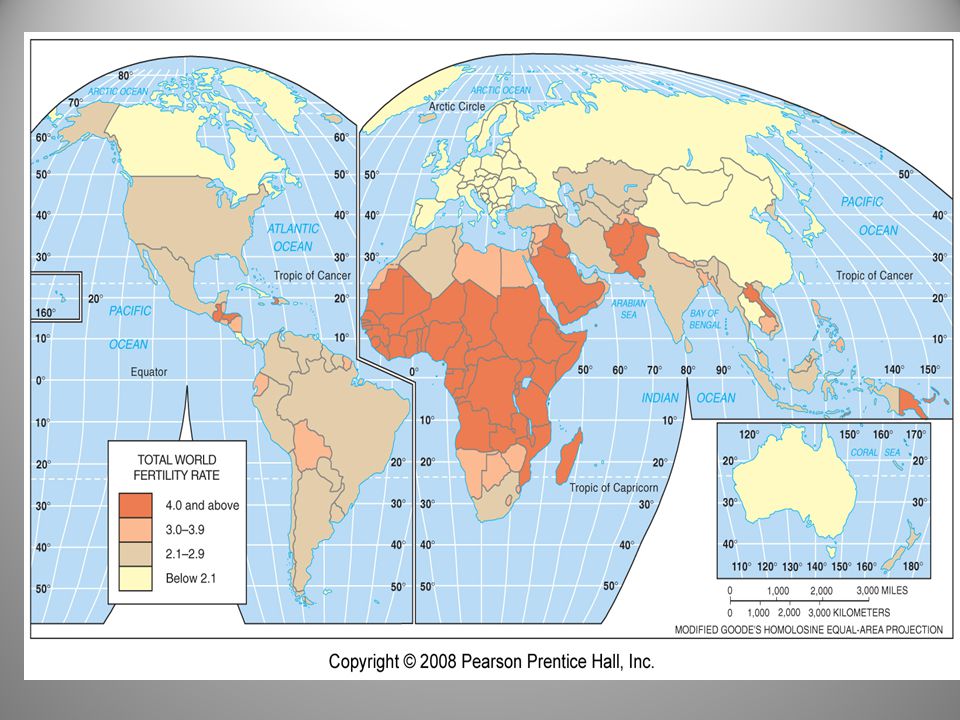
Total Fertility Rate (TFR):
Measures the number of births in a country TFR is average number of children a woman will have during her ‘childbearing years’ (approx. ages 15-49) TFR exceeds six in some African nations.
 TFR exceeds six in some African nations.")
28
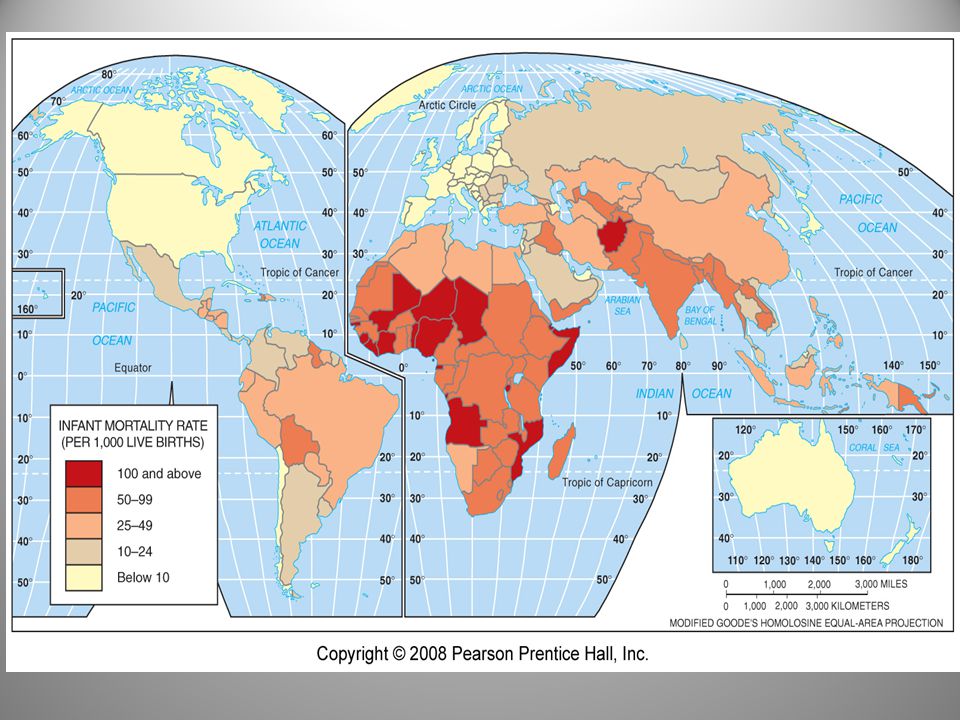
Infant Mortality Rate (IMR):
Annual number of infant deaths (children under 1 year of age), compared with total live births, expressed as a number of deaths per 1,000. Exceeds 10% in some nations Significant factor limiting population growth Babies born in the West expected to live into late Seventies, but only forties in most Sub-Saharan countries!
, compared with total live births, expressed as a number of deaths per 1,000. Exceeds 10% in some nations. Significant factor limiting population growth. Babies born in the West expected to live into late Seventies, but only forties in most Sub-Saharan countries!")
30
Life Expectancy: Average length of someone’s life.
Calculation of LE affected by infant, child, and maternal mortality rates Varies greatly from place to place and within populations Factors: violence, disease, poor healthcare, smoking, etc Life Expectancy at Birth in 2003 Men Women US Japan Nepal Kenya France

31
60 minutes – Bill & Melinda Gates

Similar presentations


 Total Fertility Rate (TFR) Crude Death Rate (CDR) Infant Mortality.>")


